Abstract
Movement of livestock production within a country or region has implications for genetics, adaptation, well-being, nutrition, and production logistics, particularly in continental-sized countries, such as Brazil. Cattle production in Brazil from 1977 to 2011 was spatialized, and the annual midpoint of production was calculated. Changes in the relative production and acceleration of production were calculated and spatialized using ARCGIS®. Cluster and canonical discriminant analyses were performed to further highlight differences between regions in terms of cattle production. The mean production point has moved from the Center of Minas Gerais State (in the southeast region) to the North of Goiás State (in the Midwest region). This reflects changes in environmental factors, such as pasture type, temperature and humidity. Acceleration in production in the northern region of Brazil has remained strong over the years. More recently, “traditional” cattle-rearing regions, such as the south and southeast, showed a reduction in growth rates as well as a reduction in herd size or internal migration over the period studied. These maps showed that this movement tends to be gradual, with few regions showing high acceleration or deceleration rates.
Introduction
The occupation of geographic space and territory has been a constant concern of agribusiness and society and, consequently, of public policies. However, beef demand is growing worldwide [1] and stimulates increased productivity and production. This has occurred mainly in countries with areas for expansion of beef cattle, such as Brazil. Only between 1990 and 2009, the Brazilian cattle herd has grown by 33%, mainly through expansion in the Midwest region, due to the presence of several favorable elements, such as the presence of external drivers, including socioeconomic factors [2].
However, livestock development within a country or region has implications on several fronts (genetics, adaptation, well-being, nutrition), particularly in continental-sized countries such as Brazil. This movement in production is also accompanied by the need for adequate infrastructure (abattoirs, transport, energy, inputs industries), commercialization and marketing, as well as technical support. It also fuels the need for credit programs as well as research and development activities to support intensification goals [3].
Furthermore, statistical analyses have shown only quantitative changes in herd productivity indicators and associated regions and do not enable a more detailed temporal interpretation to understand the different phenomena and dynamic trends of an activity in the territory. Thus, the use of Geographical Information Systems (GIS) has resulted in a better and more timely visualization of production systems and can aid in the identification of problematic areas [4]. GIS can aid in the identification of areas that are suitable for the expansion of production [5], as well as identification of genetic resources for conservation [6]. Thus, the objective of this article is to study the dynamics of cattle production in Brazil on a municipal scale and to identify potential areas of strangulation for continued growth and variables that could limit the increase in production and productivity of the cattle in Brazil.
Methods
This study considered all municipalities (5561 in total) in five regions of Brazil. Data on cattle production in Brazil were obtained from the website of the Brazilian Institute for Geography and Statistics [7] from 1977 to 2011.
Maps were generated using the number of animals/head of cattle (production) for each year, which was then converted into a raster format (GRID) and processed using ENVI 4.5 software.To analyze the dynamics of production growth, maps were drawn for the relative growth rate (GR %) of production by municipality by dividing the time interval analyzed into seven equal periods, using the sum of 5 years of production in each period examined (1977 to 1981 1982 to 1986, 1987 to 1991, 1992 to 1996, 1997 to 2001, 2002 to 2006, and 2007 to 2011). The relative growth rate was calculated using the following equation (Eq 1):
| Eq 1 |
The relative growth rate resulted in seven maps. Data were classified as high growth (growth ≥ 50%), low growth (between 10 and 49.9%), stagnation (between +9.9 and -9.9%), low reduction (between -10 and– 49.9%) and high reduction (≤ -50%). The acceleration of growth rate was obtained by the relative differences in the images, which resulted in six maps calculated as GRPsP − GRPvP, where GRPsP is the Growth Rate in the Present Period and GRPvP is the Growth Rate in the Previous Period. These maps were generated on a continuous scale, as these represent differences between two periods, presented as the beginning of one period until the end of the next period (p.ex 1977 to 1986).
The spatial midpoint of production in the country was calculated for each year to assess the direction of production in the country. The latitude (Eq 2) and longitude (Eq 3) midpoint were obtained by multiplying the sum of the geographic coordinates of the municipality and their production divided by the number of municipalities for each year.
| Eq 2 |
| Eq 3 |
Cluster (PROC CLUSTER) and canonical discriminant (PROC CANDISC) analyses were performed to further highlight differences between regions in terms of cattle production using SAS® v.9.3 (SAS Institute, Cary, North Carolina). Two groups of clusters of municipalities were formed according to the relative growth and acceleration calculated above. Cluster means for acceleration and relative growth were compared using an analysis of variance and mean separation using Tukey test (P<0.05) after standardization. Discriminant canonical analyses were used to identify regions and municipalities that behaved in a different manner.
Results
Several different movements have been observed over the years: North (1977–1991; 2003–2011) Midwest (1978–1981; 1991–1995) and Northwest (1995–2003). Cattle numbers grew in all regions over the period studied (Table 1). The most expressive growth was initially observed in the Northeast and Midwest regions, which sustained this growth over the period; however, this growth has been slower in recent years (Table 2).
Table 1. Relative growth of cattle numbers and percentage (standard error) in Brazil from 1977 to 2011 in 5-year periods by region.
| Year Interval | ||||||||||||||
|---|---|---|---|---|---|---|---|---|---|---|---|---|---|---|
| Regions | 77–81 | 82–86 | 87–91 | 92–96 | 97–01 | 02/06 | 07/11 | |||||||
| N°head | % | N°head | % | N°head | % | N°head | % | N°head | % | N°head | % | N°head | % | |
| MW | 298,900a | 43.31b | 388,884a | 17.13b | 969,797a | 25.22a | 564,002a | 14.58b | 621,752a | 14.45b | 749,685a | 8.83c | 757,887a | 9.04b |
| (5582) | (7.91) | (5821) | (3.24) | (6156) | (4.75) | (6833) | (3.48) | (7076) | (1.51) | (8470) | (1.54) | (8362) | (0.8) | |
| N | 66,973cd | 375.64a | 101,116b | 78.58a | 144,380b | 27.91a | 196,092b | 32.84a | 255,299b | 43.67a | 415,802b | 39.83a | 451,584b | 19.1a |
| (1691) | (146.53) | (2102) | (24.19) | (2901) | (5.89) | (3026) | (7.71) | (3193) | (3.95) | (5766) | (4.48) | (6691) | (3.2) | |
| NE | 580,62d | 30.41b | 61,998c | 13.38b | 71,232d | 8.59b | 66,548d | -1.81c | 63,395d | 0.10c | 72,338c | 22.76b | 80,417c | 8.76b |
| (442) | (1.45) | (452) | (1.25) | (465) | (0.77) | (475) | (1.22) | (465) | (2.05) | (492) | (1.18) | (549) | (1.44) | |
| S | 95,551bc | 18.76b | 103,429b | 5.77b | 106,362cd | -0.34c | 109,898c | 6.14bc | 111,485c | 1.62c | 116,694c | 2.79c | 115,926c | 9.53b |
| (1421) | (0.96) | (1450) | (1.17) | (1421) | (0.90) | (1348) | (1.34) | (1220) | (0.95) | (1302) | (1.3) | (1262) | (0.94) | |
| SE | 106,246b | 2.35c | 105,098b | 5.83b | 108,424bc | 5.23bc | 111,719c | 3.27c | 110,930c | 2.78c | 116,476c | 8.24c | 115,183c | 5.73b |
| (772) | (2.91) | (816) | (1.42) | (864) | (0.84) | (819) | (0.90) | (765) | (1.29) | (822) | (0.77) | (807) | (0.89) | |
| Average | 229,658 | 94.09 | 152,105 | 24.13 | 280,039 | 13.32 | 209,652 | 11.00 | 232,572 | 12.52 | 294,199 | 16.49 | 304,1994 | 10.43 |
| Total | 1,148.29 | 760,525 | 1,400.20 | 1,048.26 | 1,162.86 | 1,470.995 | 1,520.997 | |||||||
MW–Midwest; N–north; S–South, SE–Southeast, NE–Northeast. Means in the same column with different letters indicate a difference according to the Tukey test (P<0.05).
Table 2. Cattle production in Brazil from 1977 to 2011 in 5-year periods per region with regard to the number of head and percentage acceleration (standard error).
| Regions | Year Interval | |||||||||||||
|---|---|---|---|---|---|---|---|---|---|---|---|---|---|---|
| 77–81 | 82–86 | 87–91 | 92–96 | 97–01 | 02/06 | 07/11 | ||||||||
| N°head1 | % | N°head | % | N°head | % | N°head | % | N°head | % | N°head | % | Nºhead | % | |
| MW | 59,780a | -5.27a | 77,777a | -31.3a | 93,959a | -5.19b | 112,800a | -14.35b | 124,350a | -3.42a | 149,937a | -7.62c | 151,577a | 0.22a |
| (5582) | (7.70) | (5821) | (7.84) | (6156) | (3.11) | (6833) | (5.63) | (7076) | (3.67) | (8470) | (1.68) | (8362) | (1.60) | |
| N | 13,395b | 352.82a | 20,223b | -308.67b | 28,876b | -52.94a | 39,218b | -3.24ab | 51,060b | 2.46a | 83,160b | -3.94c | 90,317b | -20.69b |
| (1691) | (146.71) | (2102) | (150) | (2901) | (24.90) | (3026) | (10.25) | (3193) | (8.63) | (5766) | (5.91) | (6691) | (5.52) | |
| NE | 11,612b | 11.34a | 12,400b | -16.95a | 14,246c | -5.35b | 13,310c | -10.86b | 12,679c | 1.00a | 14,468c | 22.52a | 16,083c | -14.12b |
| (442) | (2.06) | (452) | (2.05) | (475) | (1.54) | (465) | (1.66) | (378) | (1.69) | (492) | (1.66) | (549) | (1.63) | |
| S | 19,110b | 6.60a | 20,686b | -13.1a | 21,272c | -5.8b | 21,980c | 5.19a | 22,297c | -6.24a | 23,339c | 1.20b | 23,185c | 6.74a |
| (1421) | (1.38) | (1450) | (1.59) | (1421) | (1.43) | (1348) | (1.75) | (1220) | (1.83) | (1302) | (1.47) | (1262) | (1.16) | |
| SE | 21,249b | -26.47a | 21,020b | 2.64a | 21,685c | -0.68b | 22,344c | -2.23ab | 22,186c | -1.16a | 23,295c | 4.39b | 151,577a | -2.45a |
| (772) | (3.34) | (816) | (3.22) | (864) | (1.70) | (819) | (2.82) | (765) | (1.69) | (822) | (2.43) | (8362) | (1.88) | |
| Average | 25,029 | 67.80 | 30,421.20 | -73.47 | 36,007.60 | -13.99 | 41,930.40 | -5.09 | 46,514.40 | -1.47 | 58,839.80 | 3.31 | 86,547.80 | -6.06 |
| Total | 125,146 | 152,106 | 180,038 | 209,652 | 232,572 | 294,199 | 432,739 | |||||||
1 Number of animals per municipality per year; MW–Midwest; N–north; S–South, SE–Southeast, NE–Northeast.
Means in the same column with different letters indicate a difference according to the Tukey test (P<0.05).
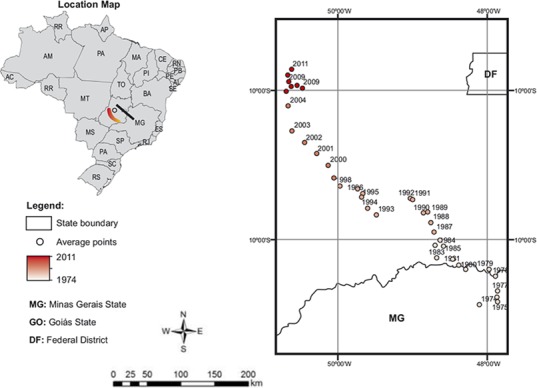
This indicated that the mean production point has moved from the Center of Minas Gerais State (in the southeast region) to the North of Goiás State (in the Midwest region) (Fig 1). This change also reflected a strong change in environmental factors such as NDVI (Normalized Difference Vegetation Index), temperature and humidity. The northeastern region underwent a deceleration in the 1990s similar to the southeast at the end of this period. The southeastern and southern regions showed the slowest growth during these periods.
Fig 1. Midpoint of cattle production in Brazil by year.
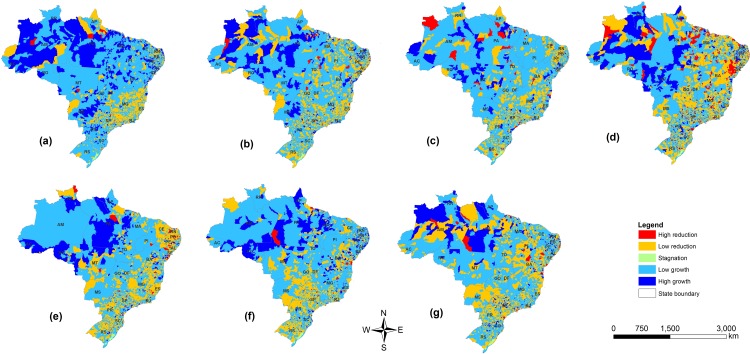
In recent years, strong growth was observed in the northern region of Brazil (Fig 2G) with a reduction in the south of the Midwest region and along the northern border with Colombia. This growth in the north can be observed from the early 2000s (Fig 2E–2G); however, this reduction is a more recent phenomenon. Growth in the Midwest was observed in earlier years (Fig 2A–2C). While the Pantanal region of Brazil showed strong growth in cattle numbers in the 1970s (Fig 2A), the growth has recently been reduced (Fig 2G).
Fig 2. Growth of cattle production in Brazil by municipality by period: (A) 1977–1981; (B) 1982–1986; (C) 1987–1991; (D) 1992–1996; (E) 1997–2001; (F) 2002–2006; and (G) 2007–2011.
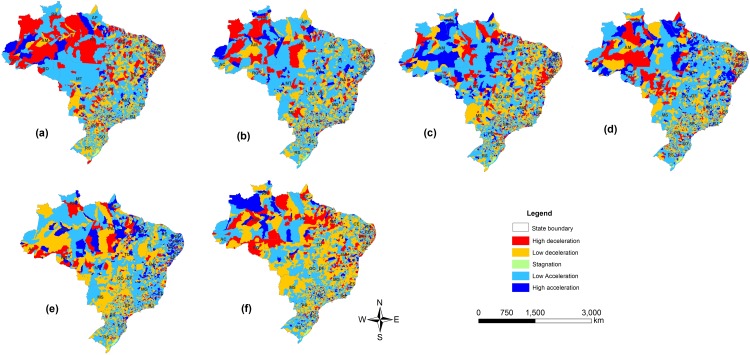
The acceleration in production in the northern region of Brazil has remained strong over the years (Fig 3), but the southern part of this region and Midwest showed stagnation in the early years of this study. More recently, these regions have shown a reduction in growth rates and “traditional” cattle-rearing regions, such as the south and southeast, which, in general, have demonstrated a reduction in growth rates as well as a reduction in herd size or internal migration over the period studied. The maps showed that this movement tends to be gradual, with few regions showing high acceleration or deceleration rates.
Fig 3. Acceleration of Cattle Production in Brazil by period: (A) 1977–1986; (B) 1982–1991; (C) 1987–1996; (D) 1992–2001; (E) 1997–2006; and (F) 2002–2011.
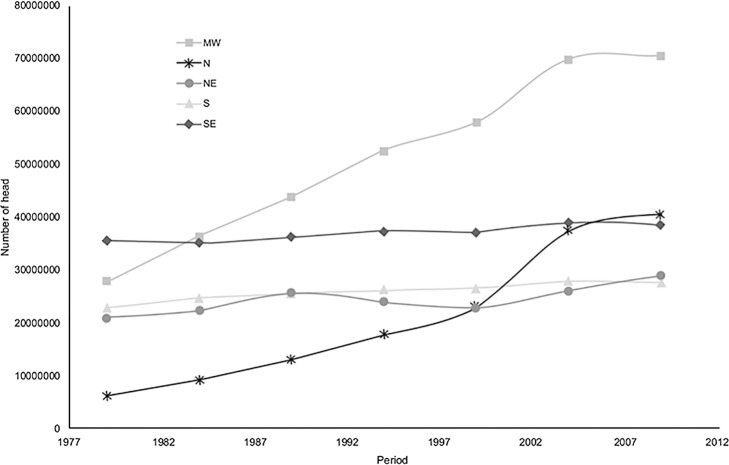
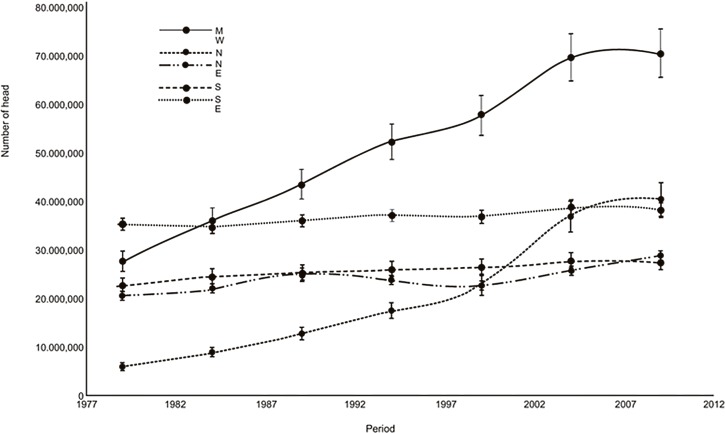
The relative increase in production in the Midwest and northern regions is evident in Fig 4, which is considerably higher compared to other regions. In the northern region, because the original herd was small, the initial acceleration (1980–1990) was high with the migration of cattle production from other regions, but in numeric terms, the herd size has only become expressive within the last 10 years. Although there was a high acceleration in production in the region since the 1980s, this growth has decreased significantly in recent years.
Fig 4. Cattle numbers by region in Brazil (1977–2012) with error bars.
The Midwest and northern regions are highlighted for their increase in cattle production over the period studied, in particular, the states of Mato Grosso do Sul, Goias, Mato Grosso (Midwest region) and Roraima (northern region). These two regions are also important for acceleration in production, which is specifically highlighted in the Northern states of Para, Roraima and Acre (Northern region) as well as the Midwestern state of Mato Grosso.
Clusters formed according to relative growth and acceleration data showed that a small part of the municipalities is responsible for the largest relative growth (Table 3, cluster 4) and acceleration in growth (Table 4, cluster 3). Importantly, these clusters do not indicate the same group of municipalities in the two analyses.
Table 3. Clusters of Brazilian municipalities according to the relative growth in the number of cattle (standard error) and the percentage of the total herd from 1977 to 2011 in 5-year periods.
| Cluster | N° of municipalities | Cluster totals | |||||||||||||
|---|---|---|---|---|---|---|---|---|---|---|---|---|---|---|---|
| 77–81 | 82–86 | 87–91 | 92–96 | 97–01 | 02–06 | 07–11 | |||||||||
| N° head | % | N° head | % | N° head | % | N° head | % | N° head | % | N° head | % | N° head | % | ||
| 1 | 4586 | 112,079,170a(781) | 99.33a | 12,339,5441a(830) | 97.01a | 13,363,0443a(886) | 92.97a | 13,531,0694a(932) | 85.95a | 13,331,7659a(919) | 79.79a | 15,176,3196(1086) | 76.00a | 15,592,9590a(1078) | 75.72a |
| 2 | 37 | 9,514c(256) | 0.01b | 53,324c(958) | 0.04b | 106,343c(1507) | 0.07c | 510,618c(4368) | 0.32d | 2,020,695bc(17107) | 1.21c | 4,938,362(41844) | 2.47c | 61,44,112b(53428) | 2.98c |
| 3 | 472 | 622,510b(334) | 0.55b | 3,508,974b(1237) | 2.76b | 7,745,821b(2067) | 5.39b | 14,258,079b(2964) | 9.06b | 19,506,141b(3504) | 11.67b | 27,747,408(5022) | 13.90b | 27,881,597b(5159) | 13.54b |
| 4 | 441 | 76c(1) | 0.00b | 134,185c(204) | 0.10b | 2,135,892b(1006) | 1.49bc | 7,213,948b(1748) | 4.58c | 11,880,724b(2370) | 7.11b | 14,225,586(3220) | 7.12b | 14,594,619b(3556) | 7.09c |
| 5 | 22 | 123,352bc(3846) | 0.11b | 102,609c(3195) | 0.08b | 124,963c(3616) | 0.09c | 131,216c(2937) | 0.08d | 365,547c(5487) | 0.22c | 1,016,667(16864) | 0.51c | 1,389,080b(25859) | 0.68d |
Means in the same column with different letters indicate a difference according to the Tukey test (P<0.05).
Table 4. Cluster of Brazilian municipalities according to the acceleration of growth in the number of cattle (Standard error) and the percentage of the total herd over the 5-year period.
| Cluster | Number of municipalities | Cluster totals | |||||||||||||
|---|---|---|---|---|---|---|---|---|---|---|---|---|---|---|---|
| 77–81 | 82–86 | 87–91 | 92–96 | 97–01 | 02–06 | 07–11 | |||||||||
| N° head | % | N° head | % | N° head | % | N° head | % | N° head | % | N° head | % | N° head | % | ||
| 1 | 416 | 475,276b(362) | 0.42 | 2,136,630b(1,000) | 1.68 | 4,902,490b(1,627) | 3.41 | 8,995,882b(2,242) | 5.71 | 13,554,254b(2,766) | 8.11 | 23,221,157b(4,572) | 11.64 | 26,225,864b(5,249) | 12.75 |
| 2 | 48 | 9,513c(197) | 0.01 | 231,130c(3,643) | 0.18 | 359,335c(5,313) | 0.25 | 621,111c(6,783) | 0.39 | 1,651,891c(12,985) | 0.99 | 3,943,384c(33,012) | 1.98 | 4,687,262c(42,007) | 2.28 |
| 3 | 689 | 4,665c(6) | 0.00 | 422,420c(242) | 0.33 | 3,638,908b(900) | 2.53 | 11,707,855b(1629) | 7.44 | 18,046,189b(1,849) | 10.80 | 22,352,493b(2,452) | 11.20 | 22,956,642b(2,558) | 11.16 |
| 4 | 34 | 171,927b(2,541) | 0.15 | 166,131c(2,172) | 0.13 | 200,419c(2,434) | 0.14 | 303,915c(3,544) | 0.19 | 641,732c(7,961) | 0.38 | 1,136,294c(12,952) | 0.57 | 1,229,481c(14,206) | 0.60 |
| 5 | 4364 | 112,173,230a(816) | 99.41 | 124,238,215a(870) | 97.68 | 134,642,308a(932) | 93.67 | 135,795,385a(986) | 86.26 | 133,196,461a(990) | 79.72 | 148,910,406a(1,171) | 74.62 | 150,607,922a(1,151) | 73.21 |
| Total | 112,834,613 | 127,194,528 | 143,743,461 | 157,424,150 | 167,090,528 | 199,563,736 | 205,707,173 | ||||||||
Means in the same column with different letters indicate a difference according to the Tukey test (P<0.05).
The canonical score plot of the first two canonical functions (Can1 and Can2) for each municipality are plotted in Figs 5–7. These reflect the highest variance in the discriminant model and provide a summary of the separation of the municipalities. Both increase and relative increases as well as acceleration of production are observed in the Midwest, Southeast and Northern regions, with only a few municipalities in each of these regions are responsible for these changes. These municipalities showed both marked growth and retraction in given periods. For example São Félix do Xingu in the Northern State of Pará went from less than 10,000 head to more than 1.9 million in the period studied, while Ribas do Rio Pardo, Corumbá, Juara and Cáceres, all in the Midwest, also saw significant increases in cattle numbers. Municipalities in the South (Alegrete, Bagé, São Gabriel), although showing reasonably high numbers of animals (approx 0.5 million), did not show significant changes in these numbers in the period shown, which may reflect the small variation in the herd of this region.
Fig 5. Canonical analysis of relative production) in cattle production in Brazil (N–North, NE–Northeast, SE–Southeast, S–South, and MW–Midwest).
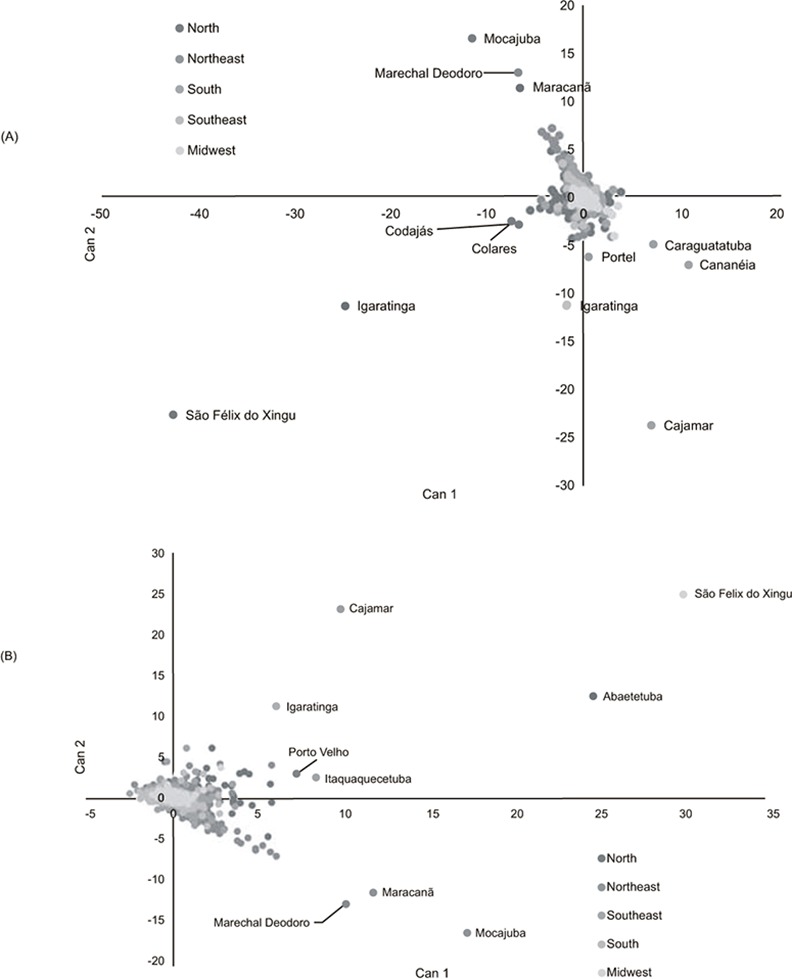
(Can 1 and Can 2 are the first tow canonical scores for each municipality). Each point on the graph represents a municipality, with those that are named showing highest discriminatory values.
Fig 7. Total cattle numbers (periods of 5 years) in cattle production in Brazil (N–North, NE–Northeast, SE–Southeast, S–South, and MW–Midwest).
Fig 6. Canonical analysis of acceleration in cattle production in Brazil (N–North, NE–Northeast, SE–Southeast, S–South, and MW–Midwest).
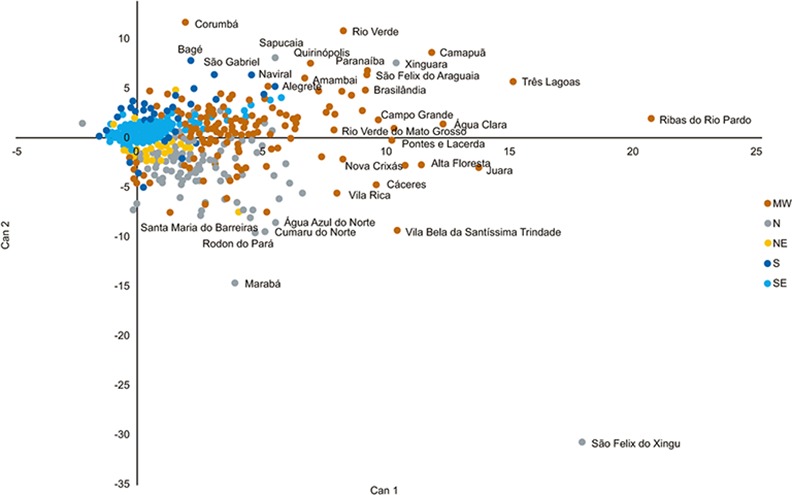
(Can 1 and Can 2 are the first tow canonical scores for each municipality). Each point on the graph represents a municipality, with those that are named showing highest discriminatory values.
Discussion
The causes of the geographical dynamics of the Brazilian cattle herd were originally associated with the need to meet the internal demand for beef, particularly in the 1970s and 1980s. The needs to expand the agricultural frontier in Brazil, the entry of foreign abattoir industries and the opening of markets to export processed beef to the United States have been motivated by the livestock sector and their migration to land areas at lower costs. The existence of a secure market stimulated investments in animal production and expansion to areas that were further from production centers. In this period, the driver was the existence of cheap land, which facilitated the increase in activity [8]. Subsequently, at the end of the 1990s, there was a greater increase in productivity rather than herd numbers, including a reduction in the area occupied by the activity.
Moreover, the need for Brazilian cattle growth in this decade was approximately 20%, however, the increase in productivity (weight kg/head/year) was around 30%, demonstrating a considerable gain in efficiency.
The adoption of technologies changed beef cattle production and productivity, particularly by increasing the weaning rate and weaning weight and reducing the age at slaughter and first mating. Between the years 2000–2010, weaning rate increased from 57 to 68%, with slaughter at 33 months of age, while weaning weight increased from 167 kg to 190 kg, and the age at first breeding of heifers went from 36 to 30 months. Technological developments in beef cattle production enabled Brazil to achieve an outstanding position in the international beef market. Between 1960 and 2010, the Brazilian cattle herd increased by 251%, and the stocking rate evolved from 0.47 head/hectare to 1.2 head/ha with an offtake rate of approximately 20% [9]. During this decade, the high prices of agricultural commodities, environmental restrictions and the high price of land in the Midwest region of Brazil, produced a new wave of cattle migration toward to the North, constituting 22% of the total effective of the country.
Intensification has been suggested as the means for the cattle industry [10] to reduce pressure on forest margins and free-up land for soybean or sugarcane production. The sugarcane expansion resulted in a significant reduction of pastures and number of cattle and higher economic growth compared to neighboring areas [11]. However, it could not be established to what extent the discontinuation of cattle production induced the expansion of pastures in other areas, thereby potentially resulting in indirect deforestation. However, these results indicate that the potential migration of cattle production reached further than the neighboring expansion regions. Therefore, a positive correlation between pasture, deforestation and cattle growth rate had existed in these Amazonian regions.
This is also the mainstay of Brazil's plan for the mitigation of greenhouse gas emissions [3], the environmental effect of animal production was crucial in the promotion of sustainability of agriculture production [12]. In the livestock sector, the animal productivity is related to food intake and weight gain efficiency, thereby generating methane emissions. Thus, the low beef cattle productivity index becomes the big problem of emission of greenhouse gases. This can be exacerbated by increased temperature in the region that can reduce up to 25% carrying capacity of pastures. All of these factors reinforce the need for seeking more efficient systems of land use with constant monitoring of its dynamics. Furthermore, the major drivers of sustainability in agriculture were the demands of the food market.
The original mid-point of cattle production was the so-called “Triângulo Mineiro or Mineiro Triangle” in the Minas Gerais State, which was the main region of cattle production in Brazil up to the turn of the millennium in terms of the number of animals as well as the history and culture of cattle ranchers. The Mato Grosso and Goias States constitute as a physiographic continuation of the north and northwest of the state of Minas Gerais, with no physical barriers that facilitated the displaced of cattle to similar geographical environment areas. In this region, the main zebu breeding centers are localized on the limits of the Midwest, where there is cheap land and perspectives for the expansion of zebu breeds, particularly the Nelore breed. The migration in cattle production was different from the migration in sheep production in Brazil during the same period [13], which followed a steady Northeastern route but has stabilized in recent years. This reflects the differences in production aims and market opportunities in the two production chains.
It is estimated that there is a decrease in beef cattle productivity due to the increase in air temperature and vulnerability of pasture capacity in the cerrado (savannah) Midwest, north and northeast regions of Brazil [14]. This may explain some of the results found in the present study. The increase in cattle production and expansion of pastures for cattle ranching in the North is accompanied by deforestation [15]. Recently, soy production has also moved into the Amazonian forest [16]. This occurred despite allegations of a widespread marketplace transition within the beef and soy industries, the main drivers of deforestation, to exclude Amazon deforesters from their supply chains [17]. Nevertheless, the expansion through the incorporation of forest areas, particularly in the northern regions, meets with barriers that did not occur in the past. Questions related to the new Brazilian Forest code, the lack of logistics (slaughterhouses, roads) for a more intensive production, as well as the difficulty in obtaining credit for investments in the region, caused serious restrictions for the accelerated migration of cattle to this region. This was reflected in a slow movement of cattle production into new regions (Figs 2 and 3) and the need to increase productivity. When examining the aptitude of the cattle herd for the region (beef and milk), 90% of the herd in the north and Midwest was for beef production. With better lands and climatic conditions in the south and southwest, milk production systems can account for up to 30% of all cattle production systems [18]. On the other hand, although do not occur growth in the North region, with the current flock and the structure of agro-industrial complex linked to the beef chain, there will be a demand for increased production in the livestock sector, which can be achieved by increasing productivity. It is noteworthy that this region weaning rate and head for productivity are 43 and 37% lower than the average of the Midwest, respectively.
Production does not mean competitiveness, and studies have shown a lack of competitiveness within Brazilian beef production [19, 20]. The total productivity factor show that technological growth in the agribusiness sector in Brazil was 4.5% per year, particularly in the southern region [21]. Nevertheless, productivity grew by only 2.6%. Thus, there was a gap between technological innovation and productivity. Restrictions to growth are due to the lack of credit, public policies directed to education, infrastructure and logistics. This may explain the deceleration in cattle production in regions that have problems with slaughterhouse logistics, such as transport and production flow, but may also be due to an increased productivity in the region, the production systems in the Amazon region still present low technology use [22].
However, it must be considered that the Brazilian cattle industry still has its production base in volume and scale in the Midwest and northern regions, as the price of land and the conditions of the biome limit more rapid expansion of agricultural crops. However, with the technological improvements in the agricultural sector and soils that are currently of limited use for farming should, in the future, present economic viability and expel livestock to new frontiers or would change the existing production systems for a more intensive processes by the semi-confinement and confinement systems which may maintain the current herd situation. This explains the movement of the cattle herd to the northern states of Brazil, as the land that had been previously occupied by livestock now produces soybeans and corn. Thus, production systems previously based on the complete cycle now lack conditions for fattening cattle, due to limitations of the pasture, a reduction in available physical space and logistics for the new region. However, this can affect the price of land for cattle ranching in Brazil, which increases in the same proportion as lands for agriculture.
The pro-intensification policies such as credit provision for recover degraded pastures and improved pasture management and investment in more intensive production systems must be accompanied by an implementation and enforcement of such policies [3]. These should alter the incentives to clear forest for pasture, discourage land speculation, and increase the accountability for land management practices if intensification of the cattle sector is to avoid new deforestation and displace production from low-yield, extensive cattle production systems in frontier regions of the Brazilian Amazon [1,23, 24].
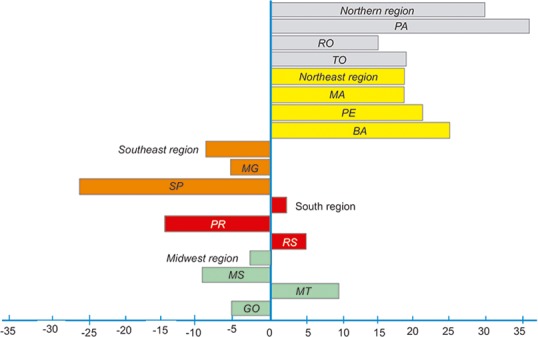
Further analysis showed that during the period of greatest participation of Brazil in the international beef market and the valorization of agricultural produce (2005–2012), there was a relative commodity growth of 6%. However, this growth was higher in regions where land prices were lower (North and Northeast) (Fig 8). In these regions, there was an incentive to rear beef cattle, particularly for the installation of large meat processors and the implementation of large projects producing meat for export. However, due to environmental issues and port logistics and infrastructure, these regions failed to facilitate the sale of meat abroad. As an economic alternative, the state of Pará, the main producing state of these two regions, redirected its strategy for the export of live animals to countries such as Venezuela and Arab nations. Scenario studies have showed that Pará, 4th Brazilian herd, would have a low growth over the next 10 years, resulting in a stagnation of the regional herd. On the other hand, would improve productivity, especially in fattening due to adequacy of ranchers environmental legislation that enables the properties to provide animals for slaughter. Regardless of the slowing growth and significant reduction in herd numbers, the states of São Paulo, Goiás, Minas Gerais, Mato Grosso do Sul and Mato Grosso still represent the majority of beef exports in Brazil. These states are where the main structure for export of slaughtered animals is located, and they are also the main centers for completing feed-lots, which explains the fact that even with a reduction of the herd, they remain the leading exporters of meat.
Fig 8. Variation in the rate of growth (%) of the cattle herd from 2005–2012 by region in Brazil and their main states (PA-Para, RO-Roraima, TO-Tocantins, MA-Maranhão, PE-Pernambuco, BA-Bahia, MG-Minas Gerais, SP-São Paulo, PR-Parana, RS-Rio Grande do Sul, MS-Mato Grosso, MT-Mato Grosso, and GO-Goiás.
Moving beef cattle production from one region to another requires skills and expertise as it passes through a redefinition of farming objectives, as well as strategies and processes to achieve better results. Nevertheless, there is always a risk that it will not work. Thus, there is a need to know the main vectors that will be employed in this migration. They may relate to the technological or organizational aspects of the main processes involved in the production cycle. This demonstrates that the change in land use for livestock immediately repositions other agricultural activities. In these areas, the farmer either sells land or remains with a reduction in herd size or may enhance productivity. Moreover, the emergence of integrated production systems called Crop-Livestock Integration and Crop-Livestock-Forest Integration can create new conditions for ranchers to avoid the migratory cycles for livestock production. These systems are based on sharing and maximizing the use of resources and the synergism between them, ensuring environmental balance and reducing trading risks by diversifying farm activities model. In addition, there might be a stabilization of farmers in their regions to acquire efficiency and sustainability.
Conclusions
The acceleration of the cattle herd growth in Brazil has been increasing from 1977 to 2011. Thus, agricultural productivity must keep pushing cattle ranching to occupy new frontiers. However, the opening of new areas for livestock requires infrastructure, logistics, availability of credit/loans, public policies and adaptation to environmental issues that practically restrict this migratory phenomenon. These results confirm the reduction forecast in livestock productivity in the Cerrado, Midwest, North and Northeast due to the increase in air temperature and vulnerability of pastures.
Thus, it is clear that the expansion of the Brazilian herd is through migration, and if it finds no geoeconomical support, it should stabilize or even undergo a slight decrease as shown by the relative stagnation of this migration in recent years (Fig 1). In addition, there are possibilities of productivity gains in the beef cattle sector because there are still regions with low efficiency indicators. Therefore, the beef chain will be conducted by the market obligations. Thus, future studies should incorporate variables related to the expansion of crops, income from plant products, average area of farms, different specializations in cow-calf, growth and completion of production systems and density of cattle in different regions of Brazil.
Data Availability
The data used are available from the Instituto Brasileiro de Geografia e Estatística (http://www.ibge.gov.br/home/estatistica/economia/ppm/2011/default_pdf.shtm).
Funding Statement
These authors have no support or funding to report.
References
- 1.McAlpine CA, Etter A, Fearnside PM, Seabrook L, Laurance WF. Increasing world consumption of beef as a driver of regional and global change: A call for policy action based on evidence from Queensland (Australia), Colombia and Brazil. Global Environ Chang. 2009; 19:21–33. [Google Scholar]
- 2.Barcellos JOJ, Canozzi MEA, McManus C, Oliveira TE, Oaigen RP, Canellas LC, et al. A reconfiguração dos sistemas de produção de bovinos de corte para a próxima década. Proceedings CD of the VIII Jornada NESPRO/ I Simpósio Internacional sobre Sistemas de Produção de Bovinos de Corte e Cadeia Produtiva; 24 a 26 de september de 2013; Porto Alegre, RS, Brasil.
- 3.Bowman MS, Soares-Filho BS, Merry FD, Nepstad DC, Rodrigues H, Almeida OT. Persistence of cattle ranching in the Brazilian Amazon: A spatial analysis of the rationale for beef production. Land Use Policy. 2012; 29:558–568. [Google Scholar]
- 4.Carvalho LFR, Melo CB, McManus C, Haddad JP. Use of satellite images for geographical localization of livestock holdings in Brazil. Prev Vet Med. 2012; 103:74–77. doi: 10.1016/j.prevetmed.2011.08.006 [DOI] [PubMed] [Google Scholar]
- 5.Hermuche P, Guimarães RF, Carvalho Júnior OA, Paiva SR, Gomes RAT, McManus CM. Environmental factors that affect sheep production in Brazil. Appl Geog. 2013; 44:172–181. [Google Scholar]
- 6.McManus C, Hermuche PM, Paiva SR, Melo CB, Mendes CQ. Geographical distribution of sheep breeds in Brazil and their relationship with climatic and environmental factors as risk classification for conservation. Braz J Sci Techn. 2014; 1:3. [Google Scholar]
- 7.IBGE—Brazilian Institute of Geography and Statistics. 2011. 2006, Agricultural Census. Available at: http://www.sidra.ibge.gov.br/bda/acervo/acervo2.asp?e=v&p=CA&z=t&o=11. Accessed 10 January 14.
- 8.Martha GB Jr, Alves E, Contini E. Land-saving approaches and beef production growth in Brazil. Agr Syst. 2012; 110:173–177. [Google Scholar]
- 9.MAPA, 2011. Ministério da Agricultura, Pecuária e Abastecimento. Agronegócio Brasileiro em números. Pecuária–evolução da produção 1960–2010. 2011. Available: http://www.agricultura.gov.br. Accessed 25 November 2014.
- 10.Barcellos JOJ, Queiroz Filho LA, Ceolin AC, Gianezini M, McManus C, Malafaia GC, et al. Technological innovation and entrepreneurship in animal production. Braz J Ani Sci. 2011; 40:189–200. [Google Scholar]
- 11.Sparovek G, Barretto A, Berndes G, Martins S, Maule R. Environmental, land-use and economic implications of Brazilian sugarcane expansion 1996–2006. Mitig Adapt Strat Gl. 2009; 14:285–298. [Google Scholar]
- 12.Ruviaro CF, Barcellos JOJ, Dewes H. Market-oriented cattle traceability in the Brazilian Legal Amazon. Land Use Policy. 2014; 38:104–110. [Google Scholar]
- 13.Hermuche PM, Maranhao RLA, Guimarães RF, Carvalho Júnior OA, Gomes RAT, Paiva SR, et al. Dynamics of Sheep Production in Brazil. ISPRS Int J Geo Inf. 2013; 2:665–679. [Google Scholar]
- 14.Naas IA, Romanini CEB, Salgado DA, Lima KAO, Vale MM, Labigalini MR, et al. Impact of global warming on beef cattle production cost in Brazil. Sci Agric. 2010; 67. [Google Scholar]
- 15.Walker R, Browder J, Arima E, Simmons E, Pereira R, Caldas M, et al. Ranching and the new global range: Amazônia in the 21st century. Geoforum. 2009; 40:732–745. [Google Scholar]
- 16.Walker R, Defries R, Vera-Diaz C, Shimabukuro Y, Venturieri A. The expansion of intensive agriculture and ranching in Brazilian Amazonia In: Keller M, Gash JCH, Dias PS [eds.]. Amazonia and Global Change. American Geophysical Union, Washington: 2009; p. 61–81. [Google Scholar]
- 17.Nepstad D, Soares-Filho BS, Merry F, Lima A, Moutinho P, Carter J, et al. The End of Deforestation in the Brazilian. Policy Forum. Science. 2009; 326:1350–1351. doi: 10.1126/science.1182108 [DOI] [PubMed] [Google Scholar]
- 18.ANUALPEC. 2013. Anuário da Pecuária Brasileira, 2013. São Paulo, SP, BR: Instituto FNP Informe Economics, South America. 360 p.
- 19.Procópio DP, Coronel DA, Lírio VS. Competitividade do Mercado Internacional de Carne Bovina: uma análise dos mercados Brasileiro e Australiano. Rev Pol Agric. 2011; 20:40–51. [Google Scholar]
- 20.Marques PR, Barcellos JOJ, McManus C, Oaigen RP, Collares FC, Canozzi MEA, et al. Competitiveness of beef farming in Rio Grande do Sul State, Brazil. Agr Syst. 2011; 104:689–693. [Google Scholar]
- 21.Rada NE, Buccola ST. Agricultural policy and productivity: evidence from Brazilian censuses. Agric Econ. 2012; 43:353–356. [Google Scholar]
- 22.Valentim JF, Andrade CMS. Tendências e perspectivas da pecuária bovina na Amazônia Brasileira, Amazônia: ci & desenv. 2009; 4:9–32. [Google Scholar]
- 23.Rada NE. Assessing Brazil’s Cerrado agricultural miracle. Food Policy. 2013; 38:146–155. [Google Scholar]
- 24.De Arruda ZJ, Sugai Y. Regionalização da pecuária bovina no Brasil. Embrapa, Cnpgc/spi. Edição 58. Documentos Centro Nacional de Pesquisa de Gado de Corte, Brasil. 1994. 144 p.
Associated Data
This section collects any data citations, data availability statements, or supplementary materials included in this article.
Data Availability Statement
The data used are available from the Instituto Brasileiro de Geografia e Estatística (http://www.ibge.gov.br/home/estatistica/economia/ppm/2011/default_pdf.shtm).


