Abstract
Atomic force microscopy (AFM) and other forms of scanning probe microscopy have been successfully used to assess biomechanical and bioelectrical characteristics of individual cells. When extending such approaches to heterogeneous tissue, there exists the added challenge of traversing the tissue while directing the probe to the exact location of the targeted biological components under study. Such maneuvers are extremely challenging owing to the relatively small field of view, limited availability of reliable visual cues, and lack of context. In this study we designed a system that leverages the visual topology of the serial tissue sections of interest to help guide robotic control of the AFM stage to provide the requisite navigational support. The process begins by mapping the whole-slide image of a stained specimen with a well-matched, consecutive section of unstained section of tissue in a piecewise fashion. The morphological characteristics and localization of any biomarkers in the stained section can be used to position the AFM probe in the unstained tissue at regions of interest where the AFM measurements are acquired. This general approach can be utilized in various forms of microscopy for navigation assistance in tissue specimens.
Keywords: atomic force microscopy, robotic microscopy, whole-slide imaging, virtual microscopy, serial sections registration
Introduction
The microscopic evaluation of complex, heterogeneous tissue samples often relies on histological-, immuno-, and counter-stains to facilitate visualization and discrimination among individual tissues and cells. Immunohistochemistry techniques utilize counterstains to help investigators distinguish nonspecific staining from the localization of antigen(s) in targeted structures and regions throughout the specimen. Application of multi-color immunofluorescence and confocal microscopy protocols also exploit the use of agents to highlight specific structures such as cell nuclei (Wu et al., 2003). Unfortunately, for some applications, incorporating additional chromogens or fluorophores during the preparation process may require elaborate solutions to be effective (Murayama et al., 1993). In other instances, such incorporation may be impractical or impossible to achieve adequate visualization. A prime example in this issue emerges when performing tissue characterization using atomic force microscopy (AFM).
There has been significant interest in quantitatively characterizing mechanical or electrical properties of cells and tissues. Contact-mode AFM, wherein a measure of the specimen elasticity is obtained by performing raster indentation on the specimen using a micro-cantilever probe, has been previously used to obtain mechanical signatures of biomaterials across a range of length scales (Binnig et al., 1986; Moreno-Flores & Toca-Herrera, 2012). AFM has previously been used in in vitro studies to assess cancer cell lines and their mechanical responses to environmental changes (Lal & John, 1994; Darling et al., 2007; Wang et al., 2009). Since 1990s, the AFM has been used to image living cells and to characterize their underlying microstructure, e.g., cytoskeletons (Lal & John, 1994; Alessandrini & Facci, 2005). Li et al. (2008) observed significant reduction in Young’s modulus between malignant breast cell line MCF7 and nonmalignant cells. Darling et al. (2007) reported the study of change in moduli after plating of cell lines, cell transformation and tumorigenicity were potentially associated with a decrease in cell modulus. In a previous study, our team systematically interrogated the mechanical properties of formalin-fixed and paraffin-embedded (FFPE) breast tissue specimens through contact-mode AFM (Roy et al., 2010b). The results of those studies indicated that cancerous epithelial breast tissue specimens exhibited lower elasticity compared with benign samples, which was in accordance to the results obtained from tumor regions on needle biopsy specimens by Plodinec et al. (2012). Recent investigations conducted by our group using piezoresistive measurements yielded similar observations (Pandya et al., 2014, 2015).
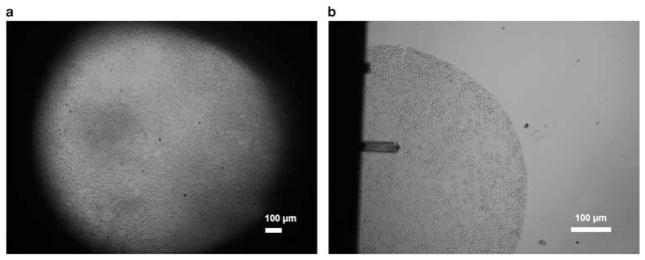
During the course of our team’s experiments, we specifically avoided the use of immuno- and histological stains out of concern that such processes could potentially interfere with the accuracy of AFM measurements. Our preliminary exploration showed that unstained tissue specimens, when examined under the AFM microscope as shown in Figure 1, present minimal optical intensity differences between back-ground and tissue, and offer only a very limited number of visual cues for distinguishing among different tissue components. As a result, it was exceedingly difficult to register the region of interest (ROI) with the AFM probe using the AFM microscope on banked tissue specimens, which often sized at 1–2 cm. To address this challenge, we utilized tissue microarray (TMA) technology. By virtue of the size of the individual tissue discs composing the array, we could reduce the problem from one in which the AFM probe would need to be accurately positioned on a whole histological section to one in which sampling could be limited to circular regions of about 0.6 mm in diameter (Roy et al., 2010a, 2010b). It was observed that 0.6 mm TMA sections provided adequate representation of the underlying tissue architecture for AFM-based biomechanical characterization, whereas simultaneously ensuring that the boundaries of tissue discs were visible under a 4 or 10× view, thus allowing “coarse” placement of the AFM probe by combining the limited visual information with the relative location within the disc. The AFM scanning was subsequently carried out through image-feedback-based “precise” positioning of the probe (Roy et al., 2013; Roy, 2014; Roy & Desai, 2014). Nevertheless, this TMA-based approach has its limitation in experimental design, and requires significant operator training and expertise while navigating about the specimens.
Figure 1.
Unstained tissue imaged with atomic force microscope (AFM). a: 4 × view (without probe) of a tissue section, showing the limited field of view presented by hardware configuration of the AFM. b: 10 × view of a 0.6 mm tissue microarray disc with AFM probe.
We propose that an unstained whole histological section can be successfully studied by employing navigational assistance provided by registering the slide with whole-slide images of stained adjacent sections. Investigators have previously explored methods for performing registration or alignment of two or more serial sections of tissue for the purpose of generating three-dimensional (3D) reconstruction of microscopic images (Braumann et al., 2005). The increased availability and adoption of whole-slide scanning technology have enabled investigators to quickly and reliably acquire high-resolution scans of entire tissue specimens, to manipulate the resulting image data sets, which typically contained many billions of pixels, and to align them into desirable views of interest. More recently, successful 3D reconstruction strategies have been developed to allow co-registration of multiple, serial whole-slide images that have been prepared with the same histological- or immune-staining protocol (Moses et al., 1995; Roberts et al., 2012; Song et al., 2013).
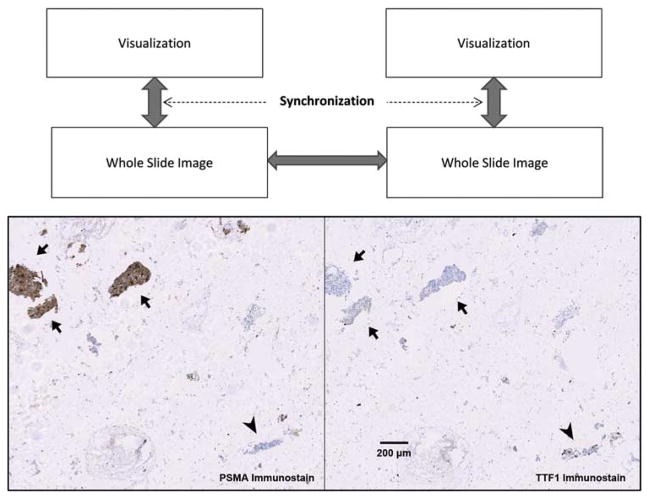
A relatively new area of investigation focuses on co-registering serial tissue sections that have been stained using different protocols to simultaneously reveal multiple characteristics (Borovec et al., 2013). With the advent of TMA technology such methods can be applied systematically to allow investigators to generate protein and/or molecular expression profiles on large patient cohorts (Kallioniemi et al., 2001; Maitra et al., 2003). Performing multi-modal image registration of these tissue sections in an unsupervised, automatic fashion can be an extremely challenging task (Kuska et al., 2006; Lippolis et al., 2013). In practice, clinicians and investigators utilize manual and semi-automatic methods to correlate and visualize consecutive tissue sections (Apostolopoulos et al., 1996). A clinically relevant example is shown in Figure 2 in which the collective information from two organ-specific protein markers established diagnosis of a metastasized cancer. There are two main requirements for successfully performing these operations and allowing clinicians or researchers to appreciate the results: (1) two or more whole-slide images can be independently rotated, scaled, and translated to bring into aligned position, and (2) images can be synchronized in the process of zooming and panning, thereby allowing the user to dynamically observe the results. Also included in Figure 2 is a conceptual diagram to show that the registration, i.e., generation and tracking of the global transformation, between two large whole-slide images allowed synchronized visualization of the specimens at any chosen scale, rotation, and translation.
Figure 2.
Aligning multiple whole-slide images. Above: a conceptual diagram showing that the registration, i.e., generation and tracking of the global transformation, between two large whole-slide images enables synchronized visualization of the specimens at any chosen scale, rotation, and translation. Arrows show transformations being tracked by software. Below: a clinically relevant example of aligning two immunostained serial sections of lung fine needle aspirate specimens showing differential diagnosis of a prostate adenocarcinoma metastasized to lung. Arrow heads indicate where nuclear positivity of thyroid transcription factor 1 (TTF1) characterized lung epithelial cells. Arrows indicate that cytoplasmic staining of prostate-specific membrane antigen (PSMA) as well as the absence of TTF1 staining revealed prostate originality of cancer cells.
Through recent advances that our team has made allowing fine control of the robotic stage (Roy et al., 2013; Roy & Desai, 2014) combined with the ability to reliably manipulate whole-slide images, we have developed a navigational system to dynamically co-register whole-slide images with discrete microscope views that have been acquired using AFM. These capabilities enable investigators to locate features of interest from within histological sections and obtain well-matched, elastic maps of the corresponding regions using AFM. The system provides remote navigational assistance by providing a streamlined and user-friendly semi-automated registration process. This design improves efficiency in AFM experiments, whereas significantly reducing the use of precious tissue resources and the labor to carry out these activities. Potential applications for these approaches and technologies include a range of fluorescent and other forms of scanning probe microscopy.
Materials and Methods
Tissue Selection and Preparation
Deidentified breast tumor specimens exhibiting multiple morphological features were selected from archival FFPE tissue blocks at the Biospecimen Resource Shared Services at Rutgers Cancer Institute of New Jersey (IRB Protocol 009601). After a board-certified pathologist evaluated the quality of the specimens, tissue blocks were sectioned serially at 4 μm thickness. Two sections (#1 and #2) were immunohistochemically stained with estrogen receptor and progesterone receptor antibody (not shown). Section #3 was double stained with transformation-related protein (P63) in brown [3,3′-diaminobenzidine (DAB)] and α-smooth muscle actin (SMA) in red (RedMap; Ventana Medical Systems). Section #5 was de-paraffinized, but not stained, and kept in phosphate-buffered saline at room temperature before AFM probing. Section #6 was stained with hematoxylin and eosin (H&E) and once again quality controlled by a pathologist.
Histological and Immunohistochemistry Stain
De-paraffinization and antigen retrieval were performed using Ventana Medical Systems Cell Conditioning Solution 950-124. Anti-P63 (790-4509, mouse monoclonal antibody; Ventana Medical Systems, Inc. A Member of the Roche Group, Tucson, AZ) was applied and the slides were incu-bated (37ºC for 1 h). Universal secondary antibody (760-4205; Ventana Medical Systems) was applied and the sample incubated for 12 min, followed by chromogenic detection kit DABMap (760-124; Ventana Medical Systems). After rinsing and relabeling the slide, anti-SMA antibody (760-2833, mouse monoclonal antibody; Ventana Medical Systems) was applied and slides were incubated (37ºC for 1 h). Universal secondary antibody was added and incubated for 12 min, followed by chromogenic detection kit RedMap (760-123). Slides were counterstained with hematoxylin, then dehy-drated, and cleared before coverslipping from xylene.
Whole-Slide Imaging and Virtual Microscopy
Stained specimens were imaged with Trestle® whole-slide scanner (Trestle Corp., Pittsburgh, PA) under 20 × objective. The image scale was 0.33 μm/pixel. The images were served from local hard drives as well as via a RESTful-based web service implemented on top of the open-source OpenSlide library (Goode et al., 2013).
Software Design
The primary advances reported in this work in relation to our previous studies lie in the capacity to explore larger specimens by leveraging the linear relationship between the AFM sample and adjacent sections. This mapping was primarily achieved by the software design that keeps track of all transformations among the mechanical and optical components of the AFM system and the digitized whole-slide images.
The system workflow was designed as follows: (1) control acquisition using the AFM microscope to collect disparate microscope frames on the unstained tissue specimen; (2) organize the optical images into a coherent coordinate system so that they can be viewed and manipulated in the same fashion as a whole-slide image; (3) co-register with reference whole-slide images and reposition the AFM microscope to reveal the desired sampling region, a process we consider a “coarse” localization; and (4) program the AFM microscope to automatically perform mechanical characterization at prescribed regions within the microscope view, which correspond to the same regions within the reference whole-slide images.
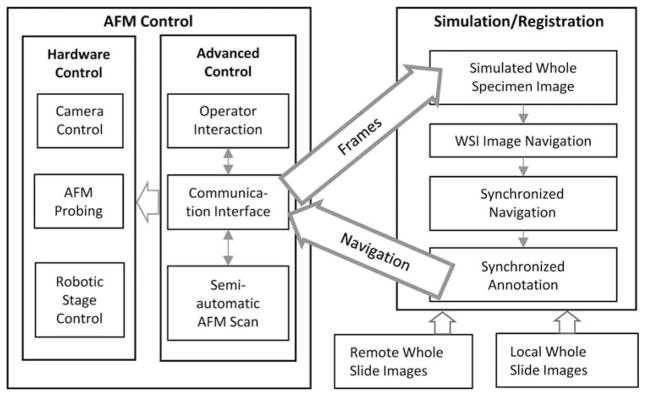
The system that we developed is composed of two networkable subsystems: the AFM control unit and the Simulation/Registration graphical interface (Fig. 3). The AFM control unit resides locally with the AFM and coordinates the hardware control components using the Advanced Control modules. It communicates with the graphical interface via the Communication Interface. Network sockets are used to exchange commands and images between the C++-based AFM control unit and the JAVA-based Simulation/Registration interface so that the user can participate in the process either locally or from a remote site.
Figure 3.
Software system architecture illustrating hierarchy of hardware and software components of the system and the relevant communications in between. AFM, atomic force microscopy; WSI, whole-slide imaging.
The communication protocols listed below support the passing of navigation instructions from the graphical interface to the AFM control unit, as well as retrieval of hardware configuration settings and optical images for the graphical interface:
Initialization: graphical interface initiates connection with AFM control unit and receives initialization parameters.
Single Frame: AFM control unit sends to graphical interface a triplet of information {objective, adjusted stage location, frame image}, which is sufficient for its addition to the simulated specimen image.
Batch Frame: graphical interface receives a series of frames designated by AFM operator.
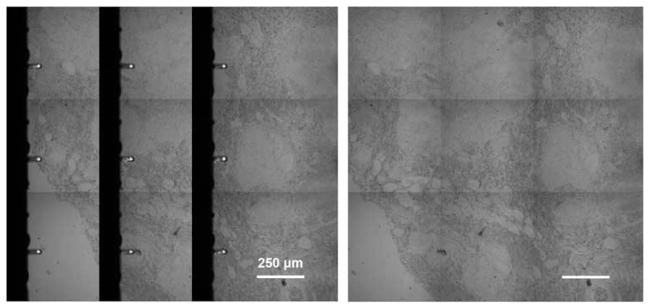
Frame Stitch: AFM control automatically acquires a 3 × 3 grid of frames in raster style, producing a slightly overlapping array of images that will be reconstructed on the graphical interface, with display option to remove artifacts created from the AFM probe (see Fig. 4).
Navigate: graphical interface directs AFM stage to make controlled movement to designated location.
AFM Scan: user designates an ROI, usually a square region sized between 30–80 μm, on the graphical interface, which is subsequently mapped to the AFM as the “probing ROI,” where elastic force curves are acquired at predefined spatial intervals.
Termination: to signal when two subsystems disconnect from each other.
Figure 4.
Frame stitch of specimen creating more visible space for registration. Left: reconstruction/stitching of scanned frame images. Right: software eliminates the artifacts created from the atomic force microscopic probe and creates a more useful display of the stitched frames.
The registration between the whole-slide image and adjacent section is achieved through semi-automated manipulation, including scaling, panning, and rotating either image, of the whole-slide images on the software interface.
The synchronized annotation feature is designed to aid the semi-automatic registration process by allowing users to draw annotations, including lines, rectangles, and contours, to guide the process. These annotations are simultaneously displayed on co-registered images, and synchronize with image movement. Alternatively, the annotations can be generated from thresholding the images by pixel intensity on all or any selected color channels.
Coordinate Systems and Transformations
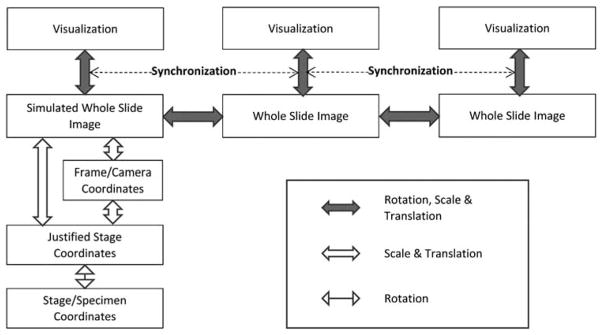
The linear transformations among specimen, the whole-slide images, and their visual displays are expressed and calibrated in a series of affine transformations in the system. For simplicity, coordinates are expressed in homogeneous coordinates as , hence scale S, , rotation, , and translation, , can all be treated as matrix products and easily concatenated in computation for transformation from coordinate system to coordinate system. The various coordinate systems used in the design and their transformations are illustrated in Figure 5 and described in this section. The calibration of various parameters is discussed in the following section “AFM.”
Figure 5.
Extending the scheme shown in Figure 2, the system maintains transformations among coordinate systems across various mechanical and optical components at software level in order to register the atomic force microscopic specimen with related whole-slide images.
Stage/Sample Coordinate System
We assume location of the specimen relative to the stage is fixed in the experiment; therefore, coordinates for a given point on the sample L0 are defined as the stage coordinate Ls when the point is aligned with center of the optical path, i.e., center of highest resolution frame image:
Adjusted Stage Coordinate
The customized robotic stage (see “AFM” section below) is physically disjointed from the optical system of the AFM microscope. Its placement during experiments always result in an, albeit small, rotation from its movement axes to axes of the camera. Therefore, as one of the pre-experimental steps we measure and compensate for this rotation Ra (see section “Rotation Calibration” below). The adjusted stage coordinate is defined as
Camera/Frame Coordinate System
When an image frame is captured at location L′, the pixels in the image can be mapped with underlying adjusted stage coordinate :
where . The scale of the frame coordinate system sf can be measured before the experiment.
When a microscope is equipped with multiple objectives and cameras, images captured under each combination of optical components will have different scale and very likely a par-center shift (translation), i.e., a different transformation in relation to the stage. Although there is only one such combination used in our current experimental setup, our previous work described the methods to achieve calibration among different microscope objectives (Chen & Foran, 2007).
Simulated Whole Specimen Image Coordinate
Only a finite range of the stage/specimen {x′, y′ | x′ε[ x′min, x′max), } is predesignated and simulated into the whole specimen image with
where .
AFM
AFM Experimental Setup
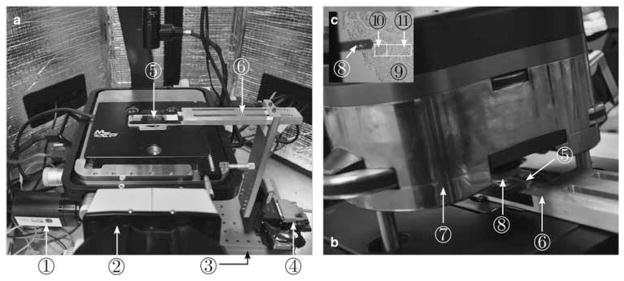
The AFM experimental setup, as shown in Figures 6a and 6b, consists of an AFM (MFP-3D-BIO™; Asylum Research, an Oxford Instruments Company, Santa Barbara, CA, USA) integrated with an inverted optical microscope (Nikon TE2000U; Nikon Instruments Inc., Melville, NY, USA) and fitted with a customized robotic stage driven by a stepper motor-controlled micromanipulator (MP-285; Sutter Instruments, Novato, CA, USA), which is placed on the vibration isolation table. Owing to the restricted range of AFM scanners (see Table 1 for examples), we used the micromanipulator, which has an X–Y travel range of 25.4 mm, large enough to perform raster indentations on a whole tissue specimen. The tissue slide was mounted on a custom-fabricated end-effector attached to the micromanipulator. The AFM optical micro-scope is equipped with a charge-coupled device camera (Model: Retiga 2000R; QImaging, Surrey, BC, Canada). Please refer to Roy et al. (2013) for further details on the AFM experimental setup.
Figure 6.
Atomic force microscopic (AFM) experimental setup. a, the glass slide with TMA placed on the XY-stage; b, the AFM head attached with AFM probe placed over the glass slide for tissue indentation; c, the magnified view of AFM probe aligned at the start point of the ROI in the tissue. Illustrated by circled numbers: (1) AFM charge-coupled device camera, (2) AFM inverted microscope, (3) vibration isolation table, (4) MP-285 micromanipulator, (5) tissue slide, (6) slide holder, (7) AFM head, (8) AFM probe, (9) tissue, (10) probing region of interest (ROI), and (11) tracking ROI.
Table 1.
Travel Range of Commercially Available Atomic Force Microscopic (AFM) Systems.
| Commercial AFM Manufacturers | X–Y Travel Range |
|---|---|
| Asylum Research | 90 μm (scanner) |
| JPK Nanowizard | 100 μm (scanner) with 20 mm (stage) |
| Nanosurf | 100 μm (scanner) with 12 mm (stage) |
| Bruker | 35 μm (scanner) |
| Keysight (Agilent Technologies) | 90 μm (scanner) |
| NT-MDT | 100 μm (scanner) with 20 mm (stage) |
| Nanonics | 30–160 μm |
| DME | 200 μm |
It should be noted that the specific hardware configuration of the AFM microscope utilized in these experiments was limited in terms of the overall image quality of the optical system. Field of view was restricted under low magnification and background illumination varied owing to location and height of the AFM probe (Fig. 1). Background subtraction could not be implemented as a result of the latter restriction.
Rotation Calibration
The placement of the micromanipulator on the vibration isolation table is manual, thus causing a rotational mis-alignment, α, between the micromanipulator coordinate frame and AFM camera pixel coordinates. This rotational misalignment is calibrated by computing image displacement after a slide is traversed along the X axis of the micromanipulator coordinate system using normalized cross-correlation (NCC)-based template matching tracking scheme. By applying the law of cosines to the image displacement and the manipulator displacement, this rotation angle can be determined.
Long-Range “Coarse” Localization
Guided by the reference whole-slide images, the software computes the precise distance that the specimen needed to be moved (on the order of millimeters) to bring a user-designated “probing ROI” (typically sized 80 × 80 μm) into the field of view. This movement was carried out using the micromanipulator position controller (Sutter Instruments, Inc.).
AFM Scanning Using Image-Feedback-Based Positioning
Although we relied on the position controller of the micro-manipulator to position the probing ROI within the field of view of the AFM, precise positioning is required before tissue probing to ensure that the elastic map of the scanned tissue region corresponds with the desired ROI. To insure against potential positioning inaccuracies arising owing to thermal drift and backlash in the micromanipulator controller, we use an additional visual serving-based control law to align the tissue align with the AFM probe before tissue probing. In this step, once the probing ROI was within the field of view of the AFM camera, a region adjacent to the probing ROI was designated as “tracking ROI,” which was used to provide image-feedback to align the AFM probe with spatial scanning points separated at 5 μm intervals inside the “probing ROI.” The NCC-based template matching technique was used for image-feedback, and a gradient-based control law was used for precise positioning. Using this approach, we could position the specimen with <1.6 μm error at 10 × magnification. The details of the tracking scheme and the control law is given in the studies by Roy (2014) and Roy et al. (2013).
Indentation Probing and Tissue Elasticity Modeling
After probe–tissue alignment, AFM force curves (Roy et al., 2010a) are acquired and subsequently processed to extract the elastic modulus at each probing point. Each force curve is processed offline and assigned to a definite pixel of a 2D topography image, where the pixel value corresponds to the elastic modulus of force curve acquired at the pixel location. This resulting image is typically called an “elastic map” (Haga et al., 2000) or a “force-volume” (Alessandrini & Facci, 2005).
The AFM probing experiments were carried out in the “force-controlled mode,” in which a constant probing force F was used to probe the specimens and the resulting indentation Δ was measured (Alessandrini & Facci, 2005) to quantify the tissue elasticity. For the same probing force, stiffer tissue regions produced a lower indentation compared with the softer tissue regions. A rectangular-shaped silicon probe (Novascan, Inc., Ames, IA, USA; spring constant = 0.426 N/m) with an attached glass bead micro-sphere (R = 10 μm) (Domke & Radmacher, 1998; Mahaffy et al., 2000) was used to indent the tissue specimens (see Fig. 7). Assuming incompressibility and linear elasticity in the tissue specimen, the force F and indentation Δ are related by the Dimitriadis contact model (Dimitriadis et al., 2002), which is an extension of the classical Hertzian contact model (Johnson, 1982) accounting for the specimen thickness, h, and is given as follows:
where γ = R/h2 and E is the elastic modulus. Note that for the case of h → ∞ (infinite tissue thickness), the Dimitriadis model approaches the classical Hertz contact model.
Figure 7.
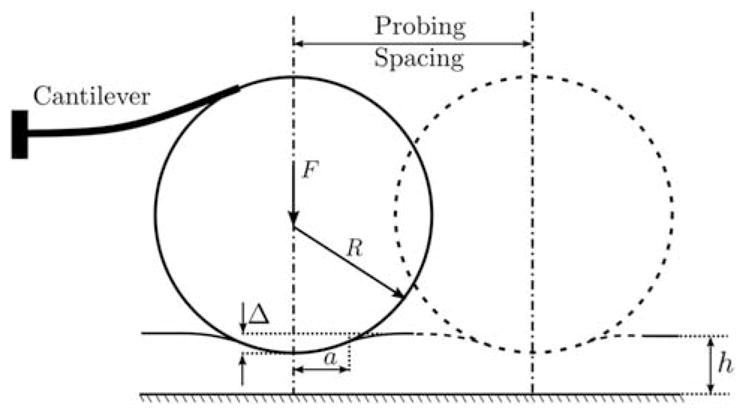
Schematic of atomic force microscopic probing on tissue.
The tissue elastic response is averaged locally over the contact area defined by the contact radius given as follows (Dimitriadis et al., 2002):
Results and Discussion
As a proof-of-concept experiment, breast cancer specimens exhibiting the presence of invasive ductal carcinoma, stromal desmoplastic change, necrosis, as well as normal breast lobules (example as shown in Fig. 8) were prepared. The objective of these studies was to demonstrate the process of co-registering the unstained AFM specimen with the whole-slide images of serial sections that had been stained for regular morphology (H&E) and biomarkers. The primary aim of the co-registration process was to guide AFM sampling into specific regions based upon the morphology and biomarker localization.
Figure 8.
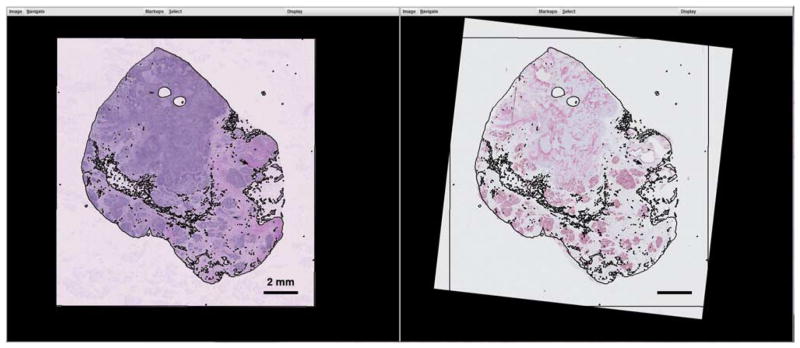
Registration of the whole-slide images of hematoxylin and eosin (H&E) (left) and P63/smooth muscle actin (SMA) (right) by overlaying threshold outlines from the H&E specimen to the P63/SMA specimen.
In this example, the biomarkers used were myoepithelial markers P63 and SMA, both of which stain myoepithelial cells that constitute the outer layer of normal glandular structure of breast (Barbareschi et al., 2001; Batistatou et al., 2003; Pavlakis et al., 2006). In cancer tissue, however, the SMA staining pattern changes. Diffuse stromal staining of SMA indicates myofibroblast proliferation, which not only mediates desmoplastic response but also correlates to poor prognosis (Tomas & Krušlin, 2004; Tsujino et al., 2007).
As the first step of the experiment, the AFM system was initiated and Ra was calibrated. Empirical sf was measured as 1.033 pixel/μm. Stage origin was designated inside the specimen with predesignated range of x′and y′ large enough to cover the specimen.
Registering Whole-Slide Images
On the client side, the H&E and P63/SMA whole-slide images were opened in the Simulation/Registration graphical interface. At an overview scale, the H&E image was thresholded and the edge map was synchronously overlaid onto the biomarker image in color to allow manual manipulation to bring the tissue slices into alignment (Fig. 8). When the two image frames were designated as synchronized, their relative transformation was kept constant by the software to allow simultaneous movement of the views.
Registering AFM Specimen With Whole-Slide Images
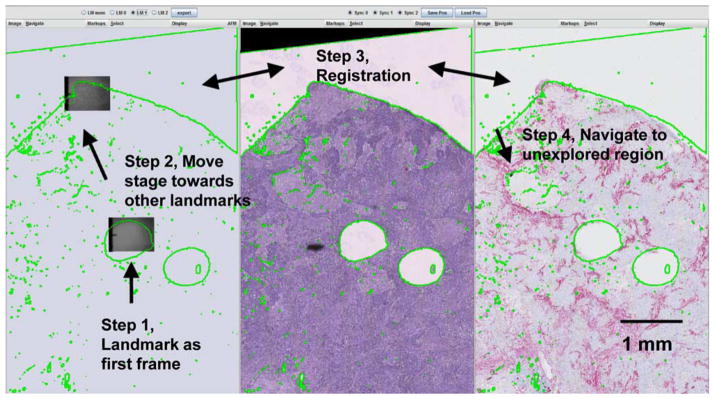
Our team found it more efficient to begin the experiment at visible landmarks in the unstained specimen. In this demonstration a hole left by previous TMA extraction was designated as the starting point. After the connection between client and AFM control unit was established, with known scaling between the specimens and the overlaid specimen boundary, the user directed the stage toward the general direction of other landmarks (e.g., tissue boundary) and manually registered with these frames. This process and the resulting registered frames are illustrated in Figure 9. The aligned images subsequently directed navigation to sample an unexplored region with the AFM system.
Figure 9.
An example procedure of registering panels of images based on known landmarks of the specimen. Left: simulated specimen on atomic force microscope. Middle: hematoxylin and eosin image. Right: P63/smooth muscle actin double stain.
Biomarker-Oriented AFM Sampling
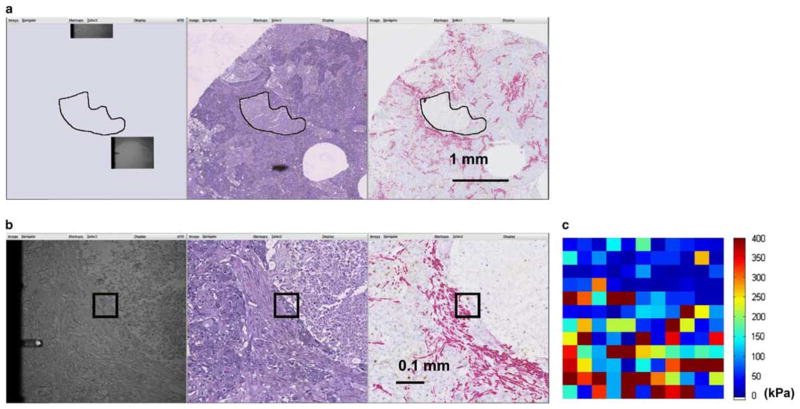
An example of biomarker-oriented sampling is illustrated in Figure 10. First, the necrotic region was hand annotated on the H&E image (Fig. 10a) and used for directing the AFM stage to navigate to a corresponding area on the unstained specimen where it had not been previously. The calculated movement was then sent to the AFM stage to reveal the targeted region. Subsequently, the client side displayed synchronized side-by-side views in full resolution (Fig. 10b) in order to designate an 80 × 80 pixel AFM scan region (shown as black square) according to the red SMA signal (Fig. 10b, right panel), indicating desmoplastic change in tumor stroma. Finally, with image-based tracking, the AFM probe systematically traversed the specimen and took measurements.
Figure 10.
Example procedure of sampling a morphologically interesting feature. a: Overlaying a hand-drawn necrotic region to simulated atomic force microscopic (AFM) specimen to guide navigation of the AFM microscope to general location of the interested feature. b: Smooth muscle actin signal on the right panel guided the selection of the region-of-interest, which was illustrated in black on all panels. c: Two-dimensional elastic modulus map of the scan region showing the distinction of elastic features between soft necrotic tissue and rigid desmoplastic region, although the epithelial region in between is not as prominent. The color at each sampling point indicates the elastic modulus computed from the AFM curve at the location.
For the AFM probing experiments, a constant probing force of F = 35 nN was used, producing tissue indentations varying from Δ = 6 nm to Δ = 884 nm. The elastic modulus was computed using the Dimitradis contact model as described in the Materials and Methods section. The resulting 2D elastic map can be seen to echo the tissue structure with a soft necrotic region on the upper-right corner with firm desmoplastic stroma on the bottom. In this particular ROI, please note that a thin layer of epithelial cells was sandwiched between the necrotic region and desmoplastic stroma; its elastic feature was not prominent against this context.
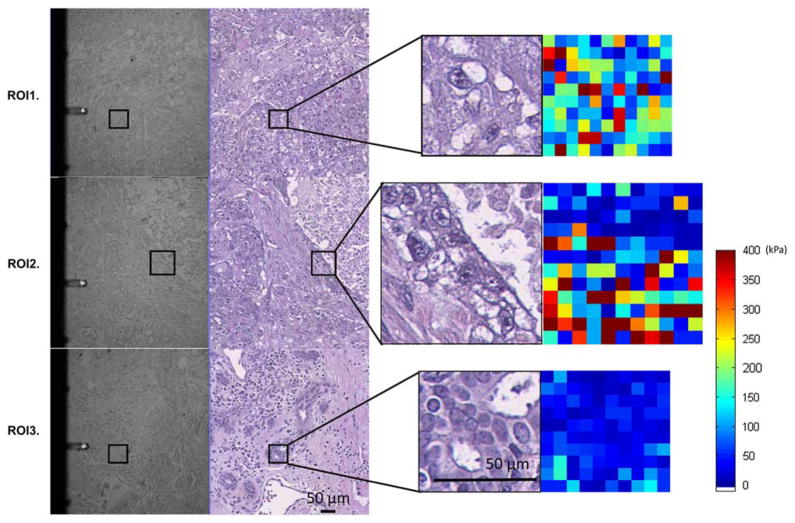
Three disparate ROIs sampled from the specimen are shown in Figure 11. As illustrated, we were able to locate, co-register, and sample some regions that would not have been typical choices of punching sites in the context of constructing a cancer versus normal TMA. In this explorative study, we found glands in the vicinity of the tumor that had normal microscopic structure as pliable as tumor regions, signaling possible structural change in these glands even before visible morphological disturbance.
Figure 11.
Example of region of interests (ROIs) examined. ROI1: tumor region that displayed a mixture of elastic signals. ROI2: (also shown in Fig. 10), component intersection between necrosis, epithelium, and desmoplastic stroma. ROI3: breast tissue with normal glandular structure located at tumor vicinity. The pairs of panels shown on the left are atomic force microscopic (AFM) image with registered hematoxylin and eosin-stained serial section. The pairs on the right show enlarged ROI with the AFM elastic maps.
In the earliest stages of our experiments, TMA technology was used to enable us to systematically probe tissue components and investigate the feasibility of using AFM without sacrificing large amounts of archived tissues. With time, however, the limitations of this experiment design and tissue preservation gradually became apparent. The ability to explore whole histologic sections and crosslinking bio-mechanical quality with morphological and immunohistochemical signatures will allow investigators to observe and explore the plethora of changes that occur in and around diseased tissue, without hindrances that may originate from above limitations of subsampling technology.
Serial sections of tissue have great resemblance from layer to layer, yet their relationship cannot be fully captured as rigid transformation as modeled in this work. Microscopic structures, as being sectioned from their 3D form, display changes in size and shape even within the 4–20 μm spatial sections, and, furthermore, each tissue slice may be subject to individual deformations resulting from specimen expansion or uneven mechanical force during sectioning or transferring of the tissue onto the glass slides (Cooper et al., 2009). We have found overlaying thresholded or hand-drawn boundaries to be very helpful and effective in aligning the specimens. Accuracy of the navigation depended on many factors such as quality of the registering frames, mechanical distortion of the tissue sections, and distance of target ROI to registering frames. Nevertheless, the semi-automatic navigation always brought the AFM within microscopic view of the target tissue compartment. Furthermore, the software allows users to unsynchronize and re-synchronize each specimen window, thereby allowing small adjustments during the experiment. Automatic or semi-automatic, multi-scale methods to help register these multi-modal images are being explored for this project.
Conclusion
Navigational assistance to the positioning of the probe is of great importance in our exploration of AFM characterization of tissue. Achieving this goal presented a great challenge because of the poor visual cues exhibited by the unstained specimens under study. By simulating a whole specimen image in a piecewise fashion, while leveraging morphological and immunohistochemical information on whole-slide scans of adjacent sections, we were able to navigate tissue samples many times the size of TMA cores, which were used in previous experimental designs. We demonstrated this accomplishment by targeting and sampling small ROIs with interesting features within a morphologically complex sample of breast tissue specimens. These implementations enabled us to expand our exploration of elastic features on whole histologic sections of tissue fixed on glass slides.
The methods that we have developed are suitable for AFM and, with slight modifications, can be used in similar microscopic situations when navigation is important, but cannot be achieved through standard visual inspection and evaluation of the same specimen. As the system leveraged the OpenSlide whole-slide image reading library, it is fully compatible with many commercially available whole-slide imaging systems from manufacturers such as Leica (Leica Microsystems, Inc., Buffalo Grove, IL, USA), Hammamatsu (Hamamatsu Photonics K.K., Shizuoka Prefecture, Japan), and 3D Histech (3D Histech Kft., Budapest, Hungary). Besides exploring semi-automatic registration methods to further facilitate the experimental process, future work to this study includes continuing to explore and harvest elastic characteristics at specific regions in and around the tumor, and augment them with morphological and biochemical information in order to piece together a better picture of various changes that occur during the process of tumor development. The advancements achieved in this study will also enable us to extend the research to examine fresh tissue specimens, including cryosectioned samples, in the future.
Acknowledgments
Research reported in this publication was supported by the National Cancer Institute of the National Institutes of Health under Awards Number 5R01CA161375, 5R01CA156386-10, as well as 5R01LM009239-06 from the National Library of Medicine. The content is solely the responsibility of the authors and does not necessarily represent the official views of the National Institutes of Health. The authors also acknowledge the Biospecimen Repository Service and Histopathology and Imaging Shared Resources at Rutgers Cancer Institute of New Jersey (P30CA072720) for tissue access and preparation.
References
- Alessandrini A, Facci P. AFM: A versatile tool in biophysics. Meas Sci Technol. 2005;16(6):R65–R92. [Google Scholar]
- Apostolopoulos J, Davenport P, Tipping PG. Interleukin-8 production by macrophages from atheromatous plaques. Arterioscler Thromb Vasc Biol. 1996;16(8):1007–1012. doi: 10.1161/01.atv.16.8.1007. [DOI] [PubMed] [Google Scholar]
- Barbareschi M, Pecciarini L, Cangi MG, Macri E, Rizzo A, Viale G, Doglioni C. p63, a p53 homologue, is a selective nuclear marker of myoepithelial cells of the human breast. Am J Surg Pathol. 2001;25(8):1054–1060. doi: 10.1097/00000478-200108000-00010. [DOI] [PubMed] [Google Scholar]
- Batistatou A, Stefanou D, Arkoumani E, Agnantis NJ. The usefulness of p63 as a marker of breast myoepithelial cells. In Vivo. 2003;17(6):573–576. [PubMed] [Google Scholar]
- Binnig G, Quate CF, Gerber C. Atomic force microscope. Phys Rev Lett. 1986;56(9):930–934. doi: 10.1103/PhysRevLett.56.930. [DOI] [PubMed] [Google Scholar]
- Borovec J, Kybic J, Busta M, Ortiz-de-Solórzano C, Munoz-Barrutia A. Registration of multiple stained histological sections. 2013 IEEE 10th International Symposium on Biomedical Imaging (ISBI); IEEE, San Francisco, CA, USA. April 7–11, 2013; 2013. pp. 1034–1037. [Google Scholar]
- Braumann UD, Kuska JP, Einenkel J, Horn LC, Loffler M, Hockel M. Three-dimensional reconstruction and quantification of cervical carcinoma invasion fronts from histological serial sections. IEEE Trans Med Imaging. 2005;24(10):1286–1307. doi: 10.1109/42.929614. [DOI] [PubMed] [Google Scholar]
- Chen W, Foran DJ. A computer-assisted microscopy system for automated image analysis of pathology specimens and tissue microarrays. In: Wu Hai-Shan, Einstein Andrew J., editors. Image Analysis in Medical Microscopy and Pathology. New York, NY: Research Signpost; 2007. pp. 123–152. [Google Scholar]
- Cooper L, Sertel O, Kong J, Lozanski G, Huang K, Gurcan M. Feature-based registration of histopathology images with different stains: An application for computerized follicular lymphoma prognosis. Comput Methods Programs Biomed. 2009;96(3):182–192. doi: 10.1016/j.cmpb.2009.04.012. [DOI] [PMC free article] [PubMed] [Google Scholar]
- Darling EM, Zauscher S, Block JA, Guilak F. A thin-layer model for viscoelastic, stress-relaxation testing of cells using atomic force microscopy: Do cell properties reflect metastatic potential? Biophys J. 2007;92(5):1784–1791. doi: 10.1529/biophysj.106.083097. [DOI] [PMC free article] [PubMed] [Google Scholar]
- Dimitriadis EK, Horkay F, Maresca J, Kachar B, Chadwick RS. Determination of elastic moduli of thin layers of soft material using the atomic force microscope. Biophys J. 2002;82(5):2798–2810. doi: 10.1016/S0006-3495(02)75620-8. [DOI] [PMC free article] [PubMed] [Google Scholar]
- Domke J, Radmacher M. Measuring the elastic properties of thin polymer films with the atomic force microscope. Langmuir. 1998;14(12):3320–3325. [Google Scholar]
- Goode A, Gilbert B, Harkes J, Jukic D, Satyanarayanan M. OpenSlide: A vendor-neutral software foundation for digital pathology. J Pathol Inform. 2013;4:27. doi: 10.4103/2153-3539.119005. [DOI] [PMC free article] [PubMed] [Google Scholar]
- Haga H, Sasaki S, Kawabata K, Ito E, Ushiki T, Sambongi T. Elasticity mapping of living fibroblasts by AFM and immunofluorescence observation of the cytoskeleton. Ultramicroscopy. 2000;82(1–4):253–258. doi: 10.1016/s0304-3991(99)00157-6. [DOI] [PubMed] [Google Scholar]
- Johnson KL. One hundred years of hertz contact. Proc Inst Mech Eng [H] 1982;196:363–378. [Google Scholar]
- Kallioniemi OP, Wagner U, Kononen J, Sauter G. Tissue microarray technology for high-throughput molecular profiling of cancer. Hum Mol Genet. 2001;10(7):657–662. doi: 10.1093/hmg/10.7.657. [DOI] [PubMed] [Google Scholar]
- Kuska J-P, Braumann U-D, Scherf N, Loffler M, Einenkel J, Hockel M, Horn L-C, Wentzensen N, von Knebel Doeberitz M. Image registration of differently stained histological sections. 2006 IEEE International Conference on Image Processing; IEEE, Atlanta, GA, USA. October 8–11, 2006; 2006. pp. 333–336. [Google Scholar]
- Lal R, John SA. Biological applications of atomic force microscopy. Am J Physiol Cell Physiol. 1994;266(1):C1–C21. doi: 10.1152/ajpcell.1994.266.1.C1. [DOI] [PubMed] [Google Scholar]
- Li QS, Lee GYH, Ong CN, Lim CT. AFM indentation study of breast cancer cells. Biochem Biophys Res Commun. 2008;374:609–613. doi: 10.1016/j.bbrc.2008.07.078. [DOI] [PubMed] [Google Scholar]
- Lippolis G, Edsjö A, Helczynski L, Bjartell A, Overgaard NC. Automatic registration of multi-modal microscopy images for integrative analysis of prostate tissue sections. BMC Cancer. 2013;13(1):408. doi: 10.1186/1471-2407-13-408. [DOI] [PMC free article] [PubMed] [Google Scholar]
- Mahaffy R, Shih C, MacKintosh F, Käs J. Scanning probe-based frequency-dependent microrheology of polymer gels and biological cells. Phys Rev Lett. 2000;85(4):880–883. doi: 10.1103/PhysRevLett.85.880. [DOI] [PubMed] [Google Scholar]
- Maitra A, Adsay NV, Argani P, Iacobuzio-Donahue C, De Marzo A, Cameron JL, Yeo CJ, Hruban RH. Multicomponent analysis of the pancreatic adenocarcinoma progression model using a pancreatic intraepithelial neoplasia tissue microarray. Mod Pathol. 2003;16(9):902–912. doi: 10.1097/01.MP.0000086072.56290.FB. [DOI] [PubMed] [Google Scholar]
- Moreno-Flores S, Toca-Herrera JL. Hybridizing Surface Probe Microscopies: Toward a Full Description of the Meso-and Nanoworlds. Boca Raton, FL: CRC Press; 2012. [Google Scholar]
- Moses RL, Flint PW, Paik C, Zinreich SJ, Cummings CW. Three-dimensional reconstruction of the feline larynx with serial histologic sections. Laryngoscope. 1995;105(2):164–168. doi: 10.1288/00005537-199502000-00010. [DOI] [PubMed] [Google Scholar]
- Murayama K, Meeker RB, Murayama S, Greenwood RS. Developmental expression of vasopressin in the human hypothalamus: double-labeling with in situ hybridization and immunocytochemistry. Pediatric research. 1993;33(2):152–158. doi: 10.1203/00006450-199302000-00013. [DOI] [PubMed] [Google Scholar]
- Pandya HJ, Kim HT, Roy R, Chen W, Cong L, Zhong H, Foran DJ, Desai JP. Towards an automated MEMS-based characterization of benign and cancerous breast tissue using bioimpedance measurements. Sens Actuators B Chem. 2014;199:259–268. doi: 10.1016/j.snb.2014.03.065. [DOI] [PMC free article] [PubMed] [Google Scholar]
- Pandya HJ, Roy R, Chen W, Chekmareva MA, Foran DJ, Desai JP. Accurate characterization of benign and cancerous breast tissues: Aspecific patient studies using piezoresistive microcantilevers. Biosens Bioelectron. 2015;63:414–424. doi: 10.1016/j.bios.2014.08.002. [DOI] [PMC free article] [PubMed] [Google Scholar]
- Pavlakis K, Zoubouli C, Liakakos T, Messini I, Keramopoullos A, Athanassiadou S, Kafousi M, Stathopoulos E. Myoepithelial cell cocktail (p63 + SMA) for the evaluation of sclerosing breast lesions. Breast. 2006;15(6):705–712. doi: 10.1016/j.breast.2005.11.005. [DOI] [PubMed] [Google Scholar]
- Plodinec M, Loparic M, Monnier CA, Obermann EC, Zanetti-Dallenbach R, Oertle P, Hyotyla JT, Aebi U, Bentires-Alj M, Lim RY, Schoenenberger CA. The nanomechanical signature of breast cancer. Nat Nanotechnol. 2012;7(11):757–765. doi: 10.1038/nnano.2012.167. [DOI] [PubMed] [Google Scholar]
- Roberts N, Magee D, Song Y, Brabazon K, Shires M, Crellin D, Orsi NM, Quirke R, Quirke P, Treanor D. Toward routine use of 3D histopathology as a research tool. Am J Pathol. 2012;180(5):1835–1842. doi: 10.1016/j.ajpath.2012.01.033. [DOI] [PMC free article] [PubMed] [Google Scholar]
- Roy R. PhD Thesis. University of Maryland; College Park, MD: 2014. Mechanical characterization of normal and cancerous breast tissue specimens using atomic force microscopy. [Google Scholar]
- Roy R, Chen W, Cong L, Goodell LA, Foran DJ, Desai JP. A semi-automated positioning system for contact-mode atomic force microscopy (AFM) IEEE Trans Autom Sci Eng. 2013;10(2):462–465. doi: 10.1109/TASE.2012.2226154. [DOI] [PMC free article] [PubMed] [Google Scholar]
- Roy R, Chen W, Goodell LA, Hu J, Foran DJ, Desai JP. Microarray-facilitated mechanical characterization of breast tissue pathology samples using contact-mode atomic force microscopy (AFM). 2010 3rd IEEE RAS and EMBS International Conference on Biomedical Robotics and Biomechatronics (BioRob), IEEE; Tokyo, Japan. September 26–29, 2010; 2010a. pp. 710–715. [Google Scholar]
- Roy R, Chen W, Hu J, Goodell LA, Foran DJ, Desai JP. Tissue microarray facilitated mechanical characterization of cancerous breast tissue using atomic force microscopy. Arch Pathol Lab Med. 2010b;134:939. [Google Scholar]
- Roy R, Desai JP. Determination of mechanical properties of spatially heterogeneous breast tissue specimens using contact mode atomic force microscopy (AFM) Ann Biomed Eng. 2014;42(9):1806–1822. doi: 10.1007/s10439-014-1057-x. [DOI] [PMC free article] [PubMed] [Google Scholar]
- Song Y, Treanor D, Bulpitt AJ, Magee DR. 3D reconstruction of multiple stained histology images. J Pathol Inform. 2013;4(Suppl):7. doi: 10.4103/2153-3539.109864. [DOI] [PMC free article] [PubMed] [Google Scholar]
- Tomas D, Krušlin B. The potential value of (Myo) fibroblastic stromal reaction in the diagnosis of prostatic adenocarcinoma. Prostate. 2004;61(4):324–331. doi: 10.1002/pros.20109. [DOI] [PubMed] [Google Scholar]
- Tsujino T, Seshimo I, Yamamoto H, Ngan CY, Ezumi K, Takemasa I, Ikeda M, Sekimoto M, Matsuura N, Monden M. Stromal myofibroblasts predict disease recurrence for colorectal cancer. Clin Cancer Res. 2007;13(7):2082–2090. doi: 10.1158/1078-0432.CCR-06-2191. [DOI] [PubMed] [Google Scholar]
- Wang J, Wan Z, Liu W, Li L, Ren L, Wang X, Sun P, Ren L, Zhao H, Tu Q. Atomic force microscope study of tumor cell membranes following treatment with anti-cancer drugs. Biosens Bioelectron. 2009;25(4):721–727. doi: 10.1016/j.bios.2009.08.011. [DOI] [PubMed] [Google Scholar]
- Wu X, Liu H, Liu J, Haley KN, Treadway JA, Larson JP, Ge N, Peale F, Bruchez MP. Immunofluorescent labeling of cancer marker Her2 and other cellular targets with semiconductor quantum dots. Nat Biotechnol. 2003;21(1):41–46. doi: 10.1038/nbt764. [DOI] [PubMed] [Google Scholar]


