Abstract
Background and Purpose
Enhancing hematoma clearance through phagocytosis may reduce brain injury after intracerebral hemorrhage (ICH). In the current study, we investigated the role of CD47 in regulating erythrophagocytosis and brain injury after ICH in nude mice.
Methods
This study was in two parts. First, male adult nude mice had an intracaudate injection of 30-µl saline, blood from male adult wild type (WT) mice or blood from CD47 knockout (CD47 KO) mice. Second, mice had an intracaudate injection of 30-µl CD47 KO blood with clodronate or control liposomes. Clodronate liposomes were also tested in saline-injected mice. All mice then had magnetic resonance imaging to measure hematoma size and brain swelling. Brains were used for immunohistochemistry and Western blot.
Results
Erythrophagocytosis occurred in and around the hematoma. Injection of CD47 KO blood resulted in quicker clot resolution, less brain swelling, and less neurological deficits compared to WT blood. Higher brain heme oxygenase-1 levels and more microglial activation (mostly M2 polarized microglia) at day-3 were found after CD47 KO blood injection. Co-injection of clodronate liposomes, to deplete phagocytes, caused more severe brain swelling and less clot resolution.
Conclusion
These results indicated CD47 has a key role in hematoma clearance after ICH.
Keywords: intracerebral hemorrhage, CD47, erythrophagocytosis, brain injury
Introduction
Hematoma clearance occurs after intracerebral hemorrhage (ICH) with erythrocytes in the clot being phagocytized by microglia/macrophages1–3. Enhancing such phagocytosis results in less brain injury after ICH2, 4. While many factors may affect the initiation of phagocytosis, one factor is cluster of differentiation 47 (CD47)5, 6. CD47, an integrin-associated protein, is expressed on erythrocytes and other cells and it regulates target cell phagocytosis3, 7. CD47 on erythrocytes blocks phagocytosis through interaction with an inhibitory receptor, SIRPα, expressed by microglia/ macrophages7–9. CD47-deficient erythrocytes are more prone to phagocytosis than wild type cells10, 11 and it is suggested that CD47 down-regulation might lead to clearance of erythrocytes as they age12.
Macrophages have an important role in preserving tissue integrity and function by engulfing old and damaged cells including erythrocytes13, 14. Macrophage/microglia have been classified as classically activated (M1 phenotype) and alternatively activated (M2 phenotype)1516.
In this study, we investigated the role of erythrocyte CD47 in hematoma clearance and brain injury in an ICH model in nude mice. Brain swelling and hematoma clearance were also examined after depleting macrophages/microglia with clodronate liposomes.
Materials and Methods
Animal preparation and intracerebral injection
All animal procedures were approved by the University Committee on Use and Care of Animals, University of Michigan, and were conducted in accordance with the United States Public Health Service's Policy on Humane Care and Use of Laboratory Animals. Ten adult male C57BL/6 mice (wild type, WT, Charles River Laboratories) and 14 male CD47 knockout mice (CD 47 KO, University of Michigan Breeding Core) were used as blood donors. Blood from those animals or saline was then injected into a total of 63 male nude mice (aged 3–5 months, Charles River Laboratories). Nude mice were chosen to facilitate inter-animal injections.
The ICH model was produced as previously described17, 18. Briefly, animals were anesthetized with ketamine (90 mg/kg, i.p., Abbott Laboratories) and xylazine (5 mg/kg i.p., Lloyd Laboratories). Body temperature was maintained at 37.5 °C by a feedback-controlled heating pad. Donor blood was collected from WT or CD47 KO mice by femoral artery catheterization by PE10 tube. Nude mice were positioned in a stereotaxic frame and a cranial burr hole (1 mm) was drilled near the right coronal suture 2.5 mm lateral to the midline. A 26-gauge needle was inserted stereotaxically into the right basal ganglia (coordinates: 0.2 mm anterior, 3.5 mm ventral, and 2.5 mm lateral to the bregma). Either 30µL of donated blood or saline was infused at a rate of 2 µL/min using a microinfusion pump. The needle remained in position for a further 10 minutes and then was gently removed. The burr hole was filled with bone wax, and the skin incision sutured closed.
Experimental groups
In the first part, nude mice had an intracaudate injection of 30µl saline (n=14) or blood donated from WT (n=14) or CD47 KO (n=14) mice. Nude mice underwent MRI imaging and behavioral testing and were euthanized at 3 days. In the second part, nude mice had an injection of a mixture of 30µL CD47 KO blood with 5µL of clodronate liposome or control liposome (FormuMax Scientific, Palo Alto, CA). Control mice received 30µL saline plus 5µL of clodronate liposome. Mice were euthanized at 3 days after MRI imaging (n=7 per group). Brains were used for histology or Western blot assays. Death did not occur in all experimental groups.
Magnetic resonance imaging and measurement
Nude mice had a preoperative MRI as baseline, and postoperative scans at days 1 and 3. Mice were anesthetized with 2% isoflurane/air mixture throughout MRI examination. MRI scanning was performed in a 7.0-T Varian MR scanner (183-mm horizontal bore; Varian, Palo Alto, CA) at the Center for Molecular Imaging of the University of Michigan. The imaging protocol for all the mice included a T2 fast spin-echo (repetition time/echo time=4000/60ms) and T2* gradient-echo sequences (repetition time/echo time=250/5ms). The field of view was 20×20mm and the matrix was 256×256mm. Twenty-five coronal slices (0.5-mm thick) were acquired from the frontal pole to the brain stem and the images were preserved as 256×256 pixels pictures. Afterwards, two parameters (T2* lesion volume and brain swelling ratio) were calculated in NIH image J. The T2* lesion was outlined along the border of the hyper-intense area and the lesion volume was obtained by combining the hyper-intense area over all slices and multiplied by sections thickness. In our previous study, we found that at day 1 and day 3 after ICH, T2* imaging can detect hematoma size19. In this study, therefore, T2* imaging was performed at day 1 and day 3 after ICH to determine the hematoma clearance. A brain swelling ratio was calculated based upon 7 every other sections whose center was the anterior commissure layer. The ratio was calculated as (ipsilateral - contralateral hemispheric volume)/ contralateral hemispheric volume ×100%. All measurements were performed by a blinded observer.
Behavioral tests
Forelimb use asymmetry and corner turn tests were used to assess behavioral deficits in all the nude mice models17, 20, 21. For forelimb use asymmetry measurement, behavior score was recorded by determining the number of times the ipsilateral (unimpaired) forelimb (I), contralateral forelimb (C), and both forelimbs (B) used as a percentage of total number of limb usage. A single, overall limb-use asymmetry score was calculated as follows: Forelimb Use Asymmetry Score=(I−C)/(I+C+B). Corner turn test was performed as follows. The mouse was allowed to proceed into a corner with a 30° angle. When the mouse turned, its choice of direction (left or right) was recorded. Each mouse repeated this procedure for 20 times. The percentage of right turns was calculated. The neurological scores were evaluated by a blinded observer.
Immunohistochemistry staining
Immunohistochemistry staining was performed as described previously22. Briefly, mice were euthanized (ketamine 120 mg/kg and xylazine 5 mg/kg i.p) and perfused with 4% paraformaldehyde in 0.1mM phosphate-buffered saline (pH 7.4). Brain samples were embedded in a mixture of 30% sucrose and optimal cutting temperature compound (Sakura Finetek, Inc.) and 18µm slices were sectioned on a cryostat. Hematoxylin and eosin (H & E) staining was used for erythrocyte phagocytosis observation. Immunohistochemistry studies were performed with avidin-biotin complex technique as previously described23. The primary antibodies were polyclonal rabbit anti-heme oxygenase-1 (HO-1, Abcam, 1:400 dilution), polyclonal rabbit anti-Iba1 (Wako, 1:400 dilution), polyclonal rat anti-CD86 (Abcam, 1:100 dilution), and polyclonal rabbit anti-CD206 (Abcam, 1:500 dilution).
Western blotting
Western blot analysis was performed as previously described22. Briefly, brain tissue was perfused with 0.1mM phosphate-buffered saline (pH 7.4) after euthanasia and bilateral basal ganglia sampled. Then, each sample was immersed in Western sample buffer and sonicated. Protein concentration was determined by Bio-Rad protein assay kit, and 50µg protein from each sample was separated by sodium dodecyl sulfate-polyacrylamide gel electrophoresis and transferred to a Hybond-C pure nitrocellulose membrane (Amersham). The primary antibodies were polyclonal rabbit anti-HO-1 (Abcam, 1:2000 dilution), polyclonal rabbit anti-Iba1 (Wako, 1:1000 dilution), polyclonal rabbit anti-CD86 (Abcam, 1:5000 dilution), polyclonal rabbit anti-CD206 (Abcam, 1:500 dilution), polyclonal rabbit anti β-actin (Cell Signaling, 1:5000 dilution), sheep anti-Arg-1 IgG (R&D System, 1:1000 dilution), and rabbit anti-CD16 IgG (Abcam, 1:1000 dilution). The secondary antibodies were goat anti rabbit IgG (Bio-Rad, 1:2,000 dilution) and rabbit anti-sheep IgG (Bio-Rad, 1:2,000 dilution). The antigen-antibody complexes were visualized with the ECL chemiluminescence system (Amersham) and exposed to Kodak X-OMAT film. Relative band densities were analyzed with NIH Image J.
Statistical analysis
All the data in this study are presented as mean ± SD. Data were analyzed by Student t test or ANOVA with SNK post hoc test. p<0.05 was considered statistically significant.
Results
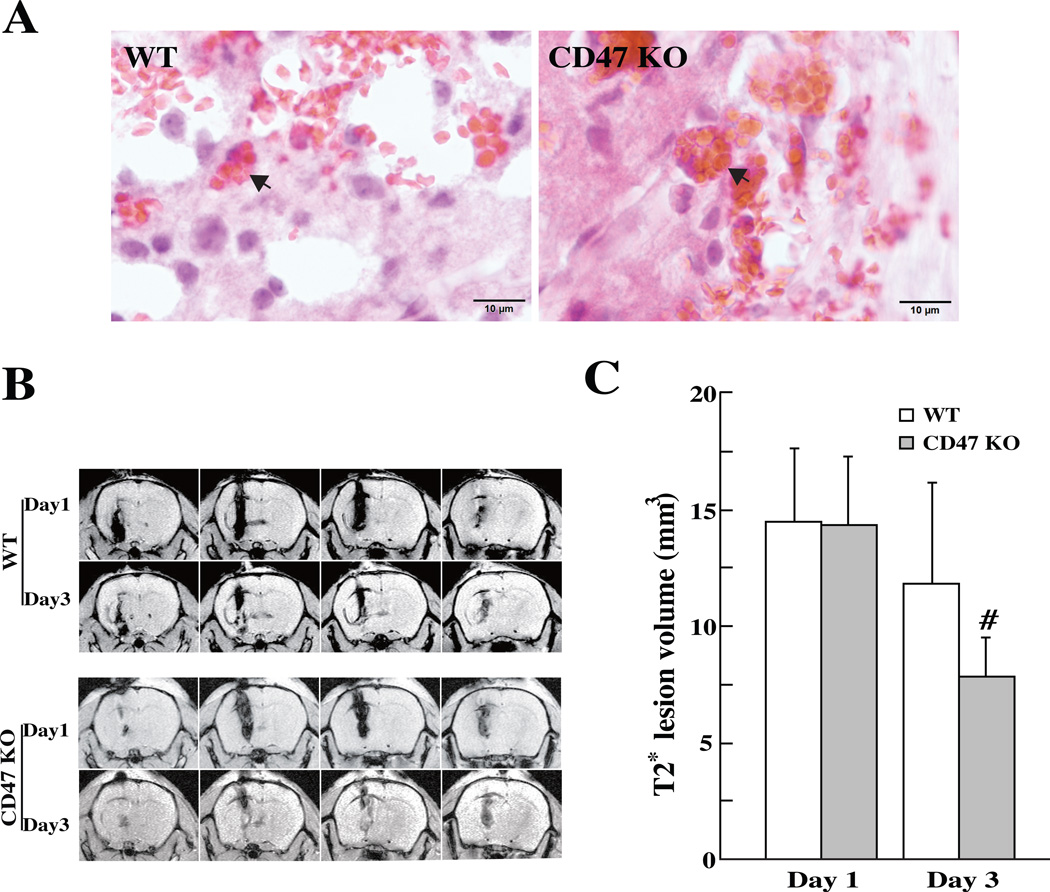
Erythrophagocytosis was examined on coronal sections of mice brains after H & E staining. In mice received either WT blood or CD47 KO blood, erythrocytes were phagocytized by macrophages and/or microglia in the perihematomal area at day-3 (Fig. 1A). Hematoma volume (assessed by T2* lesion volume) showed no difference between two groups at day 1 (14.3±2.9 vs. 14.4±3.2 mm3, p>0.05, Fig. 1B, C). However, when ICH was induced with CD47 KO blood, T2* volumes were significantly smaller compared to WT blood at day 3 (7.8±1.7 vs.11.8±4.3 mm3, p<0.01; Fig. 1B, C).
Figure 1.
(A) Erythrophagocytosis (indicated by arrows) in the perihematomal area at day-3 after injection of 30µl blood from WT or CD47 KO mice, scale bar = 10 µm. (B) T2* weighted MRI showing the lesions in the ipsilateral hemisphere at days 1 and 3 after blood injection. (C) T2* lesion volume in the ipsilateral hemisphere at days 1 and 3. Values are mean ± SD; n=14, #p<0.01 vs. WT group.
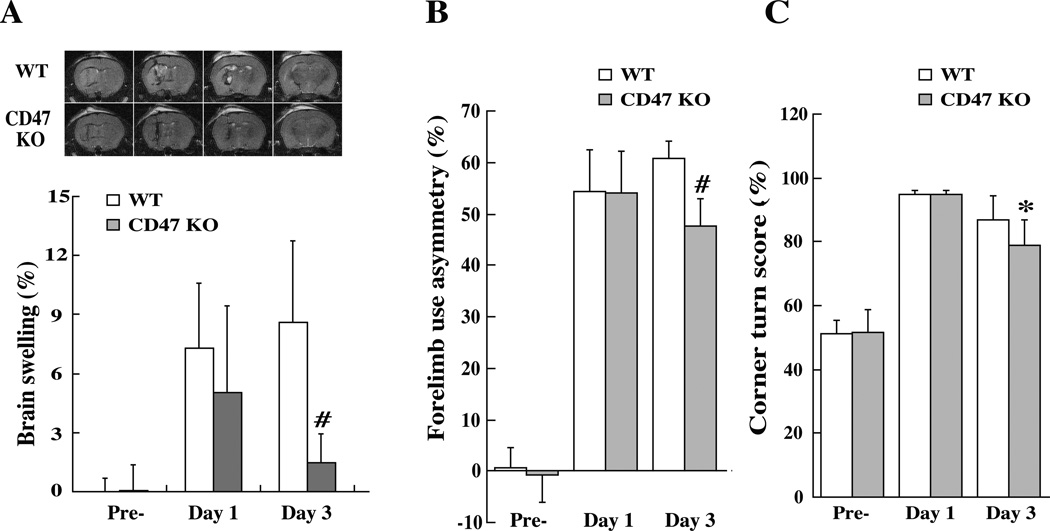
ICH caused brain swelling in the ipsilateral hemisphere. At day 3, ICH-induced brain swelling was much less in the CD47 KO blood group (1.5 ± 1.5 vs. 8.6 ± 4.1%, p<0.01, Fig. 2A). Neurological deficits were assessed by forelimb use asymmetry and corner turn tests prior to ICH, and then at day-1 and day-3 after ICH. WT blood and CD47 KO blood resulted in same behavioral deficits at day 1. However, the neurological deficits were less in CD47 KO blood injected group at day-3 (forelimb use asymmetry, 48±5 vs. 61±3% in the WT blood injected group, p<0.01, Fig. 2B; corner turn score, 79±8 vs. 87±8% in the WT blood injected group, p<0.05, Fig. 2C).
Figure 2.
(A) T2 weighted magnetic resonance imaging (MRI) showing brain swelling ((ipsilateral-contralateral hemisphere/ contralateral hemisphere)×100%) at days 1 and 3 after ICH. Values are mean ± SD; n=14, #p<0.01, vs. WT group. (B) Forelimb use asymmetry and (C) corner turn scores before and after ICH. Values are mean ± SD; n=14, #p<0.01, *p<0.05, vs. WT group
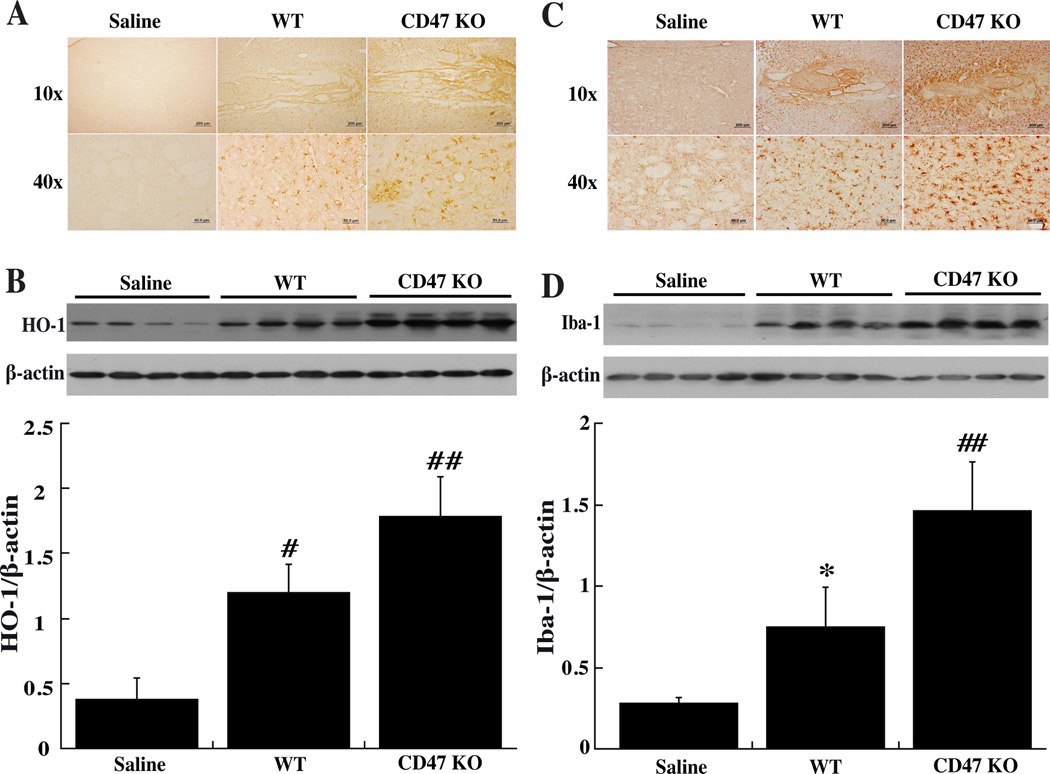
There was almost no immunoreactivity for HO-1 in the ipsilateral basal ganglia after saline injection at day-3 but a marked increase after injection of WT or CD47 KO blood (Fig. 3A). Quantification of HO-1 levels by Western blot indicated that brain HO-1 levels were greater in mice injected with CD47 KO blood compared to WT blood (1.79±0.3 vs. 1.2±0.21, p<0.01, Fig. 3B).
Figure 3.
Immunoreactivity and protein levels of HO-1 (A, B) and Iba-1 (C, D) in the ipsilateral basal ganglia at day-3 after injected of 30µl saline or blood from either WT or CD47 KO mice into the right caudate. Values are mean ± SD; n=4 for each group, *p<0.05, #p<0.01 vs. saline group; ##p<0.01 vs. the other groups.
Intracerebral injection of blood caused significant microglia activation at either day-1 or day-3. There was massive increase in ameboid-shaped Iba-1 positive cells in the ipsilateral basal ganglia after injection of WT blood and this was even greater in the CD47 KO blood injected group (Fig. 3C). These results were confirmed by Western blot. Iba-1 protein levels were upregulated in ipsilateral basal ganglia after injection of WT blood (p<0.05 vs. saline, Fig. 3D) and there was a further increase in mice with a CD47 KO blood injection (1.46±0.3 vs. 0.75±0.25, p<0.01; Fig. 3D).
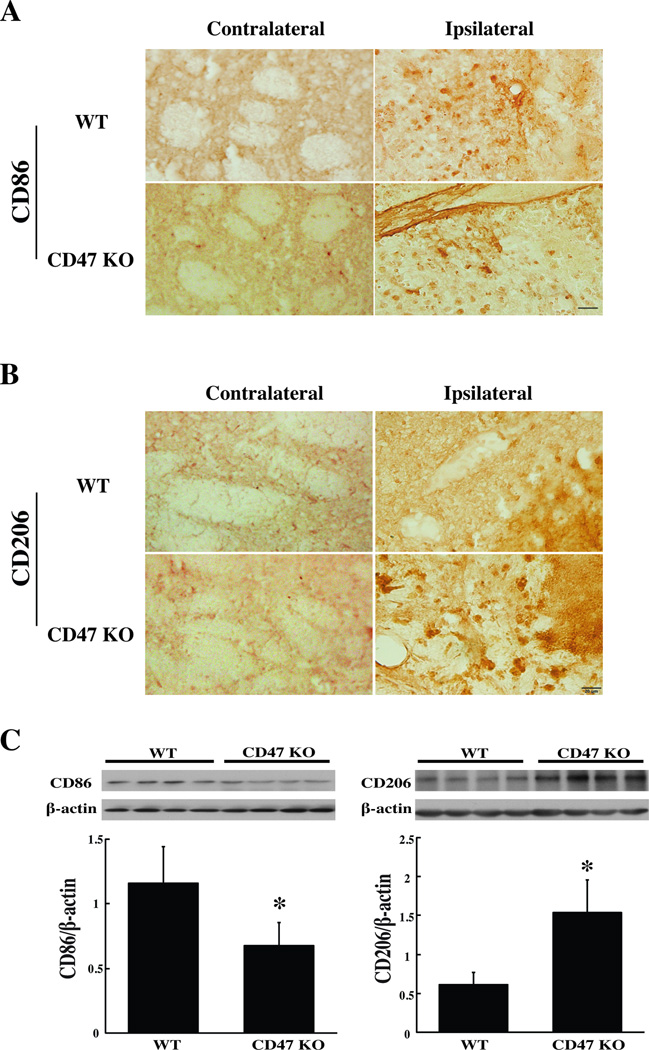
Microglia/macrophage polarization is categorized into classical (M1) and alternative (M2) activation. In the present study, both CD86 (an M1 cell surface marker) and CD206 (an M2 cell surface marker) were expressed in the ipsilateral basal ganglia 3 days after CD47 KO or WT blood injection (Fig. 4A, B). Only a few cells expressed both CD86 and CD206 (Suppl Fig. I). Three days after WT blood injection, CD86 levels in the ipsilateral basal ganglia were higher than those with CD47 KO blood (CD86/β-actin: 1.16±0.29 vs. 0.68±0.19 with CD47 KO blood injection, p<0.05), but CD206 levels were lower (CD206/β-actin: 0.61±0.16 vs. 1.53±0.42 vs. in CD47 KO blood injection group, p<0.05) (Fig. 4C).
Figure 4.
Immunoreactivity of CD86 (A) and CD206 (B) in the perihematomal area at day-3 after injection of 30µl blood from WT or CD47 KO mice. Scale bar=20 µm. (C) CD86 and CD206 protein levels in the ipsilateral basal ganglia 3 days after injection of WT or CD47 KO blood. Values are mean ± SD; n=4 for each group, *p<0.05 vs. the WT group.
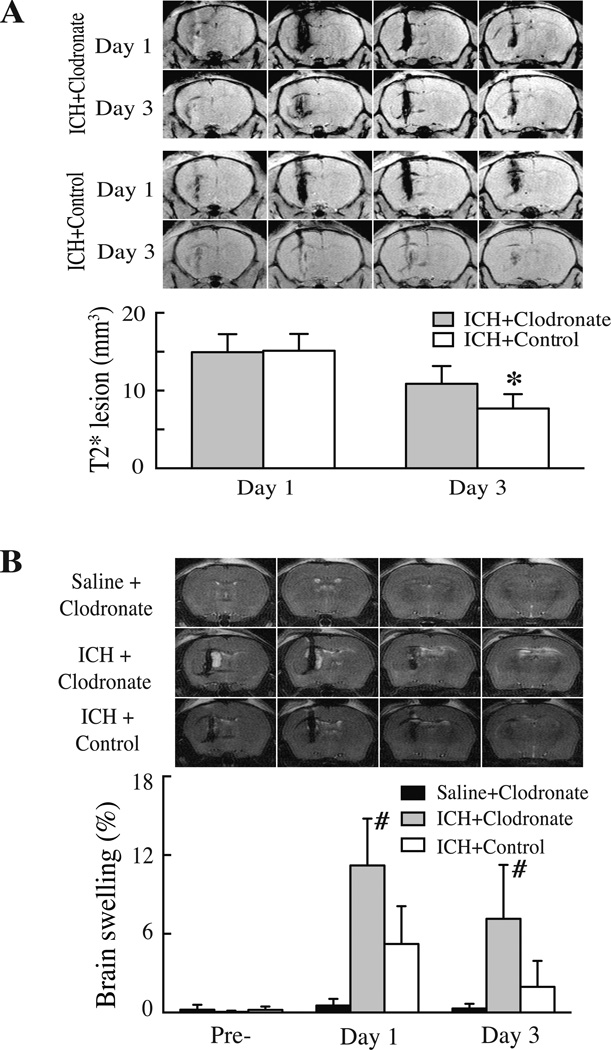
To elucidate the role of microglia/macrophages in erythrophagocytosis and brain injury after ICH, clodronate liposomes were used to selectively deplete phagocytic macrophages24. Co-injection of clodronate liposome or control liposome with CD47 KO blood resulted in similar T2* lesions at day-1 (14.9±2.3 vs. 15.1±2.2 mm3 in control group, p>0.05). However, T2* lesions were larger in the clodronate-treated group at day-3 (10.9±2.3 vs. 7.7±1.8 mm3 in control liposome group, p<0.05; Fig. 5A). Clodronate liposome co-injection also resulted in more severe brain swelling than control liposomes at both day-1 (11.2±3.6 vs. 5.2±2.9%, p<0.01, Fig. 5B) and day-3 (7.1±4.1 vs. 2.0±2.0%, p<0.05, Fig. 5B). Clodronate liposomes injected with saline rather than blood did not cause brain swelling (Fig. 5B). In addition, we found that clodronate liposome itself has no effects on microglia activation after intracerebral injection (Suppl Fig. II).
Figure 5.
(A) T2* weighted MRI showing the lesions in the ipsilateral hemisphere at days 1 and 3 after injection of 30µl blood from CD47 KO mice mixed with 5µl clodronate liposome or control liposome into the right basal ganglia. Bar graphs show quantification of lesion volumes. Values are mean ± SD; n=7 for each group, *p<0.05, vs. control group. (B) T2 weighted MRI showing brain swelling at day 1 after injection of 30µl blood from CD47 KO mice mixed with 5µl clodronate liposome or control liposome or saline with clodronate. Bar graphs show quantification of brain swelling ((ipsilateral-contralateral hemisphere/ contralateral hemisphere)×100%)) at days 0, 1 and 3. Values are mean ± SD, n=7 for each group, #p<0.01 vs. the other groups.
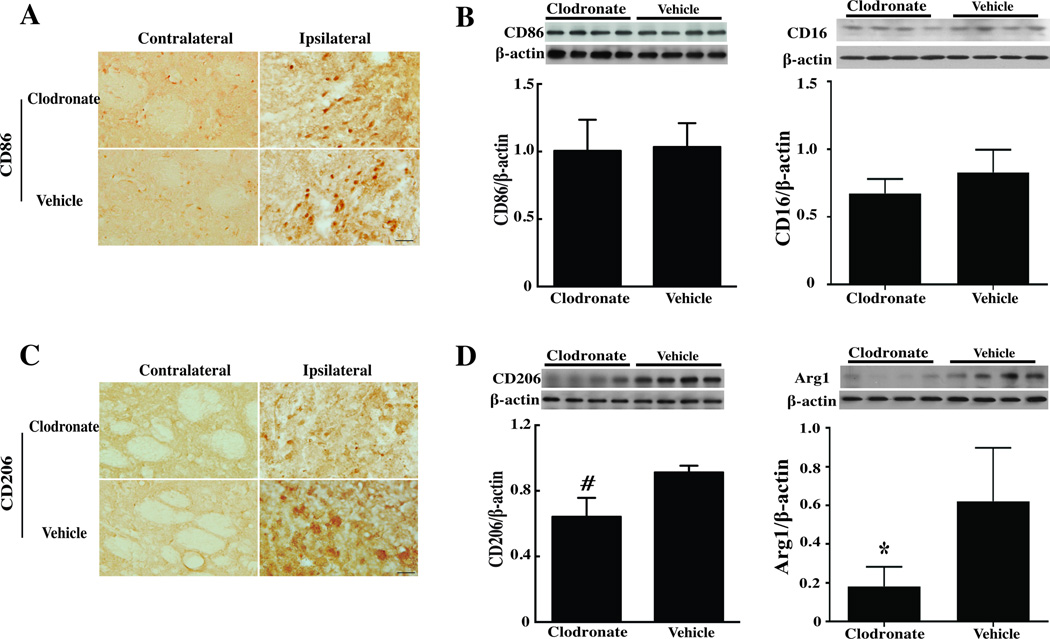
Whether or not clodronate liposome treatment differentially affects M1 or M2 microglia/macrophages was examined using CD206 and arginase-1 as markers of the M2 phenotype and CD86 and CD16 as markers of the M1 phenotype. Clodronate liposome co-injection reduced CD206-immunoreactivity and protein levels (p<0.05; Fig. 6) after ICH. It also reduced arginase-1 protein levels (p<0.05; Fig. 6). In control brains, CD206 immunoreactivity was low and injection clodronate liposome did not markedly change brain CD206 immunoreactivity (Suppl Fig. III). In contrast, clodronate liposomes did not change CD86 protein levels in the ipsilateral basal ganglia after ICH (CD86/β-actin: 1.01±0.23 vs. 1.03±0.18 in the control group (p>0.05, Fig. 6), nor did it affect CD16 protein levels (Fig. 6). These data suggest a specific effect of the clodronate liposome on the M2 phenotype.
Figure 6.
(A, B) Immunoreactivity of CD86 and CD206, (C) Protein levels of CD86 and CD16, (D) Protein levels of CD206 and Arg1 in the ipsilateral basal ganglia at day-3 after injection of 30µl blood from CD47 KO mice with 5 µl clodronate liposome or control liposome into the right basal ganglia, scale bar = 20µm. Values are mean ± SD; n=4 for each group, *p<0.05, #p<0.01 vs. the vehicle group.
Discussion
There were four major findings in the current study: 1) hematoma clearance was faster when the ICH was formed using CD47 KO blood; 2) the injection of CD47 KO blood caused less brain swelling and neurological deficits; 3) CD47 KO blood induced greater HO-1 upregulation, microglial activation and M2 phenotype polarization; and 4) co-injection of clodronate liposomes depleted M2 microglia/ macrophages, and caused more brain swelling and less hematoma clearance. We hypothesize that erythrocyte CD47 inhibits microglia/macrophage M2 polarization, erythrophagocytosis and thus hematoma clearance and that the effect of those changes is to enhance ICH-induced brain injury. That hypothesis is supported by the finding that depleting M2 microglia/macrophages with clodronate liposomes also enhanced ICH-induced brain injury.
Microglia are cells within the brain that are activated in response to injury. In normal brain, microglia are in a quiescent state, but in the event of injury they become highly phagocytic and are involved in clearing debris, damaged cells and clot from the site of damage25. Activation of microglia occurs after ICH, and is enhanced in aged rats26. Macrophages clear damaged or aged cells via phagocytosis27. Erythrocytes are eliminated by phagocytosis after accumulating of “eat me” signals on the cell surface28–30. Recent studies have demonstrated that activating microglia/ macrophages enhances hematoma resolution and improves functional outcome in a rat model of ICH1, 2.
CD47 has an important role in erythrophagocytosis. CD47 expression was increased in the perihematomal white and grey matter and iron played role in CD47 expression in pig ICH3. CD47 down-regulation might lead to clearance of erythrocytes as they age12. In the present study, injection of CD47 deficient blood resulted in a stronger response of microglia/macrophages and faster hematoma clearance. CD47 inhibition could be a target for enhancing hematoma removal and reducing ICH-induced brain injury. Recently, there has been considerable interest in the cancer field in targeting CD47 with blocking antibodies to enhance phagocytosis31 and that approach is currently in clinical trial (NCT02216409, NCT02367196).
Macrophages are ‘professional’ phagocytes that have an important role in preserving tissue integrity and function by engulfing old and damaged cells including erythrocytes13, 14. Two different forms of macrophage/microglia have been identified; classically activated (M1 phenotype, cytotoxic macrophages) and alternatively activated (M2 phenotype, neuroprotective macrophage)1516. M1 activation results in a decreased ability to phagocytose myelin, whereas M2 activation increases phagocytic activity32, 33. In cerebral ischemia, M2 phenotype macrophage/microglia populate the ischemic core aiding in resolving inflammation and promoting wound healing at 24 hours after insult34. In spinal cord injury, TNF-α in combination with iron results in M1 polarization and plays detrimental role in recovery15. We found that thrombin stimulates microglia to release the pro-inflammatory cytokines, tumor necrosis factor-alpha and interleukin-1beta, and microglial inhibition with minocycline reduces brain injury after ICH35. Minocycline selectively inhibits M1 polarization of microglia in an amyotrophic lateral sclerosis mouse model36. In the current study, we found that clodronate liposome can selectively impact M2 polarization in the ICH model. The mechanism of clodronate liposome in macrophage depletion has been described24, 37. Liposomes are engulfed by macrophages with phagocytic function. Then, clodronate, which is released after the phospholipid bilayers of the liposomes are disrupted by lysosomal phospholopases, induces macrophage apoptosis. Here, we demonstrate that CD47 KO blood injection enhances M2 microglia/macrophage activation and that depletion of M2 macrophages causes more brain swelling and slower hematoma clearance after ICH. Together, these results indicate that erythrophagocytosis has a role in the mechanism of brain injury after ICH.
HO-1 is markedly upregulated after ICH primarily in microglia and it is a key enzyme in degrading heme released from hemoglobin. Increased brain HO-1 levels may accelerate heme degradation and result in brain damage after ICH and SAH23, 38, 39. However, some literature report a protective function40 and, in the current study, CD47 KO blood increased HO-1 levels and was associated with reduced ICH-induced brain injury. The role of HO-1 in ICH-induced brain injury may depend on cell location and degree of activity.
We focused on acute phase in this proof-of-concept study because significant reductions of brain swelling (>80%) and T2* lesion (>30%) were found in CD 47 knockout blood group compared to the WT blood group at day 3. A long-term study is needed in the future to determine the effects of erythrocyte CD47 on brain atrophy and long-term functional outcome following ICH.
In conclusion, compared to WT blood, intracerebral injection of CD47 KO blood resulted in quicker hematoma clearance and less brain injury in nude mice. Co-injection of clodronate liposomes with blood depleted M2 microglia/macrophages, reduced hematoma clearance and caused more severe brain swelling. These results suggest a significant role of CD47 in hematoma removal after ICH.
Supplementary Material
Acknowledgments
Sources of Funding: This study was supported by grants NS-084049, NS-091545, NS-090925, NS-073595, and NS-079157 from the National Institutes of Health (NIH).
Footnotes
Disclosure: We declare that we have no conflict of interest.
References
- 1.Zhao X, Sun G, Zhang J, Strong R, Song W, Gonzales N, et al. Hematoma resolution as a target for intracerebral hemorrhage treatment: Role for peroxisome proliferator-activated receptor gamma in microglia/macrophages. Ann Neurol. 2007;61:352–362. doi: 10.1002/ana.21097. [DOI] [PubMed] [Google Scholar]
- 2.Zhao X, Grotta J, Gonzales N, Aronowski J. Hematoma resolution as a therapeutic target: The role of microglia/macrophages. Stroke. 2009;40:S92–S94. doi: 10.1161/STROKEAHA.108.533158. [DOI] [PubMed] [Google Scholar]
- 3.Zhou X, Xie Q, Xi G, Keep RF, Hua Y. Brain cd47 expression in a swine model of intracerebral hemorrhage. Brain Res. 2014;1574:70–76. doi: 10.1016/j.brainres.2014.06.003. [DOI] [PMC free article] [PubMed] [Google Scholar]
- 4.Xi G, Strahle J, Hua Y, Keep RF. Progress in translational research on intracerebral hemorrhage: Is there an end in sight? Prog Neurobiol. 2014;115C:45–63. doi: 10.1016/j.pneurobio.2013.09.007. [DOI] [PMC free article] [PubMed] [Google Scholar]
- 5.Ravichandran KS. Find-me and eat-me signals in apoptotic cell clearance: Progress and conundrums. J Exp Med. 2010;207:1807–1817. doi: 10.1084/jem.20101157. [DOI] [PMC free article] [PubMed] [Google Scholar]
- 6.Ravichandran KS. Beginnings of a good apoptotic meal: The find-me and eat-me signaling pathways. Immunity. 2011;35:445–455. doi: 10.1016/j.immuni.2011.09.004. [DOI] [PMC free article] [PubMed] [Google Scholar]
- 7.Olsson M, Nilsson A, Oldenborg PA. Target cell cd47 regulates macrophage activation and erythrophagocytosis. Transfus Clin Biol. 2006;13:39–43. doi: 10.1016/j.tracli.2006.02.013. [DOI] [PubMed] [Google Scholar]
- 8.Matozaki T, Murata Y, Okazawa H, Ohnishi H. Functions and molecular mechanisms of the cd47-sirpalpha signalling pathway. Trends Cell Biol. 2009;19:72–80. doi: 10.1016/j.tcb.2008.12.001. [DOI] [PubMed] [Google Scholar]
- 9.Sato R, Ohnishi H, Kobayashi H, Kiuchi D, Hayashi A, Kaneko Y, et al. Regulation of multiple functions of shps-1, a transmembrane glycoprotein, by its cytoplasmic region. Biochemical and biophysical research communications. 2003;309:584–590. doi: 10.1016/j.bbrc.2003.08.031. [DOI] [PubMed] [Google Scholar]
- 10.Olsson M, Bruhns P, Frazier WA, Ravetch JV, Oldenborg PA. Platelet homeostasis is regulated by platelet expression of cd47 under normal conditions and in passive immune thrombocytopenia. Blood. 2005;105:3577–3582. doi: 10.1182/blood-2004-08-2980. [DOI] [PMC free article] [PubMed] [Google Scholar]
- 11.Olsson M, Nilsson A, Oldenborg PA. Dose-dependent inhibitory effect of cd47 in macrophage uptake of igg-opsonized murine erythrocytes. Biochemical and biophysical research communications. 2007;352:193–197. doi: 10.1016/j.bbrc.2006.11.002. [DOI] [PubMed] [Google Scholar]
- 12.Jaiswal S, Jamieson CH, Pang WW, Park CY, Chao MP, Majeti R, et al. Cd47 is upregulated on circulating hematopoietic stem cells and leukemia cells to avoid phagocytosis. Cell. 2009;138:271–285. doi: 10.1016/j.cell.2009.05.046. [DOI] [PMC free article] [PubMed] [Google Scholar]
- 13.Savill J, Fadok V. Corpse clearance defines the meaning of cell death. Nature. 2000;407:784–788. doi: 10.1038/35037722. [DOI] [PubMed] [Google Scholar]
- 14.Greenberg S, Grinstein S. Phagocytosis and innate immunity. Curr Opin Immunol. 2002;14:136–145. doi: 10.1016/s0952-7915(01)00309-0. [DOI] [PubMed] [Google Scholar]
- 15.Kroner A, Greenhalgh AD, Zarruk JG, Passos Dos Santos R, Gaestel M, David S. Tnf and increased intracellular iron alter macrophage polarization to a detrimental m1 phenotype in the injured spinal cord. Neuron. 2014;83:1098–1116. doi: 10.1016/j.neuron.2014.07.027. [DOI] [PubMed] [Google Scholar]
- 16.Kigerl KA, Gensel JC, Ankeny DP, Alexander JK, Donnelly DJ, Popovich PG. Identification of two distinct macrophage subsets with divergent effects causing either neurotoxicity or regeneration in the injured mouse spinal cord. J Neurosci. 2009;29:13435–13444. doi: 10.1523/JNEUROSCI.3257-09.2009. [DOI] [PMC free article] [PubMed] [Google Scholar]
- 17.Nakamura T, Xi G, Hua Y, Schallert T, Hoff JT, Keep RF. Intracerebral hemorrhage in mice: Model characterization and application for genetically modified mice. J Cereb Blood Flow Metab. 2004;24:487–494. doi: 10.1097/00004647-200405000-00002. [DOI] [PubMed] [Google Scholar]
- 18.Yang S, Nakamura T, Hua Y, Keep RF, Younger JG, Hoff JT, et al. Intracerebral hemorrhage in complement c3-deficient mice. Acta neurochirurgica. Supplement. 2006;96:227–231. doi: 10.1007/3-211-30714-1_49. [DOI] [PubMed] [Google Scholar]
- 19.Wu G, Xi G, Hua Y, Sagher O. T2* magnetic resonance imaging sequences reflect brain tissue iron deposition following intracerebral hemorrhage. Translational Stroke Research. 2010;1:31–34. doi: 10.1007/s12975-009-0008-6. [DOI] [PMC free article] [PubMed] [Google Scholar]
- 20.Schallert T, Fleming SM, Leasure JL, Tillerson JL, Bland ST. Cns plasticity and assessment of forelimb sensorimotor outcome in unilateral rat models of stroke, cortical ablation, parkinsonism and spinal cord injury. Neuropharmacology. 2000;39:777–787. doi: 10.1016/s0028-3908(00)00005-8. [DOI] [PubMed] [Google Scholar]
- 21.Hua Y, Schallert T, Keep RF, Wu J, Hoff JT, Xi G. Behavioral tests after intracerebral hemorrhage in the rat. Stroke. 2002;33:2478–2484. doi: 10.1161/01.str.0000032302.91894.0f. [DOI] [PubMed] [Google Scholar]
- 22.Xi G, Keep RF, Hua Y, Xiang JM, Hoff JT. Attenuation of thrombin-induced brain edema by cerebral thrombin preconditioning. Stroke. 1999;30:1247–1255. doi: 10.1161/01.str.30.6.1247. [DOI] [PubMed] [Google Scholar]
- 23.Wu J, Hua Y, Keep RF, Nakamura T, Hoff JT, Xi G. Iron and iron-handling proteins in the brain after intracerebral hemorrhage. Stroke. 2003;34:2964–2969. doi: 10.1161/01.STR.0000103140.52838.45. [DOI] [PubMed] [Google Scholar]
- 24.Van Rooijen N, Sanders A. Liposome mediated depletion of macrophages: Mechanism of action, preparation of liposomes and applications. J Immunol Methods. 1994;174:83–93. doi: 10.1016/0022-1759(94)90012-4. [DOI] [PubMed] [Google Scholar]
- 25.Streit WJ, Walter SA, Pennell NA. Reactive microgliosis. Progress in Neurobiology. 1999;57:563–581. doi: 10.1016/s0301-0082(98)00069-0. [DOI] [PubMed] [Google Scholar]
- 26.Gong Y, Hua Y, Keep RF, Hoff JT, Xi G. Intracerebral hemorrhage: Effects of aging on brain edema and neurological deficits. Stroke. 2004;35:2571–2575. doi: 10.1161/01.STR.0000145485.67827.d0. [DOI] [PubMed] [Google Scholar]
- 27.Wright SD, Tobias PS, Ulevitch RJ, Ramos RA. Lipopolysaccharide (lps) binding protein opsonizes lps-bearing particles for recognition by a novel receptor on macrophages. J Exp Med. 1989;170:1231–1241. doi: 10.1084/jem.170.4.1231. [DOI] [PMC free article] [PubMed] [Google Scholar]
- 28.Barnhart MI, Lusher JM. Structural physiology of the human spleen. Am J Pediatr Hematol Oncol. 1979;1:311–330. [PubMed] [Google Scholar]
- 29.Mebius RE, Kraal G. Structure and function of the spleen. Nature reviews. Immunology. 2005;5:606–616. doi: 10.1038/nri1669. [DOI] [PubMed] [Google Scholar]
- 30.Weiss L. The red pulp of the spleen: Structural basis of blood flow. Clin Haematol. 1983;12:375–393. [PubMed] [Google Scholar]
- 31.Willingham SB, Volkmer JP, Gentles AJ, Sahoo D, Dalerba P, Mitra SS, et al. The cd47-signal regulatory protein alpha (sirpa) interaction is a therapeutic target for human solid tumors. Proc Natl Acad Sci U S A. 2012;109:6662–6667. doi: 10.1073/pnas.1121623109. [DOI] [PMC free article] [PubMed] [Google Scholar]
- 32.Smith ME, van der Maesen K, Somera FP. Macrophage and microglial responses to cytokines in vitro: Phagocytic activity, proteolytic enzyme release, and free radical production. J Neurosci Res. 1998;54:68–78. doi: 10.1002/(SICI)1097-4547(19981001)54:1<68::AID-JNR8>3.0.CO;2-F. [DOI] [PubMed] [Google Scholar]
- 33.Gratchev A, Kzhyshkowska J, Utikal J, Goerdt S. Interleukin-4 and dexamethasone counterregulate extracellular matrix remodelling and phagocytosis in type-2 macrophages. Scand J Immunol. 2005;61:10–17. doi: 10.1111/j.0300-9475.2005.01524.x. [DOI] [PubMed] [Google Scholar]
- 34.Perego C, Fumagalli S, De Simoni MG. Temporal pattern of expression and colocalization of microglia/macrophage phenotype markers following brain ischemic injury in mice. J Neuroinflammation. 2011;8:174. doi: 10.1186/1742-2094-8-174. [DOI] [PMC free article] [PubMed] [Google Scholar]
- 35.Wu J, Yang S, Xi G, Fu G, Keep RF, Hua Y. Minocycline reduces intracerebral hemorrhage-induced brain injury. Neurol Res. 2009;31:183–188. doi: 10.1179/174313209X385680. [DOI] [PMC free article] [PubMed] [Google Scholar]
- 36.Kobayashi K, Imagama S, Ohgomori T, Hirano K, Uchimura K, Sakamoto K, et al. Minocycline selectively inhibits m1 polarization of microglia. Cell death & disease. 2013;4:e525. doi: 10.1038/cddis.2013.54. [DOI] [PMC free article] [PubMed] [Google Scholar]
- 37.van Rooijen N, Sanders A. Elimination, blocking, and activation of macrophages: Three of a kind? J Leukoc Biol. 1997;62:702–709. doi: 10.1002/jlb.62.6.702. [DOI] [PubMed] [Google Scholar]
- 38.Okubo S, Strahle J, Keep RF, Hua Y, Xi G. Subarachnoid hemorrhage-induced hydrocephalus in rats. Stroke. 2013;44:547–550. doi: 10.1161/STROKEAHA.112.662312. [DOI] [PMC free article] [PubMed] [Google Scholar]
- 39.Gao F, Liu F, Chen Z, Hua Y, Keep RF, Xi G. Hydrocephalus after intraventricular hemorrhage: The role of thrombin. J Cereb Blood Flow Metab. 2014;34:489–494. doi: 10.1038/jcbfm.2013.225. [DOI] [PMC free article] [PubMed] [Google Scholar]
- 40.Otterbein LE, Soares MP, Yamashita K, Bach FH. Heme oxygenase-1: Unleashing the protective properties of heme. Trends in immunology. 2003;24:449–455. doi: 10.1016/s1471-4906(03)00181-9. [DOI] [PubMed] [Google Scholar]
Associated Data
This section collects any data citations, data availability statements, or supplementary materials included in this article.


