

Abstract
To develop effective stem cell therapies, it is important to track therapeutic cells non-invasively and monitor homing to areas of pathology. The purpose of this study was to (1) design and evaluate the labeling efficiency of commercially available dextran-coated superparamagnetic iron oxide nanoparticles, FeraTrack Direct (FTD), in various stem and immune cells; (2) assess cytotoxicity and tolerability of the FTD in stem cells; and (3) monitor stem cell homing using FTD-labeled bone marrow derived mesenchymal stromal cells (BMSC) and neural stem cells (NSC) in a tumor model by in vivo MRI. The FTD labeled BMSC, NSC, hematopoietic stem cells (HSC), T-lymphocytes, and monocytes effectively without the need for transfection agents, and Prussian blue (PB) staining and transmission electron microscopy (TEM) confirmed intracellular uptake of the agent. The viability, proliferation, and functionality of the labeled cells were minimally or not affected after labeling. When 106 FTD-labeled BMSC or NSC were injected to C6 glioma bearing nude mice, the cells homing to the tumors were detected as hypointense regions within the tumor using 3T clinical MRI up to 10 days post-injection. Histological analysis confirmed the homing of injected cells to the tumor by presence of PB positive cells that are not macrophages. Labeling of stem cells or immune cells with FTD was non-toxic, and should facilitate the translation of this agent to clinical trials for evaluation of trafficking of cells by MRI.
Keywords: Super paramagnetic iron oxide nanoparticles, Dextran, transfection reagent free or direct labeling, Bone Marrow Stromal Cells, Neural Stem Cells, Hematopoietic Stem Cells, T-Cells, Moncytes, Magnetic Resonance Imaging, Cell Labeling, Cell tracking, Glioma, FeraTrack Direct
Introduction
Cell therapies in regenerative medicine offer great promise in the new ways of treating injured tissues (1,2). Adult stem or progenitor cells have been used as a part of treatment strategies of various tumors (3–5). In order to validate and improve cell therapies, a non-invasive way of tracking the cells in vivo is necessary. Current approaches to cell tracking include direct radiolabeling, reporter genes for optical and radioactive imaging, and magnetic labeling of cells (6–10). Magnetic resonance imaging (MRI) coupled with magnetically labeled cells offers high resolution and non-invasive cell tracking ability (11). Superparamagnetic iron oxide nanoparticles (SPION) developed for MR contrast and iron-deficiency treatment have been used in combination with other cationic transfection agents such as protamine sulfate and poly-L-lysine through electrostatic interactions (12). Ferumoxides were then coupled with Food and Drug Administration (FDA) approved protamine sulfate (FePro) to form a prototype nanocomplexes that could be used to label stem cells in the clinical realm, but unfortunately ferumoxides were removed from the market (13). Recently, ferumoxytol (Feraheme, Amag Pharmaceuticals Inc.), an ultrasmall SPION was introduced clinically for the treatment of iron deficiency anemia for chronic kidney disease. Ferumoxytol has also been used as an intravascular MRI contrast agent because of its carbohydrate coating that provides it with a long circulating half-life in vivo (14). Nanocomplexes formed by combining ferumoxytol (F) with FDA approved agents, heparin sulfate (H) and protamine sulfate (P), HPF or FHP has been used for magnetically labeling stem cells (11). However, the incorporation of the amount of iron /cell was less than that was previously reported with FePro (12,15). Recently, HPF nanocomplexes have been used to label HB1.F3.CD, genetically engineered neural stem cells, in a phase I clinical trial for evaluation of safety and tracking cells by MRI in patients with recurrent glioblastoma (16). Micron-sized iron oxide particles (MPIO) have also been used to label cells to be tracked using MRI in the nervous system (17), however they are not FDA approved (18,19). The major experimental advantage of MPIO is the amount of iron that can be endocytosed by certain cell types, making it possible for single cell detection with experimental MRI (20). Unfortunately, all SPION- and MPIO-labeled cells appear as hypointense voxels on T2* weighted images, and are difficult to differentiate from hemorrhage or heme by-products. Also, the magnetic label from dead or apoptotic cells can be phagocytosed by macrophages and microglia, confounding image interpretation (21).
There are various clinical grade non-FDA approved SPION that are promising to make it to the clinic. Other FDA approved agents such as poly(lactide-co-glycolide) (22) or heparin (23) besides dextran (9) have been used as coatings of iron oxide crystals for use in cell labelling studies. Recently, Miltenyi Biotec (Bergisch Gladbach, Germany) developed SPION decorated with a highly biocompatible dextran coating. These particles display a positive surface charge that facilitate endocytic uptake (24,25) by many different cell types without the aid of additional reagents or external force such as electroporation. Moreover, labeling procedures containing other agents can be complex and complicate downstream processing of the labeled cells.
The purpose of this study was to evaluate and characterize the feasibility of using commercially available dextran-coated SPION, FeraTrack Direct (FTD), as a direct cell-labeling agent for tracking stem cells in vivo by MRI. FTD was evaluated to determine the labeling efficiency of various stem and immune cells currently used in cell therapies. Differentiation capability and viability of the FTD labelled stem cells were compared to the no label counter parts. Finally, bone marrow derived mesenchymal stromal cells (BMSC) and neural stem cells (NSC) labeled with the FTD were used to monitor the cell homing in a mouse flank tumor model at 3T MRI.
Results
Chemical characterization of FTD
The hydrodynamic diameter of the FTD was determined to be 214 ± 4.9 nm using the mean of the intensity weighted size distribution. The median distribution of hydrodynamic diameter between 10–90 % range was 99.4–346.2 nm (supporting information Figure 1 and Table 1). The zeta potential determined from at least 6 measurements as described in the Experimental section was in the range of +15 to +20 mV with an average of 17.43 ± 1.58 mV (supporting information Figure 2, Table 2).
Cell labeling and iron content
Adherent stem cells such as BMSC, human fetal NSC immortalized with v-myc and genetically engineered to express cytosine deaminase (HB1.F3.CD), and human induced pluripotent stem cell derived NSC (HIP-NSC) were almost 100% positive for Prussian blue (PB) after over-night incubation with 20 μg/ml FTD in their culture medium (Figure 1 A–C). Other nanoparticle forming agents or starvation periods without serum in the culture medium were not necessary to achieve optimal cell labeling of these stem cells. Hematopoietic stem cells (HSC), T cells, and monocytes did not label as efficiently in cell culture medium alone, but when the cells were incubated on a 96-well magnetic plate for 24–48 hr with FTD, labeled cells were observed in areas of concentrated FTD. The FTD-labeled cells were then separated from unlabeled cells using magnetically activated cell sorting (MACS) columns. Using this approach, most of the MACS separated cells were Prussian blue (PB) or 3, 3′-diaminobenzidine (DAB) enhancement positive cells (Figure 1 D–F). The average intracellular iron content per cell is reported in Table 1. Iron content ranged from 21.97 ± 5.23 pg/cell in BMSC to 0.69 ± 0.08 pg/cell in CD34+ HSC. Transmission electron microscopy (TEM) images of labeled cells confirmed internalization and encapsulation of majority of FTD inside endosomes with occasional nanoparticles bound to the outer membrane of cells after heparin washes (Figure 2). The range in diameters of the cells used in these studies was as follows: monocytes= 8–11 μm; T cells= 6–10 μm; BMSC= 16–21 μm; HSC= 8–10 μm; HB1.F3.CD =10–14 μm; and HIP-NSC= 7–10 μm.
Figure 1.
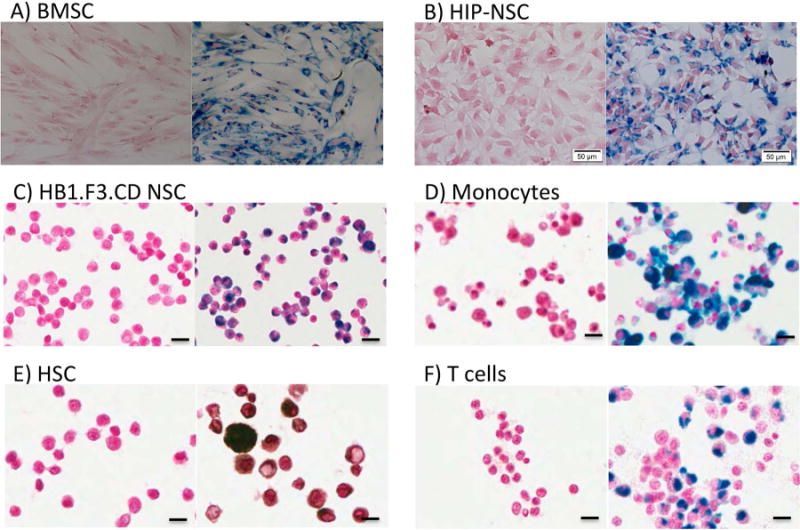
Representative images of PB-stained, FTD-labeled human stem or immune cells. Unlabeled (left) and 20 μg/ml FTD-labeled (right) cells. (A) PB-stained BMSC. 10× magnification, scale bar = 100 μm. (B) PB-stained HIP-NSC. 20× magnification, scale bar = 50 μm. (C) PB-stained HB1.F3.CD NSC. 20× magnification, scale bar = 20 μm. (D) PB-stained monocytes. 40× magnification, scale bar = 10 μm. (E) PB-DAB-enhanced HSC. 40× magnification, scale bar = 10 μm. (F) PB-stained T cells. 40× magnification, scale bar = 10 μm.
Table 1.
Intracellular iron content after labeling. Data expressed as mean ± SD from 3–4 samples.
| Cells | Intracellular Iron (pg/cell, Mean ± SD) | Intracellular Iron Reported by Thu et al(11)(pg/cell) | Intracellular Iron Reported by Arbab et al(12)(pg/cell) |
|---|---|---|---|
| BMSC | 21.97 ± 5.23 | 2.12 ± 0.11 | 10.94 ± 1.86 |
| HB1.F3.CD | 11.45 ± 4.04 | 2.8 ± 1.19 | ---------- |
| HIP-NSC | 4.04 ± 0.26 | ----------- | ----------- |
| CD34+ HSC | 0.69 ± 0.08 | 1.33 ± 0.2 | 2.01 ± 0.10 |
| T-cells | 0.75 ± 0.05 | 0.73 ± 0.25 | ----------- |
| Monocytes | 1.34 ± 0.17a 9.93 ± 0.65b |
2.56 ± 1.1 | ----------- |
unactivated monocytes;
activated monocytes.
Figure 2.
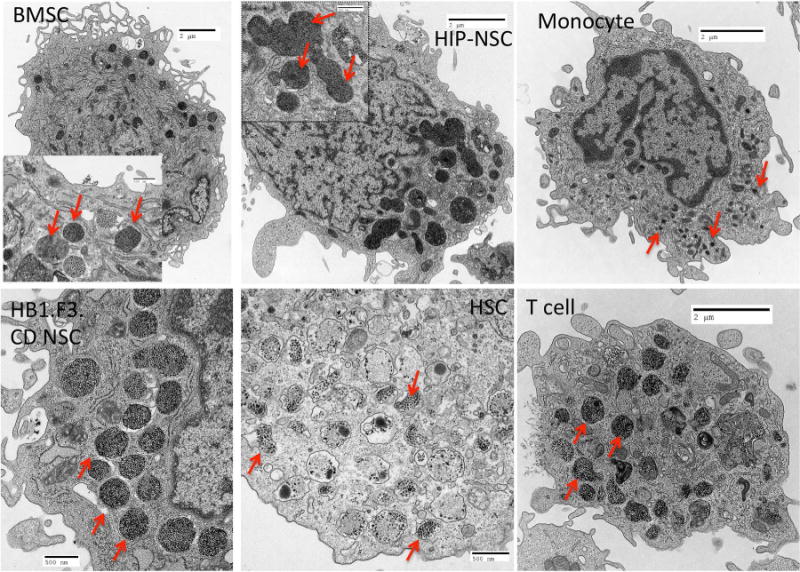
EM images of internalization and encapsulation of FTD. FTD was encapsulated in the endosomes as electron-dense nanoparticles indicated by red arrows. Scale bars for BMSC, HIP-NSC, monocytes, and T cell are 2 μm. Scale bars for HB1.F3.CD NSC and HSC are 0.5 μm. Inset scale bars are 0.5 μm.
Proliferation, toxicity, differentiation, and function
There was no significant effect on proliferation after labeling with FTD in BMSC or HB1.F3.CD NSC. Unexpectedly, HSC showed a significant increase in proliferation (35.5 ± 0.043%, p<0.0001), partly due to MACS separation of FTD-labeled HSC as this technique excludes unlabeled cells along with the dead cell population that did not actively endocytose FTD. HIP-NSC showed a slight but significant decrease (10.4 ± 0.015%, p<0.01) in proliferation shown by MTS assays (Figure 3A). Reactive oxygen species (ROS) production in FTD-labeled BMSC was similar to control. However, ROS significantly increased by 21.5 ± 0.026% (p<0.01) in HSC indicating some oxidative stress in the labeled cells (Figure 3B). HB1.F3.CD and HIP-NSC showed significantly (p<0.0001) less ROS production in labeled cells as compared to control unlabeled cells. HIP-NSC behaved differently from all other stem cells in both MTS and ROS production assays. HIP-NSC response to H2O2 was minimal in proliferation and ROS production. In comparison, HB1.F3.CD behaved similar to other cells in response to the H2O2 challenge. Pulse chase experiments revealed that the FTD within the labeled BMSC and HIP-NSC cells were diluted after each passage, but remained PB positive for three following passages (Figure 4). The differentiation capacity of FTD-labeled BMSC into fat, cartilage, and bone was unaltered after labeling as shown in Figure 5. Moreover, both unlabeled and FTD-labeled HIP-NSC differentiated mostly into neurons expressing microtubule-associated protein 2 (MAP2, green, Figure 6A,D) and non-phosphorylated neurofilament (SMI-32) (green, Figure 6B,E). Glial fibrillary acidic protein (GFAP)-expressing astrocytes (red, Figure 6C,F) were also detected as expected for the differentiation of HIP-NSC.
Figure 3.
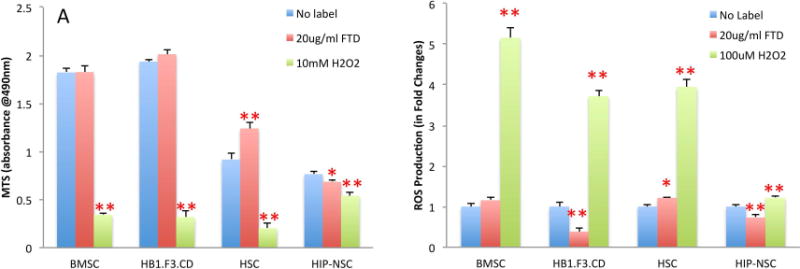
Proliferation and ROS production FTD-labeled stem cells. (A) Results of MTS proliferation assay of FTD-labeled BMSC, HB1.F3.CD NSC, HSC, and HIP-NSC at day 1 as compared to unlabeled cells and 10 mM H2O2 treated cells. (B) Results of ROS production in FTD-labeled cells at day 1 as compared to unlabeled cells and 100 μM H2O2 treated cells. Data from a representative experiment are shown as mean + SD with n=6 in each group. * P<0.01, ** P<0.0001.
Figure 4.
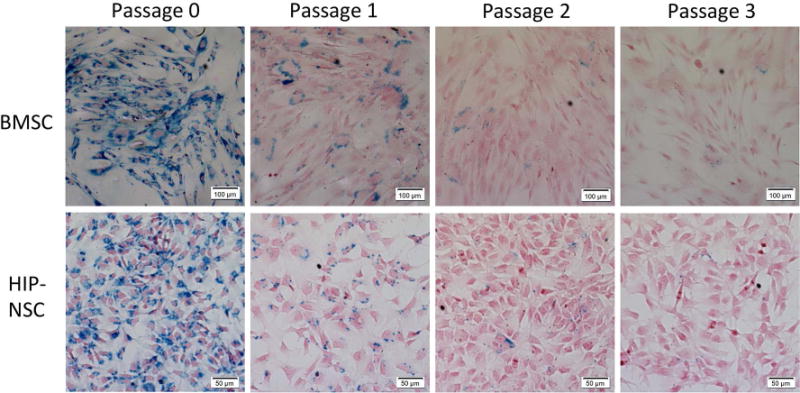
Dilution of FTD in cultured FTD-labeled BMSC and HIP-NSC. The microphotographs show PB staining of BMSC and HIP-NSC cultured in vitro. Cells were labeled at Passage 0 with FTD.
Figure 5.
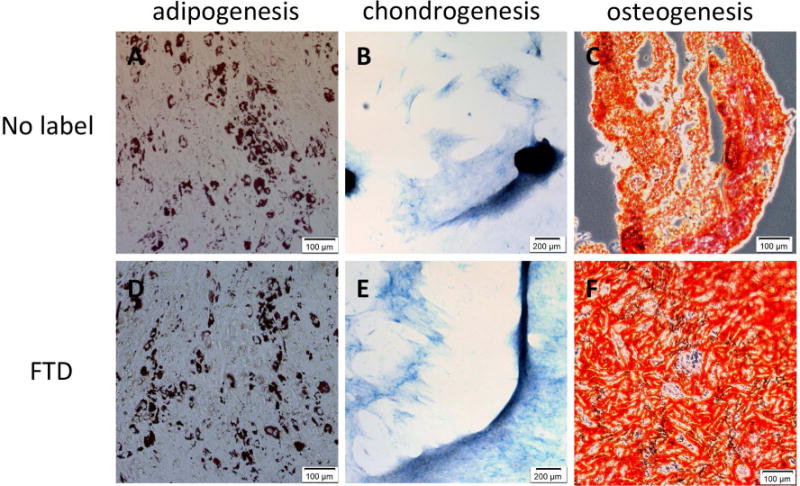
Differentiation of FTD-labeled and unlabeled BMSC. (A, D) Oil-Red-O staining after adipogenic differentiation. 10× magnification, scale bar = 100 μm. (B, E) Alcian Blue staining after chondrogenic differentiation. 4× magnification, scale bar = 200 μm. (C, F) Alizarin Red S staining after osteogenetic differentiation. 10× magnification, scale bar = 100 μm.
Figure 6.
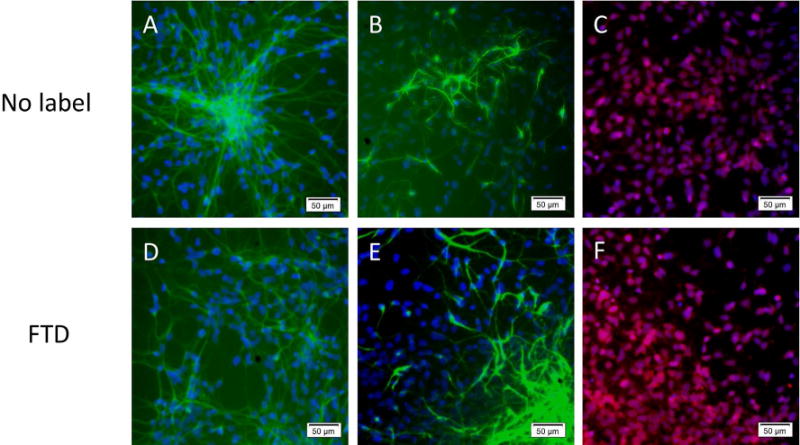
Differentiation of FTD-labeled and unlabeled HIP-NSC. (A, D) Differentiation was observed into MAP2 (green) positive neurons (B, E) or into SMI32 (green) positive neurons. (C, F) or GFAP (red) positive astrocytes, DAPI nuclear stain is in blue. 10× magnification, scale bar = 50 μm.
In vivo tracking of cells by MRI
In vivo MRI were acquired at 3T, 1 – 10 days after the tail-vein injection of FTD-labeled cells into C6 glioma flank tumor bearing nude mice. The hypointense voxels were detected within the tumors of mice that received 1 million FTD-labeled BMSCs (Figure 7B) or HB1.F3.CD NSCs (Figure 7C) up to 10 days after the injection. Mice that received unlabeled cells showed no hypointense voxels within the tumor on T2* weighted images (Figure 7A). After mice were euthanized, the tumors were dissected and sectioned for histological analysis. In the 10 μm-thick sections of the tumors, cells positive for PB staining and negative for F4/80 macrophage immuno-staining (Figure 7D–I) were detected in BMSC and HB1.F3.CD injected tumors.
Figure 7.
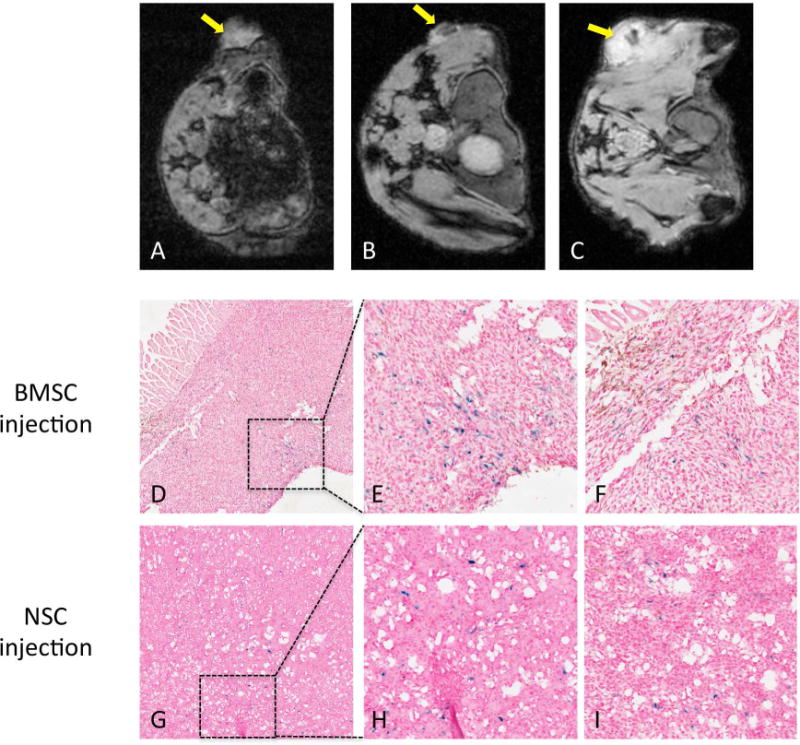
MRI of FTD-labeled BMSC and NSC in flank tumors. (A) MRI of tumor with unlabeled BMSC (yellow arrow). (B) MRI of tumor with FTD-labeled BMSC 10 days after intravenous BMSC injection (yellow arrow). (C) MRI of tumor with FTD-labeled HB1.F3.CD NSC 2 days after intravenous NSC injection (yellow arrow). (D) PB and F4/80 double staining of tumors with FTD-labeled BMSC 10 days after BMSC injection. 4× magnification. (E) Enlarged inset from panel D. 20× magnification. (F) Another enlarged area from the tissue in panel D. 20× magnification. (G) PB and F4/80 double staining of tumor with FTD-labeled HB1.F3.CD NSC 10 days after NSC injection. 4× magnification. (H) Enlarged inset from panel G. 20× magnification. (F) Another enlarged area from the tissue in panel G. 20× magnification.
Discussion
The major goal of this study was to evaluate a new commercially available labeling agent, FTD, for labeling various stem and immune cells, and to demonstrate FTD had minimal toxicity and no effect on differentiation or function of the stem cells. In vivo MRI demonstrated areas of hypointense voxels corresponding to intravenously infused FTD-labeled BMSC or HB1.F3.CD NSC within flank tumors that were confirmed by histological analysis.
In this study, intracellular iron content for different types of cells were determined, and we observed a dependence on the cell’s surface area in which larger cells (i.e., BMSC) with greater cytoplasm/nuclear ratio incorporated more FTD into endosomes. Similar incorporation of iron has also been reported in previous studies using dextran-coated SPION (11,12). Intracellular iron content of BMSC labeled with FTD was comparable to that of FePro (26), and was about ten times greater than cells labeled with HPF or protamine complexed to ferumoxytol (11,27). The adherent stem cells such as BMSC, HB1.F3.CD, and HIP-NSC were labeled efficiently in 20 μg/ml FTD in the absence of other agents or serum starvation. When the adherent stem cells were incubated with a higher concentration of FTD (40 μg/ml), the intracellular iron content did not improve. However, 10 μg/ml FTD concentration resulted in less labeling observed by PB indicating the 20 μg/ml was the optimal concentration for the uptake (data not shown). Immune cells and CD34+ HSC with small cytoplasm to nucleus ratios showed almost no intracellular uptake at either 20 or 40 μg/ml FTD concentrations. However, when magnetic field was applied under the plates containing culture to pull down the suspended FTD closer to the cells, the HSC, monocytes, and T-cells in the vicinity of magnetic field were found to be PB positive and could be separated from unlabeled cells using MACS separation columns. MACS separation columns are commonly used for separation of cells using antibodies tagged with magnetic beads. Moreover, the application of magnets for nucleic acid delivery has been in use over a decade to successfully increase contact of the delivery vehicles and cells to enhance transfection (28). We speculate that the labeling of the immune cells and HSC under magnetic field is due to creating higher local concentration of nanoparticles therefore increasing cell contact with the FTD.
Dextran-coated nanoparticles are known to be taken up through endocytosis (29) and FTD was detected in endosomes of labeled cells as shown by TEM (Figure 3). The intracellular iron was diluted after each passage, however it was visible for three following passages in both BMSC and HIP-NSC (Figure 4). The iron dilution in cells was possibly due to the rapid cell division, iron metabolism, and/or exocytosis. The rate of dilution was similar to what has previously been observed with FePro-labeled cells (30). Endocytosis and exocytosis are dependent on nanoparticle concentration, size, surface properties or coating, cellular incubation time, and organelle distribution (31). Thus, cellular retention time of the iron nanoparticles is the result of an intricate balance between these factors.
When dextran-coated SPION are endocytosed by the cells and transported to endosomes/ lysosomes, the degradation of nanoparticles in the acidic condition causes release of free iron to the cytoplasm (32). Therefore, iron oxide can be toxic at high concentrations due to free radical formation by Fenton reaction (33). ROS generation due to metabolized iron oxides in the labeled cells were minimal in most of the cells examined except for the HSC that had a small, but significant increase in ROS production. Despite the increase in ROS production in HSC, the MTS assay showed increased viability in the HSC labeled with FTD. This could be due to the MACS selection of the labeled HSC that might result in the selection of only healthy and proliferative HSCs that had endocytosed FTD. Moreover, it has been reported that high production of ROS is correlated with proliferation of HSC, and the low cellular ROS level is associated with quiescent HSC (34). Both HB1.F3.CD NSC and HIP-NSC exhibited less ROS production after the FTD labeling despite lack of changes in cell proliferation or viability in HB1.F3.CD NSC and a slight decrease in MTS in HIP-NSC. Most studies associate ROS with cellular toxicities, however Le Belle et al (35) reported that proliferating and self-renewing NSCs have high ROS activity indicating increased ROS production in normal NSC cellular processes. Lower ROS production in NSCs has been linked to decreased neurogenic potential and self-renewal capabilities, indicating some increased cellular toxicity when labeling HIP-NSC with FTD. However, as shown in the differentiation capacity of labeled HIP-NSC, no apparent difference in neuronal and astrocyte differentiation was observed. Since MTS assay is a measure of mitochondrial metabolic activity of cells that could be altered by the presence of ROS species (32), it is not clear whether the lack of differences in cell proliferation in NSC is due to the decrease in ROS production or an artifact regarding labeled cells. It is also known that dextran coating stimulates immune reactions in vivo (36). However, most of the dextran-coated SPION in cell labeling is endocytosed as shown in TEM (Figure 2), and have been reported to cause no difference in a mixed lymphocyte reaction in a previous study by Pawelczyk et al (37).
NSC and MSC have inherent properties to home to tumor microenvironment along the cytokines, hypoxic and inflammatory signal gradients such as VEGF, HIF-1, SDF-1, SCF, and HGF (38). The HB1.F3.CD NSC is a v-myc-immortalized clonal human neural progenitor line expressing cytosine deaminase (CD) for local conversion of pro-drug 5-fluorocytosine to active chemotherapeutic agent 5-fluorouracil (39). The HB1.F3.CD cells have been shown to home to many types of tumors including glioma, melanoma, neuroblastoma, and breast cancer (40). MSCs have been reported to home to various primary and metastatic tumors including gliomas, breast cancer, and lung carcinomas (38). In this study, we clearly observed hypointense voxels within the flank tumors of animals injected with FTD-labeled BMSCs and NSCs. Since the SPION labeling does not permit distinction of labeled cells and T2* shortening caused by hemorrhages within the tumor (7,21,41), the cell infusions and MR images were taken before the tumors became necrotic in the core. In addition, due to the possibility of activated macrophages engulfing infused cells (37) and become PB positive, the tumor tissues were double-stained with PB and F4/80 to confirm the homing of FTD-labeled stem cells in mice. Some of the cells were double positive (appearing in dark brown or black) for PB and F4/80 indicating phagocytosis of the dead or apoptotic cells, however many cells were PB positive alone. It is also difficult to illustrate the viability or proliferation of the infused cells homing to the tumors because the FTD labeling does not provide feedback on cell death, activation, and proliferation (6). This is a known limitation of all SPION cell labeling approaches that have been used to track cells by MRI (42).
Conclusion
We have demonstrated efficient labeling of various stem cells and immune cells using commercially available FTD and a straightforward protocol that facilitated the magnetic cell labeling without the need for other agents. FTD was minimally toxic to the cell proliferation and ROS production in most cell types tested, and reserved the functionality of the stem cells. Finally, MRI at 3T was able to successfully track the homing of the FTD-labeled cells in a flank tumor model. Magnetic labeling of cells using FTD is a promising alternative to labeling cells with ferumoxytol nanocomplexes and can be used for monitoring stem cells and other cells migrate into tissues providing the basis for developing of cell-based strategies in regenerative medicine.
Experimental
Chemical characterization of FTD
The hydrodynamic diameter of the FTD was determined using a Beckman Coulter Delsa Nano HC Particle Analyzer (Beckman Coulter, Brea, CA) and standard disposable plastic cuvettes with a scattering angle of 165°. The particles were suspended in water for measurement. Hydrodynamic diameter was calculated using CONTIN algorithm. The zeta potential of the FTD was determined using the same Beckman apparatus with the standard flow cell attached. The measurements were taken at a scattering angle of 15°. Shortly before the measurement, the particles were transferred to a solution of plain water containing 0.1% pluronic F68 (w/w) and diluted with 0.01M NaCl to yield a final conductivity of the sample of 1.2+−0.2 mS/cm.
Quantification of Iron Concentration in FTD stock solution
Iron concentration of FTD stock solution was determined using the Spectroquant-reagent (Merck, Darmstadt, Germany; code 1.1476, 1.0001 containing thioglycolic acid to reduce Fe3+ to Fe2+ and the chromogenic reagent Na2[3-(2-pyridyl)-5,6-bis(4-phenylsulfonic acid)-1,2,4-triazine]). 10 μL of particle suspension in PBS buffer was incubated with 10 μL of concentrated phosphoric acid for 10 min at room temperature. The clear solution was filled up to a total volume of 1 mL with distilled water. 100 μL of the solution was then mixed with 4.9 mL of distilled water and three drops of Spectroquant reagent. After 10 min incubation time the absorbance at 565 nm is determined and corrected for a blank sample. Iron standards were used for calibration.
Cells
Human BMSC, HIP-NSC, human fetal neural stem cells immortalized with v-myc and genetically engineered to express cytosine deaminase (HB1.F3.CD), CD34+ HSC, T-lymphocytes, and monocytes were used for labeling with FTD provided by Miltenyi Biotec as a part of Material Transfer Agreement. Human BMSC were obtained from normal volunteers enrolled in an IRB approved clinical protocol in the NIH Bone Marrow Stromal Cell Transplantation Center at our institution and expanded in culture. BMSC cultures were used at passages 3–5, and were maintained in alpha-MEM medium (Invitrogen, Life Technologies, Grand Island, NY) supplemented with 20% lot-selected fetal bovine serum (FBS, Gemini Bio Products, West Sacramento, CA). CD34+ HSC were obtained from the NIH Bone Marrow Stromal Cell Transplantation Center at our institution. HSC were cultured in StemLine II basal medium (Sigma-Aldrich, St. Louis, MO) supplemented with 40 ng/ml stem cell factor, 40 ng/ml FMS-related tyrosine kinase-3 (Flt3), and10 ng/ml thrombopoietin (all from PeproTech, Rocky Hill, NJ) at a cell density of 106/ml. Freshly isolated monocytes and T-cells were also obtained from normal volunteers (Department of Transfusion Medicine, NIH, Bethesda, MD). Monocytes were cultured in RPMI-1640 basal medium (Invitrogen) supplemented with 10% FBS. T-cells were cultured in RPMI-1640 medium supplemented with 10 ng/ml Interleukin-2 (IL-2, PeproTech) and 5% FBS. HB1.F3.CD NSC were provided as part of a Material Transfer Agreement by Dr. Karen Aboody at the City of Hope Medical Center, Duarte, CA. HB1.F3.CD NSC were grown in DMEM supplemented with 10% FBS and 2mM Glutamine (Invitrogen). HIP-NSC were purchased from GlobalStem (Rockville, MD) and cultured as the manufacturer’s instruction. Briefly, HIP-NSC were grown on Geltrex™ coated flasks in Neurobasal Medium supplemented with B-27 Supplement (Invitrogen), L-Alanine/L-Glutamine and Non-Essential Amino Acids (Mediatech, Herndon, VA), and FGF2 (GlobalStem). All cells were kept in humidified incubator with 5% CO2 at 37 °C.
Labeling with FTD
Adherent cells (BMSC, HB1.F3.CD, HIP-NSC) were labeled when they were ~70% confluent with FTD by adding the nanoparticles to the cell medium directly in the final concentration of 20 μg/ml, then incubated over-night. Upon removal of the medium containing FTD, cells were washed with HBSS containing 10 U/ml Heparin twice to remove any extra label on the surface of cells prior to trypsinization. Suspension cell cultures (HSC, T cells, Monocytes) 106 cells/ml were labeled with 20 μg/ml FTD in the medium placed over 96-well magnetic plate (System Biosciences, Mountain View, CA) to increase the interaction between cells and the FTD. Only cells in the vicinity of magnetic field were labeled, and the labeled cells were separated from unlabeled cells using Magnetic-Activated Cell Separation (MACS) system (Miltenyi Biotec, Bergisch Gladbach, Germany).
Intracellular iron quantification
Intracellular iron content of FTD-labeled and unlabeled cells was determined using spectrophotometric technique comparing absorptions at 370 and 750 nm described by Dadashzadeh et al (26). Briefly, FTD-labeled cells were lysed with 10% sodium dodecyl sulfate (SDS) at 106 cells/ml concentration. Iron absorptions at 370 and 750 nm were measured using UV–Vis spectrometer (PerkinElmer Lambda 25, Shelton, CT, USA), then the iron content was calculated from standard curve and correction factor (B, ratio of A370nm/A750nm) to account for cellular turbidity using the equation, Fe(μg/ml) = [A370nm − (B*A750nm)]/Slope370nm. Iron content was determined at least in three independent samples, and represented as mean ± SD.
Electron microscopy preparation of nanoparticle labeled cells
FTD-labeled cells were fixed in freshly prepared 2% Glutaraldehyde and 2% paraformaldehyde prepared in 0.1 M sodium cacodylate buffer (all from Electron Microscopy Sciences, Hatfield, PA). After 20 min of fixation at room temperature, cells were pelleted and embedded in 1% agar (Fluka, Sigma-Aldrich) solution prepared in water. Cells-agar blocks were then post-fixed in 1% Osmium Tetroxide (Electron Microscopy Sciences) prepared in 0.1 M Sodium Cacodylate buffer for 2–3 hours on ice followed by three washes in 0.1 M Sodium Cacodylate buffer 10 minutes each on ice. Cell-agar blocks were dehydrated by placing in a graded series of ethanol for 10 minutes each, then stained with 0.5% uranyl acetate (Electron Microscopy Sciences) in 70% ethanol over-night in 4 °C protected from light. The blocks were then rinsed with 100% propylene oxide three times, 5 minutes each at room temperature. Resin was prepared using Araldite 502: Embed-812, then blocks were infiltrated with resin in increasing concentration of resin till 100 % resin was infiltrated. Blocks were then placed in 60 °C for 72 hr, and cooled at RT for the resin to harden. The blocks were ultra-thin sectioned at 60–70 nm and mounted onto 200 mesh copper grids, which was then post-stained with Reynold’s Lead Citrate. The grids were then examined in a FEI Tecnai Pirit Twin Transmission Electron Microscope, operating at 80 kV.
MTS cell proliferation assay
FTD-labeled or unlabeled control cells were assessed for viability and proliferation by MTS assay using CellTiter 96® AQueous One Solution Cell Proliferation Assay (MTS) (Promega, Madison, WI) kit according to the manufacturer’s direction. Adherent cells were trypsinized and seeded in 96-well-plates (104 BMSCs, 3×10⁴ HIP-NSCs, and 2×10⁴ HB1.F3.CD NSCs per well). On the following day, FTD was added to the labeled group over-night for labeling. Two-hours of incubation with 10mM H2O2 was used as a positive control for cytotoxicity. After labeling and washing, 100 μl of fresh medium was added to each well, and then 20 μl of MTS reagent was added, followed by incubation at 37 °C for 2 hr. The MTS absorbance was measured at 490 nm using a multiwell plate reader (PerkinElmer Lambda 25). Each group had n=6 per condition tested.
Intracellular ROS production measurement
The intracellular ROS production was measured using CM-H2DCFDA (Invitrogen), a non-fluorescent molecule that forms fluorescent esters when the molecule is oxidized in the presence of ROS. FTD-labeled or unlabeled cells were collected and loaded with CM-H2DCFDA dye at the final concentration of 5 μM for 30 min at 37 °C. Overnight Incubation with 10 μM H2O2 was used as a positive control to mimic oxidative stress. Cells were washed and resuspended in complete medium and plated in a 96 well plate at 2–4×10⁴ per well. The fluorescence intensity was measured using a multiwell plate reader (PerkinElmer Lambda 25) with an excitation wavelength of 488 nm and an emission wavelength of 520 nm. All ROS production was normalized to the baseline ROS produced by unlabeled and non-stressed counter parts. Each group had n=6 per condition tested.
Retention of FTD in stem cells
To mimic dilution of FTD label in cell division in vivo, BMSC and HIP-NSC were labeled as previously described (described as passage 0), and then subsequently passaged 1:4 when cells reached ~90% confluency up to passage 3. The cells were fixed in 2% paraformaldehyde at appropriate passages, and PB staining was performed to visualize the iron within FTD-labeled cells. An Olympus IX81 inverted scope (Center Valley, PA) attached to a QImaging Retiga-4000R camera (Surrey, BC, Canada) was used to obtain photomicrographs of PB stained cells.
BMSC and HIP-NSC Differentiation
FTD-labeled and unlabeled BMSC and HIP-NSC were subject to differentiation to test their stem-like capacity. Following labeling, BMSC were incubated with StemPro® Adipogenesis, Osteogenesis, and Chondrogenesis differentiation medium (Invitrogen) according to manufacturer’s instructions. Differentiation medium was changed every 2–3 days. Adipogenesis and chondrogenesis were confirmed with Oil-Red-O and Alcian Blue staining respectively after 2 weeks of differentiation, and osteogenesis was detected by Alizarin Red S stain after 3 weeks of differentiation. HIP-NSC differentiation into neurons and astrocytes was performed by withdrawing basic fibroblast growth factor (bFGF) from the complete culture medium for 2 weeks. Differentiation into neurons was confirmed by immunocytochemistry against SMI32 and MAP2. Astrocytes were detected with anti-GFAP antibody. All antibodies were purchased from Abcam (Cambridge, MA).
BMSC and HB1.F3.CD tracking in vivo
For tumor implant, 106 C6 rat glioma cells (American Type Culture Collection, Manassas, VA) were transplanted in BALB/c nude mice (Charles River, Frederick, MD) by subcutaneous injection to the flank. Five to six days after tumor implantation, 106 FTD-labeled or unlabeled BMSC and HB1.F3.CD NSC (n=5 per group) were administered intravenously following intraperitoneal injection of sodium nitroprusside (2 μg/ g of body weight) for transient vasodilation as previously described (43,44). Serial MRI was performed 1–2 days and up to 10 days after cell injection. MRI was performed on a clinical 3 T unit (Achieva, Philips Medical System) using a 4-cm solenoid coil (Philips Research Laboratories). MRI was performed with T2-weighted (T2w) turbo spin echo, repetition time (TR)/echo time (TE) = 2231/9.2 and 60 ms, T2* multiecho multi–Fast Field Echo (FFE), TR = 800 ms, 5 echoes, TE from 5 to 20 by 4 ms, flip angle 30. All images were collected with a field of view of 50 mm, slice thickness 500 μm and final in-plane resolution of 100 × 100 μm. Animals were euthanized 9–10 days after the cell injection, and flank tumors were harvested and fixed in 4% paraformaldehyde in PBS overnight followed by cryoprotection in 30% sucrose and freezing in OCT. Frozen sections of 10 μm tissue slides were cut using Leica CM 1850 cryostat (Leica, Buffalo Grove, IL), and then processed for PB and F4/80 macrophage staining to detect PB positive and F4/80 negative FTD-labeled cells in the tumors.
PB and F4/80 double Immunohistochemical Staining
Ten micron – thick frozen sections of the tumors were washed and rehydrated in TBS prior to permeabilization in 0.3% Triton X-100 in TBS for 15 min. Protein block was performed using Super Block (Scytek, Logan, UT) for 7 min. The sections were then blocked for endogenous peroxidase activity for 5 min in 0.3% H2O2 solution in TBS. After 2 washes in TBS, rat primary antibody against F4/80 (Abcam, Cambridge, MA) was diluted to 5 μg/ml in TBS, and incubated for 90 min at room temperature. Primary antibody was detected using horseradish peroxidase conjugated goat-anti-rat secondary antibody (Vector Laboratories, Burlingame, CA) after 30 min incubation at room temperature. The slides were then incubated with activated diaminobenzidine (DAB) solution for 5 min. After DAB, slides were PB stained with 2% potassium ferric-ferrocyanide (Sigma, St. Louis, MO) in 3.7% hydrochloric acid, and then counterstained with Nuclear Fast Red (Sigma). The slides were then dehydrated, and scanned using Aperio Scanscope CS (Leica Biosystems).
Supplementary Material
Acknowledgments
This research was funded by the Intramural Research Programs of the NIH Clinical Center and the National Institute of Biomedical Imaging and Bioengineering at the National Institutes of Health.
References
- 1.Mooney DJ, Vandenburgh H. Cell delivery mechanisms for tissue repair. Cell Stem Cell. 2008;2(3):205–213. doi: 10.1016/j.stem.2008.02.005. [DOI] [PubMed] [Google Scholar]
- 2.Dimarino AM, Caplan AI, Bonfield TL. Mesenchymal Stem Cells in Tissue Repair. Front Immunol. 2013;4:201. doi: 10.3389/fimmu.2013.00201. [DOI] [PMC free article] [PubMed] [Google Scholar]
- 3.Cihova M, Altanerova V, Altaner C. Stem cell based cancer gene therapy. Mol Pharm. 2011;8(5):1480–1487. doi: 10.1021/mp200151a. [DOI] [PubMed] [Google Scholar]
- 4.Binello E, Germano IM. Stem cells as therapeutic vehicles for the treatment of high-grade gliomas. Neuro Oncol. 2012;14(3):256–265. doi: 10.1093/neuonc/nor204. [DOI] [PMC free article] [PubMed] [Google Scholar]
- 5.Duarte S, Carle G, Faneca H, de Lima MC, Pierrefite-Carle V. Suicide gene therapy in cancer: where do we stand now? Cancer Lett. 2012;324(2):160–170. doi: 10.1016/j.canlet.2012.05.023. [DOI] [PubMed] [Google Scholar]
- 6.Kircher MF, Gambhir SS, Grimm J. Noninvasive cell-tracking methods. Nat Rev Clin Oncol. 2011;8(11):677–688. doi: 10.1038/nrclinonc.2011.141. [DOI] [PubMed] [Google Scholar]
- 7.Arbab AS, Janic B, Haller J, Pawelczyk E, Liu W, Frank JA. In Vivo Cellular Imaging for Translational Medical Research. Current medical imaging reviews. 2009;5(1):19–38. doi: 10.2174/157340509787354697. [DOI] [PMC free article] [PubMed] [Google Scholar]
- 8.Nguyen PK, Riegler J, Wu JC. Stem Cell Imaging: From Bench to Bedside. Cell Stem Cell. 2014;14(4):431–444. doi: 10.1016/j.stem.2014.03.009. [DOI] [PMC free article] [PubMed] [Google Scholar]
- 9.Edmundson M, Thanh NT, Song B. Nanoparticles based stem cell tracking in regenerative medicine. Theranostics. 2013;3(8):573–582. doi: 10.7150/thno.5477. [DOI] [PMC free article] [PubMed] [Google Scholar]
- 10.Wang Y, Xu C, Ow H. Commercial nanoparticles for stem cell labeling and tracking. Theranostics. 2013;3(8):544–560. doi: 10.7150/thno.5634. [DOI] [PMC free article] [PubMed] [Google Scholar]
- 11.Thu MS, Bryant LH, Coppola T, Jordan EK, Budde MD, Lewis BK, Chaudhry A, Ren J, Varma NRS, Arbab AS, Frank JA. Self-assembling nanocomplexes by combining ferumoxytol, heparin and protamine for cell tracking by magnetic resonance imaging. Nature Medicine. 2012;18(3):463–467. doi: 10.1038/nm.2666. [DOI] [PMC free article] [PubMed] [Google Scholar]
- 12.Arbab AS, Yocum GT, Kalish H, Jordan EK, Anderson SA, Khakoo AY, Read EJ, Frank JA. Efficient magnetic cell labeling with protamine sulfate complexed to ferumoxides for cellular MRI. Blood. 2004;104(4):1217–1223. doi: 10.1182/blood-2004-02-0655. [DOI] [PubMed] [Google Scholar]
- 13.Josephson L, Rudin M. Barriers to clinical translation with diagnostic drugs. J Nucl Med. 2013;54(3):329–332. doi: 10.2967/jnumed.112.107615. [DOI] [PubMed] [Google Scholar]
- 14.Neuwelt EA, Hamilton BE, Varallyay CG, Rooney WR, Edelman RD, Jacobs PM, Watnick SG. Ultrasmall superparamagnetic iron oxides (USPIOs): a future alternative magnetic resonance (MR) contrast agent for patients at risk for nephrogenic systemic fibrosis (NSF)? Kidney Int. 2009;75(5):465–474. doi: 10.1038/ki.2008.496. [DOI] [PMC free article] [PubMed] [Google Scholar]
- 15.Janic B, Rad AM, Jordan EK, Iskander AS, Ali MM, Varma NR, Frank JA, Arbab AS. Optimization and validation of FePro cell labeling method. PloS one. 2009;4(6):e5873. doi: 10.1371/journal.pone.0005873. [DOI] [PMC free article] [PubMed] [Google Scholar]
- 16.Gutova M, Frank JA, D’Apuzzo M, Khankaldyyan V, Gilchrist MM, Annala AJ, Metz MZ, Abramyants Y, Herrmann KA, Ghoda LY, Najbauer J, Brown CE, Blanchard MS, Lesniak MS, Kim SU, Barish ME, Aboody KS, Moats RA. Magnetic resonance imaging tracking of ferumoxytol-labeled human neural stem cells: studies leading to clinical use. Stem Cells Transl Med. 2013;2(10):766–775. doi: 10.5966/sctm.2013-0049. [DOI] [PMC free article] [PubMed] [Google Scholar]
- 17.Sumner JP, Shapiro EM, Maric D, Conroy R, Koretsky AP. In vivo labeling of adult neural progenitors for MRI with micron sized particles of iron oxide: quantification of labeled cell phenotype. NeuroImage. 2009;44(3):671–678. doi: 10.1016/j.neuroimage.2008.07.050. [DOI] [PMC free article] [PubMed] [Google Scholar]
- 18.Hinds KA, Hill JM, Shapiro EM, Laukkanen MO, Silva AC, Combs CA, Varney TR, Balaban RS, Koretsky AP, Dunbar CE. Highly efficient endosomal labeling of progenitor and stem cells with large magnetic particles allows magnetic resonance imaging of single cells. Blood. 2003;102(3):867–872. doi: 10.1182/blood-2002-12-3669. [DOI] [PubMed] [Google Scholar]
- 19.Shapiro EM, Skrtic S, Sharer K, Hill JM, Dunbar CE, Koretsky AP. MRI detection of single particles for cellular imaging. Proceedings of the National Academy of Sciences of the United States of America. 2004;101(30):10901–10906. doi: 10.1073/pnas.0403918101. [DOI] [PMC free article] [PubMed] [Google Scholar]
- 20.Shapiro EM, Sharer K, Skrtic S, Koretsky AP. In vivo detection of single cells by MRI. Magnetic resonance in medicine : official journal of the Society of Magnetic Resonance in Medicine/Society of Magnetic Resonance in Medicine. 2006;55(2):242–249. doi: 10.1002/mrm.20718. [DOI] [PubMed] [Google Scholar]
- 21.Tarulli E, Chaudhuri JD, Gretka V, Hoyles A, Morshead CM, Stanisz GJ. Effectiveness of micron-sized superparamagnetic iron oxide particles as markers for detection of migration of bone marrow-derived mesenchymal stromal cells in a stroke model. Journal of magnetic resonance imaging : JMRI. 2013;37(6):1409–1418. doi: 10.1002/jmri.23897. [DOI] [PubMed] [Google Scholar]
- 22.Granot D, Nkansah MK, Bennewitz MF, Tang KS, Markakis EA, Shapiro EM. Clinically viable magnetic poly(lactide-co-glycolide) particles for MRI-based cell tracking. Magn Reson Med. 2014 Mar;71(3):1238–50. doi: 10.1002/mrm.24741. [DOI] [PMC free article] [PubMed] [Google Scholar]
- 23.Lee JH, Jung MJ, Hwang YH, Lee YJ, Lee S, Lee DY, Shin H. Heparin-coated superparamagnetic iron oxide for in vivo MR imaging of human MSCs. Biomaterials. 2012;33(19):4861–4871. doi: 10.1016/j.biomaterials.2012.03.035. [DOI] [PubMed] [Google Scholar]
- 24.Villanueva A, Canete M, Roca AG, Calero M, Veintemillas-Verdaguer S, Serna CJ, Morales Mdel P, Miranda R. The influence of surface functionalization on the enhanced internalization of magnetic nanoparticles in cancer cells. Nanotechnology. 2009;20(11):115103. doi: 10.1088/0957-4484/20/11/115103. [DOI] [PubMed] [Google Scholar]
- 25.Pulfer SK, Gallo JM. Enhanced brain tumor selectivity of cationic magnetic polysaccharide microspheres. Journal of drug targeting. 1998;6(3):215–227. doi: 10.3109/10611869808997896. [DOI] [PubMed] [Google Scholar]
- 26.Dadashzadeh ER, Hobson M, Henry Bryant L, Dean DD, Frank JA. Rapid spectrophotometric technique for quantifying iron in cells labeled with superparamagnetic iron oxide nanoparticles: potential translation to the clinic. Contrast Media & Molecular Imaging. 2013;8(1):50–56. doi: 10.1002/cmmi.1493. [DOI] [PMC free article] [PubMed] [Google Scholar]
- 27.Khurana A, Nejadnik H, Chapelin F, Lenkov O, Gawande R, Lee S, Gupta SN, Aflakian N, Derugin N, Messing S, Lin G, Lue TF, Pisani L, Daldrup-Link HE. Ferumoxytol: a new, clinically applicable label for stem-cell tracking in arthritic joints with MRI. Nanomedicine (Lond) 2013;8(12):1969–1983. doi: 10.2217/nnm.12.198. [DOI] [PMC free article] [PubMed] [Google Scholar]
- 28.Plank C, Zelphati O, Mykhaylyk O. Magnetically enhanced nucleic acid delivery. Ten years of magnetofection-progress and prospects. Adv Drug Deliv Rev. 2011;63(14–15):1300–1331. doi: 10.1016/j.addr.2011.08.002. [DOI] [PMC free article] [PubMed] [Google Scholar]
- 29.Soenen SJ, De Cuyper M. Assessing iron oxide nanoparticle toxicity in vitro: current status and future prospects. Nanomedicine (Lond) 2010;5(8):1261–1275. doi: 10.2217/nnm.10.106. [DOI] [PubMed] [Google Scholar]
- 30.Balakumaran A, Pawelczyk E, Ren J, Sworder B, Chaudhry A, Sabatino M, Stroncek D, Frank JA, Robey PG. Superparamagnetic Iron Oxide Nanoparticles Labeling of Bone Marrow Stromal (Mesenchymal) Cells Does Not Affect Their “Stemness”. PLoS ONE. 2010;5(7):e11462. doi: 10.1371/journal.pone.0011462. [DOI] [PMC free article] [PubMed] [Google Scholar]
- 31.Sakhtianchi R, Minchin RF, Lee KB, Alkilany AM, Serpooshan V, Mahmoudi M. Exocytosis of nanoparticles from cells: role in cellular retention and toxicity. Adv Colloid Interface Sci. 2013:201–202. 18–29. doi: 10.1016/j.cis.2013.10.013. [DOI] [PubMed] [Google Scholar]
- 32.Soenen SJ, De Cuyper M. Assessing cytotoxicity of (iron oxide-based) nanoparticles: an overview of different methods exemplified with cationic magnetoliposomes. Contrast Media Mol Imaging. 2009;4(5):207–219. doi: 10.1002/cmmi.282. [DOI] [PubMed] [Google Scholar]
- 33.Fenton HJH. Oxidation of tartaric acid in presence of iron. J Chem Soc, Trans. 1894;65:899–910. [Google Scholar]
- 34.Jang YY, Sharkis SJ. A low level of reactive oxygen species selects for primitive hematopoietic stem cells that may reside in the low-oxygenic niche. Blood. 2007;110(8):3056–3063. doi: 10.1182/blood-2007-05-087759. [DOI] [PMC free article] [PubMed] [Google Scholar]
- 35.Le Belle JE, Orozco NM, Paucar AA, Saxe JP, Mottahedeh J, Pyle AD, Wu H, Kornblum HI. Proliferative neural stem cells have high endogenous ROS levels that regulate self-renewal and neurogenesis in a PI3K/Akt-dependant manner. Cell Stem Cell. 2011;8(1):59–71. doi: 10.1016/j.stem.2010.11.028. [DOI] [PMC free article] [PubMed] [Google Scholar]
- 36.Kawada M, Arihiro A, Mizoguchi E. Insights from advances in research of chemically induced experimental models of human inflammatory bowel disease. World journal of gastroenterology : WJG. 2007;13(42):5581–5593. doi: 10.3748/wjg.v13.i42.5581. [DOI] [PMC free article] [PubMed] [Google Scholar]
- 37.Pawelczyk E, Jordan EK, Balakumaran A, Chaudhry A, Gormley N, Smith M, Lewis BK, Childs R, Robey PG, Frank JA. In vivo transfer of intracellular labels from locally implanted bone marrow stromal cells to resident tissue macrophages. PLoS ONE. 2009;4(8):e6712. doi: 10.1371/journal.pone.0006712. [DOI] [PMC free article] [PubMed] [Google Scholar]
- 38.Reagan MR, Kaplan DL. Concise review: Mesenchymal stem cell tumor-homing: detection methods in disease model systems. Stem cells. 2011;29(6):920–927. doi: 10.1002/stem.645. [DOI] [PMC free article] [PubMed] [Google Scholar]
- 39.Aboody KS, Najbauer J, Metz MZ, D’Apuzzo M, Gutova M, Annala AJ, Synold TW, Couture LA, Blanchard S, Moats RA, Garcia E, Aramburo S, Valenzuela VV, Frank RT, Barish ME, Brown CE, Kim SU, Badie B, Portnow J. Neural stem cell-mediated enzyme/prodrug therapy for glioma: preclinical studies. Sci Transl Med. 2013;5(184):184ra159. doi: 10.1126/scitranslmed.3005365. [DOI] [PMC free article] [PubMed] [Google Scholar]
- 40.Aboody KS, Najbauer J, Danks MK. Stem and progenitor cell-mediated tumor selective gene therapy. Gene therapy. 2008;15(10):739–752. doi: 10.1038/gt.2008.41. [DOI] [PubMed] [Google Scholar]
- 41.Liu W, Frank JA. Detection and quantification of magnetically labeled cells by cellular MRI. European journal of radiology. 2009;70(2):258–264. doi: 10.1016/j.ejrad.2008.09.021. [DOI] [PMC free article] [PubMed] [Google Scholar]
- 42.Naumova AV, Modo M, Moore A, Murry CE, Frank JA. Clinical imaging in regenerative medicine. Nature biotechnology. 2014;32(8):804–818. doi: 10.1038/nbt.2993. [DOI] [PMC free article] [PubMed] [Google Scholar]
- 43.Gao J, Dennis JE, Muzic RF, Lundberg M, Caplan AI. The dynamic in vivo distribution of bone marrow-derived mesenchymal stem cells after infusion. Cells Tissues Organs. 2001;169(1):12–20. doi: 10.1159/000047856. [DOI] [PubMed] [Google Scholar]
- 44.Schrepfer S, Deuse T, Reichenspurner H, Fischbein MP, Robbins RC, Pelletier MP. Stem cell transplantation: the lung barrier. Transplantation proceedings. 2007;39(2):573–576. doi: 10.1016/j.transproceed.2006.12.019. [DOI] [PubMed] [Google Scholar]
Associated Data
This section collects any data citations, data availability statements, or supplementary materials included in this article.