

Abstract
Objective: Hyperfiltration confers an increased risk of diabetic nephropathy. Early detection can ensure timely intervention and improved treatment outcomes. Because GFR is known to be affected by hyperglycemia, the aim of this study was to compare the influence of hyperglycemia on GFR estimations calculated by the CKD-EPI equation, the CG equation, and the MDRD equations in estimating hyperfiltration in Chinese diabetic patients. Materials and methods: The performance of the equations, compared with the measured 99mTc-DTPA glomerular filtration rate was analyzed in 3492 diabetic patients. Bias, precision, and accuracies were compared with respect to HbA1c status. The Bland-Altman method was used to evaluate the agreement among the equations with respect to the mGFR, and the receiver-operating characteristic curve method was used to evaluate diagnostic value of the three equations with respect to the detection of moderate renal failure and hyperfiltration. Results: The mean absolute bias was the smallest for the CKD-EPI equation in the HbA1c < 7.2% cohort, and the highest accuracy within ± 15% and ± 30% was also reached with the CKD-EPI equation in both cohorts. For the detection of hyperfiltration, the CKD-EPI equation exhibited the best performance with the greatest combination of sensitivity and specificity. The biases of the three equations were significantly higher in the HbA1c ≥ 10.5% subgroup compared with the HbA1c < 7.2% cohort. Conclusion: The CKD-EPI equation can be used as a screening tool for hyperfiltration and appears to be a more generalizable and accurate equation for estimating GFR in Chinese diabetic patients.
Keywords: Diabetic nephropathy, Chronic Kidney Disease Epidemiology Collaboration (CKD-EPI) equation, hyperfiltration
Introduction
Diabetic nephropathy affects 25-40% of patients with diabetes [1], which is the single most common causes of end-stage renal failure worldwide. Hyperfiltration, the early stage of diabetic nephropathy (DN), has been regarded as a putative risk factor in the pathogenesis of clinical nephropathy [2]. A Finnish study of 4201 people with type 1 diabetes also reported an increased risk of mortality at lower and higher eGFR values, with the lowest predicted mortality when eGFR was 70-80 mL/min per 1.73 m [2,3] and attributed the excess risk to incipient microalbuminuria [4], which is also associated with adverse events [5]. Other studies have linked higher levels of eGFR to an increased risk of microalbuminuria or progressive loss of kidney function in people with type 2 diabetes [6,7], although not all reports have confirmed these findings [8]. Data from nondiabetic populations are more limited. A large meta-analysis of seven previous studies with more than 1.1 million participants reported a similar increase in the relative risk of all-cause and cardiovascular death at higher eGFR, although absolute risks and the risks of individual cardiovascular or renal events were not reported [9]. Therefore, early detection can ensure timely intervention and improvement of treatment outcomes. Thus, reliable monitoring of kidney function over time is of major importance for the treatment and prevention of diabetic nephropathy.
Several equations have been developed for daily clinical practice. Among them, the Cockcroft-Gault (CG) equation [10] and the simplified Modification of Diet in Renal Disease (MDRD) equation [11] are the most frequently used in adults. However, the performance of the MDRD equation in diabetic patients has been challenged by several studies [12,13]. More recently, the Chronic Kidney Disease Epidemiology Collaboration (CKD-EPI) equation [14] was developed to reduce bias compared with the MDRD equation, especially among patients with an estimated GFR (eGFR) ≥ 60 mL/min per 1.73 m2. Indeed, the CKD-EPI equation performed better than the MDRD equation when validated in a multi-center sample representing different clinical characteristics in 3896 subjects [14,15]. However, recent reports have not confirmed better performance of the CKD-EPI over the CG and MDRD equations in estimating GFR in diabetic patients [16-18]. There are also limited data regarding the best method to estimate GFR in a Chinese cohort.
Because the GFR is known to be affected by hyperglycemia [19] and because diabetes is often poorly controlled in many patients, the aim of this study is to compare the influence of hyperglycemia to the ability of the GFR estimations of the CG, MDRD and CKD-EPI equations to predict hyperfiltration in Chinese diabetic patients.
Materials and methods
Patients and design
All subjects provided written informed consent, and the study was approved by the ethics committee of Shanghai Jiao Tong University Affiliated Sixth People’s Hospital and complied with the Declaration of Helsinki.
In this cross-sectional study, we used data from diabetic patients who underwent a GFR measurement with 99mTc-DTPA for clinical reasons between June 22, 2005, and May 28, 2012, at the Department of Endocrinology and Metabolism, Shanghai Jiao Tong University Affiliated Sixth People’s Hospital, in Shanghai, China. Patients who had diabetes without a history of non-diabetic renal disease and who had at least one isotopic GFR measurement (measured GFR, mGFR) were eligible for inclusion. Patients with acute kidney function deterioration, edema, skeletal muscle atrophy, pleural effusion or ascites, malnutrition, amputation, heart failure, or ketoacidosis were excluded. Patients who were taking cimetidine or trimethoprim or who were on any type of renal replacement therapy were also excluded.
The collected data included gender, age, body height, body weight, and mGFR. Fasting blood was taken from selected patients to analyze creatinine, urea nitrogen, fasting plasma glucose and HbA1c levels. We also measured the 2-hour postprandial plasma glucose during the same visit.
Definition of hyperfiltration and CKD stages
CKD was diagnosed and classified according to the K/DOQI clinical practice guidelines [20]. Normal values of 99mTc-DTPA were established in 45 healthy individuals 29-80 years of age matched to the study group by age, sex, and BMI. The values of 99mTc-DTPA GFR in the control group ranged from 49.02 to 138.80 mL/min per 1.73 m2, with a mean ± SD of 92.31 ± 18.33 mL/min per 1.73 m2. The GFR values exhibited a Gaussian distribution; thus, the upper limit of normal was defined as 128.97 mL/min per 1.73 m2 (mean + 2SD), and the threshold for hyperfiltration was defined as a GFR of > 128.97 mL/min per 1.73 m2. This method has been described in previous studies [21-23].
GFR measurement
The glomerular filtration rate was measured by the 99mTc-DTPA renal dynamic imaging method using a Siemens e.cam single gamma camera with HDR detector technology, standardized by body surface area.
Other analyses
Serum creatinine levels were measured on a Hitachi 7600 analyzer using Jaffe’s kinetic method, which is described elsewhere [24]. HbA1c was determined by high-performance liquid chromatography using the BioRad Vatiant II analyzer.
Estimations of renal function
Renal function was estimated from serum creatinine by three methods: the CG equation, GFRCG = [140- age (years)] × 0.85 (if patient is female) × 0.84 × weight (kg)/[Scr (mg/dL) × 72] [10]; the abbreviated four-variable MDRD equation, GFRMDRD = 186 × [Scr (mg/dL)]-1.154 × [age (years)]-0.203 × 0.742 (if female) × 0.180 (if patient is black); [25] the CKD-EPI equation, GFREPI = 141 × (Scr/κ)α × (0.993)Age × 1.018 (if patient is female) × 1.159 (if patient is black) [14].
a. κ = 0.7 (female) or 0.9 (male); b. α = -0.329 (female and Scr ≤ 0.7 mg/dL), α = -1.209 (female and Scr > 0.7 mg/dL); c. α = -0.411 (male and Scr ≤ 0.9 mg/dL), α = -1.209 (male and Scr > 0.9 mg/dL).
Statistical analysis
Demographic data are presented as median (interquartile range, IQR) or mean ± standard deviation (SD), depending on whether data were skewed or not. Relationships between mGFR and eGFR were tested using linear regression and Spearman correlation. To compare the performance of the equations, we calculated bias, precision, and accuracy as recommended. Bias was defined as the mean absolute difference between estimated and measured kidney function, whereas precision was expressed as the SD of this difference. Accuracy measures were used to define the best equation because this parameter is a combination of bias and precision. Accuracy was calculated as the percentage of patients who exhibited an estimated kidney function within 15%, 30%, or 50% limits of the measured GFR. Differences in bias and accuracy among the equations were tested with the paired t-test or Chi-square test, respectively.
Bias, precision, and accuracies were compared before and after categorizing the patients according to HbA1c squared [HbA1c < 7.2% (55 mmol/mol), HbA1c 7.2%-8.7% (55-70 mmol/mol), HbA1c 8.7-10.5 (72-90 mmol/mol), HbA1c ≥ 10.5% (91 mmol/mol)]. Furthermore, agreement of the equations with mGFR was evaluated with the Bland-Altman method. The diagnostic value of the three equations for the detection of CKD (mGFR < 60 mL/min per 1.73 m2) and hyperfiltration (mGFR > 128.97 mL/min per 1.73 m2) was compared using the receiver-operating characteristic (ROC) curve method.
Statistical analysis was performed using SPSS statistical software (version 17.0, SPSS, Chicago IL, USA) and MedCalc for Windows (version 4.3, MedCalc Software, Mariakerke, Belgium).
Results
Description of the patient population
There were 3492 patients identified with both a 99mTc-DTPA renal clearance result and serum creatinine available. The characteristics of the study population and control group are summarized in Table 1. The population consisted of four major groups divided by the glomerular filtration rate: hyperfiltration (n = 340), 90 ≤ GFR < 128.97 mL/min per 1.73 m2 (n = 1617), 60 ≤ GFR < 90 mL/min per 1.73 m2 (n = 1214), and GFR < 60 mL/min per 1.73 m2 (n = 321). Significant differences were observed among the GFR groups with respect to age, body mass index (BMI), and serum creatinine and serum urea nitrogen. SBP was significantly higher in the GFR < 60 group compared with the other four groups. However, DBP and the duration of diabetes did not vary significantly among the groups. The proportion of patients taking ARB or ACEI in the GFR < 90 group was significantly higher than in the GFR ≥ 90 group. Significant differences were observed among the control group, hyperfiltration group, 90 ≤ GFR < 128.97 group and the 60 ≤ GFR < 90 group with respect to fasting plasma glucose and 2-h postprandial plasma glucose. HbA1c, the proportion of patients with hypertension and the proportion of patients with microalbuminuria were significantly lower in the control group than in the other four groups; the HbA1c in the GFR < 128.97 group was significantly higher than in the hyperfiltration group. Significant differences were observed among the 90 ≤ GFR < 128.97 group, the 60 ≤ GFR < 90 group and the GFR < 60 group with respect to microalbuminuria. GFR was significantly lower than the mGFR when estimated by the CG equation in the hyperfiltration group but was significantly higher than the mGFR when the GFR was < 128.97. The eGFR calculated by MDRD equation significantly over estimated mGFR when GFR was < 128.97. The eGFR calculated by the CKD-EPI equation significantly over estimated mGFR in all categories.
Table 1.
Description of the patient population
| Characteristic | Control group | Hyperfiltration | 90 ≤ GFR < 128.97 | 60 ≤ GFR < 90 | GFR < 60 |
|---|---|---|---|---|---|
| N (F/M) | 45 (23/22) | 340 (229/111) | 1617 (749/868) | 1214 (496/718) | 321 (111/210) |
| Age (yr) | 55.84±11.49 | 50.13±12.87a | 55.43±11.93b | 63.00±11.211a,b,c | 68.80±11.21a,b,c,d |
| BMI (kg/m2) | 24.16±2.68 | 22.72±3.16a | 24.55±3.34b | 25.39±3.40a,b,c | 26.05±3.74a,b,c,d |
| SBP | 130.27±18.03 | 130.08±16.19 | 131.51±17.09 | 131.15±16.83 | 134.63±18.73a,b,c,d |
| DBP | 81.71±10.84 | 79.61±8.80 | 79.65±9.37 | 79.80±9.69 | 80.25±10.55 |
| Duration of diabetes | 0 | 8.06±6.57 | 8.18±6.71 | 8.47±6.87 | 9.27±8.10 |
| Proportion of patients with hypertension (%) | 28.89 | 48.82a | 47.43a | 47.45a | 47.35a |
| Proportion of patients taking ARB or ACEI (%) | 0 | 15.73 | 18.41 | 34.23b,c | 46.15b,c,d |
| Plasma creatinine (μmol/l) | 70.78±12.52 | 52.49±12.40a | 62.57±13.93a,b | 73.53±18.94b,c | 117.76±83.17a,b,c,d |
| Plasma urea nitrogen (umol/l) | 4.62±1.30 | 5.03±1.45 | 5.38±2.36a,b | 5.82±1.77a,b,c | 8.18±4.09a,b,c,d |
| FPG (mmol/l) | 5.02±0.35 | 9.12±3.08a | 8.51±2.80a,b | 7.98±2.76a,b,c | 7.78±2.81a,b,c |
| 2HPG (mmol/l) | 6.16±1.05 | 14.71±5.04a | 13.89±4.71a,b | 13.79±4.87a,b | 13.31±5.13a,b,c |
| HbA1c (%) | 5.35±0.24 | 9.72±2.40a | 9.09±2.25a,b | 8.93±2.40a,b | 8.84±2.42a,b |
| Microalbuminuria (mg/24 h) | 7.69 (1.17, 4.95) | 10.13 (6.50, 19.99)a | 9.74 (6.06, 2 3.32)a | 11.64 (6.44, 31.08)a,b,c | 40.07 (9.27, 375.85)a,b,c,d |
| mGFR/1.73 m2 | 92.31±18.33 | 140.67±10.19 | 105.83±10.59 | 76.39±8.29 | 48.41±9.29 |
| CG/1.73 m2 | 90.08±18.76 | 124.47±32.25** | 107.63±29.89* | 86.93±26.52** | 59.43±24.60** |
| MDRD/1.73 m2 | 97.93±19.82 | 143.97±38.37 | 113.19±27.13** | 92.69±23.93** | 63.76±25.64** |
| CKD-EPI/1.73 m2 | 103.22±17.89** | 147.00±44.59* | 112.22±27.29** | 92.92±21.23** | 68.50±23.17** |
P < 0.05 versus control group;
P < 0.05 versus hyperfiltration;
P < 0.05 versus 90 ≤ GFR < 128.97;
P < 0.05 versus 60 ≤ GFR < 90;
P < 0.05 versus mGFR per 1.73 m2;
P < 0.01 versus mGFR per 1.73 m2.
Abbreviations: BMI, body mass index; FPG, fasting plasma glucose; 2HPG, 2-hpostprandial plasma glucose; mGFR, measured glomerular filtration rate; CG, the Cockcroft-Gault equation; MDRD, the Modification of Diet in Renal Disease simplified equation; CKD-EPI, the Chronic Kidney Disease Epidemiology Collaboration (CKD-EPI) equation.
Performance of the CG, MDRD, and CKD-EPI equations in estimating GFR among all subjects
Table 2 lists the bias, precision, accuracy, correlation coefficient, regression coefficient, intercept and slope of the regression models of each equation. The bias was the smallest for the CKD-EPI equation (P < 0.01 compared with CG, P = 0.053 compared with MDRD), although it exhibited the worst precision versus both other equations (P < 0.01 compared with CG, P < 0.05 compared with MDRD). The accuracy within ±15% or ±30% of the CKD-EPI equation was significantly higher than that of the CG or MDRD equation, but the accuracy within ±50% of the CKD-EPI equation did not differ significantly from the other two equations. All of the equations were strongly correlated with mGFR, and the correlation coefficient of CKD-EPI was the highest (r = 0.649, P < 0.01 compared with CG).
Table 2.
Performance of the CG, MDRD, and CKD-EPI equations in estimating GFR in all subjects
| Parameter | CG equation | MDRD equation | CKD-EPI equation |
|---|---|---|---|
| Absolute Bias | 21.77 | 20.83a | 20.40a,e |
| Precision | 19.34 | 19.53 | 20.38a,d |
| Accuracy within 15% (%) | 0.363 | 0.372a | 0.490a,b |
| Accuracy within 30% (%) | 0.643 | 0.659a | 0.725a,b |
| Accuracy within 50% (%) | 0.861 | 0.855a | 0.868 |
| R | 0.562 | 0.629a | 0.649a |
| r | 0.547 | 0.633 | 0.623 |
| Intercept (95% CI) | 31.74 (28.28, 35.21) | 27.43 (24.18, 30.68) | 29.64 (26.38, 32.89) |
| Slope (95% CI) | 0.70 (0.67, 0.74) | 0.82 (0.79, 0.86) | 0.80 (0.77, 0.84) |
P < 0.01 versus CG equation;
P < 0.01 versus MDRD equation;
c P < 0.05 versus CG equation;
P < 0.05 versus MDRD equation;
P = 0.053 versus MDRD equation.
Abbreviations: R, correlation coefficient; r, regression coefficient; CG, the Cockcroft-Gault equation; MDRD, the Modification of Diet in Renal Disease simplified equation; CKD-EPI, the Chronic Kidney Disease Epidemiology Collaboration (CKD-EPI) equation.
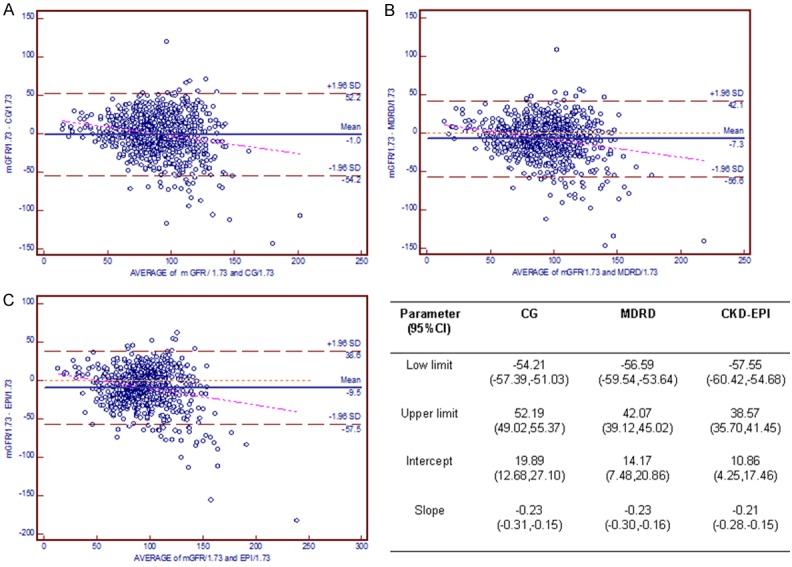
The Bland-Altman plots for the agreement of eGFR and mGFR against the combined mean values are depicted in Figure 1. The limits of agreement for the CG, MDRD, and CKD-EPI equations were -60.5 to 52.6, -62.6 to 41.0, and -63.3 to 41.0 mL/min per 1.73 m2, respectively. The regression line of differences versus averages demonstrates that the CKD-EPI equation was closer to the identical line than were the other equations. For the detection of hyperfiltration, the CDK-EPI equation exhibited the best performance with the greatest combination of sensitivity and specificity (AUC = 0.859, P < 0.01 versus both other equations), but the three equations did not differ from each other with respect to the diagnosis of moderate renal failure (GFR < 60 mL/min per 1.73 m2) (Figure 2).
Figure 1.
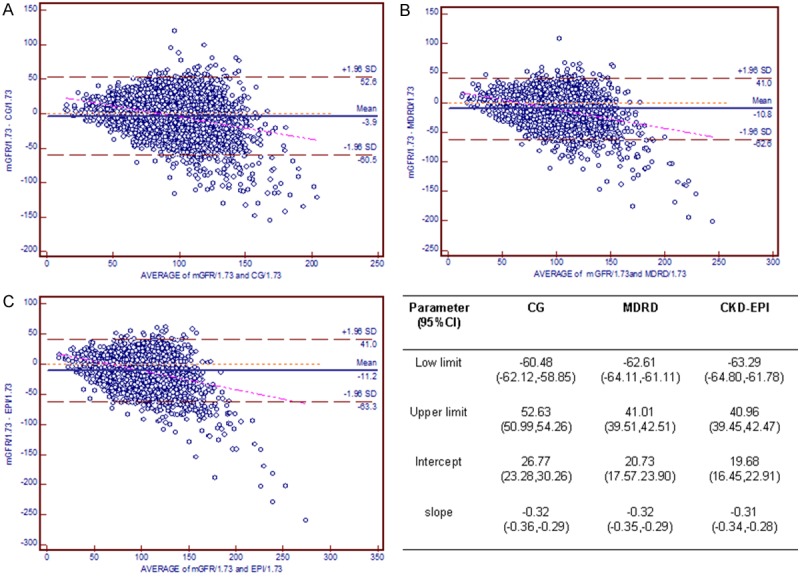
Bland-Altman plot depicting disagreement between estimated GFR and mGFR. The red line indicates the regression line of differences versus averages; A. CG equation; B. MDRD equation; C. CKD-EPI equation. Abbreviations: CG, the Cockcroft-Gault equation; MDRD, the Modification of Diet in Renal Disease simplified equation; CKD-EPI, the Chronic Kidney Disease Epidemiology Collaboration (CKD-EPI) equation.
Figure 2.
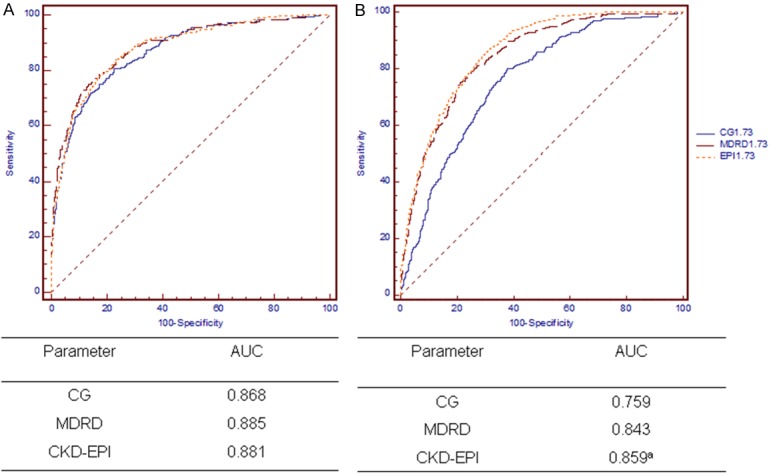
ROC curves in the overall population. Diagnosis of moderate renal failure (GFR < 60 mL/min per 1.73 m2 (A) and hyperfiltration (B). aP < 0.01 versus both equations. Abbreviations: CG, the Cockcroft-Gault equation; MDRD, the Modification of Diet in Renal Disease simplified equation; CKD-EPI, the Chronic Kidney Disease Epidemiology Collaboration (CKD-EPI) equation.
Performance of the equations according to the HbA1c level
Because GFR is known to be affected by hyperglycemia, we analyzed the results according to HbA1c levels. First, we compared the applicability of the three equations at the same HbA1c levels. Table 3 lists the eGFR, bias, precision, accuracy, correlation coefficient, regression coefficient, intercept and slope of the regression models of each equation at different HbA1c levels. The mean 99mTc-DTPA GFR in the HbA1c < 7.2% (55 mmol/mol) cohort was 90.16±24.84, and the mean mGFR was 96.40±27.72 in the HbA1c ≥ 10.5% cohort (91 mmol/mol). In the HbA1c < 7.2% (55 mmol/mol) cohort, the eGFR of the MDRD and the CKD-EPI equations significantly overestimated the mGFR. However, the three equations all significantly overestimated the mGFR in the HbA1c ≥ 10.5% cohort (91 mmol/mol). The bias of the CKD-EPI study equation obtained in the HbA1c < 7.2% (55 mmol/mol) cohort was significantly lower than that obtained by the other two equations (P < 0.05), even though there were no significant differences among the three equations with respect to precision. In the HbA1c ≥ 10.5% cohort (91 mmol/mol), there were no significant differences among the equations with respect to bias. The precision of the CKD-EPI equation was significantly higher than that of the MDRD equation (P < 0.05). In both of the cohorts, the correlation coefficient of mGFR and eGFR was significantly better for the CKD-EPI equation than for the CG equations, but there was no significant difference between the CKD-EPI and MDRD equations. In both cohorts, the accuracy within 15% or 30% was significantly better for the CKD-EPI equation than for the other two equations. In the HbA1c ≥ 10.5% cohort, the CKD-EPI equation also exhibited improved accuracy within 50% compared with the CG and MDRD equations.
Table 3.
Comparison of the classification of patients stratified by of HbA1c using various estimated GFR equations
| Parameter (95% CI) | HbA1c | |||||
|---|---|---|---|---|---|---|
|
| ||||||
| < 7.2% | ≥ 10.5% | |||||
|
| ||||||
| CG | MDRD | CKD-EPI | CG | MDRD | CKD-EPI | |
| eGFR | 91.17±29.60 | 97.42±29.81 | 99.65±29.52 | 103.84±38.15 | 113.11±39.86 | 111.76±40.66 |
| Absolute Bias | 20.53 | 19.00c | 18.97c,d | 24.50 | 25.37 | 24.31 |
| Precision | 17.77 | 18.03 | 18.20 | 22.56 | 23.92 | 25.69d |
| R | 0.514 | 0.588c | 0.635c | 0.569 | 0.634c | 0.647a |
| r | 0.514 | 0.59 | 0.61 | 0.553 | 0.643 | 0.624 |
| Intercept | 35.90 (29.35, 42.46) | 33.71 (27.48, 39.93) | 34.82 (28.75, 40.89) | 30.49 (22.97, 38.01) | 24.02 (16.80, 31.24) | 23.52 (16.00, 31.03) |
| slope | 0.61 (0.54, 0.68) | 0.71 (0.64, 0.77) | 0.72 (0.65, 0.78) | 0.76 (0.69, 0.84) | 0.92 (0.85, 1.00) | 0.92 (0.84, 0.99) |
| Accuracy within 15% | 0.393 | 0.407a | 0.484a,b | 0.337 | 0.317a | 0.474a,b |
| Accuracy within 30% | 0.685 | 0.683c | 0.730c,d | 0.570 | 0.598a | 0.769a,b |
| Accuracy within 50% | 0.888 | 0.887 | 0.887 | 0.814 | 0.790a | 0.930a,b |
P < 0.01 versus CG;
P < 0.01 versus MDRD;
P < 0.05 versus CG;
P < 0.05 versus MDRD.
Abbreviations: R, correlation coefficient; r, regression coefficient; CG, the Cockcroft-Gault equation; MDRD, the Modification of Diet in Renal Disease simplified equation; CKD-EPI, the Chronic Kidney Disease Epidemiology Collaboration (CKD-EPI) equation.
The ability of the three equations to diagnose moderate renal failure and hyperfiltration at different HbA1c levels is presented in Figures 3 and 4. The CKD-EPI equation is significantly better for the detection of hyperfiltration at both HbA1c levels. In the HbA1c ≥ 10.5% subgroup, the MDRD equation exhibited superior performance in diagnosing moderate renal failure compared with the CKD-EPI equation.
Figure 3.
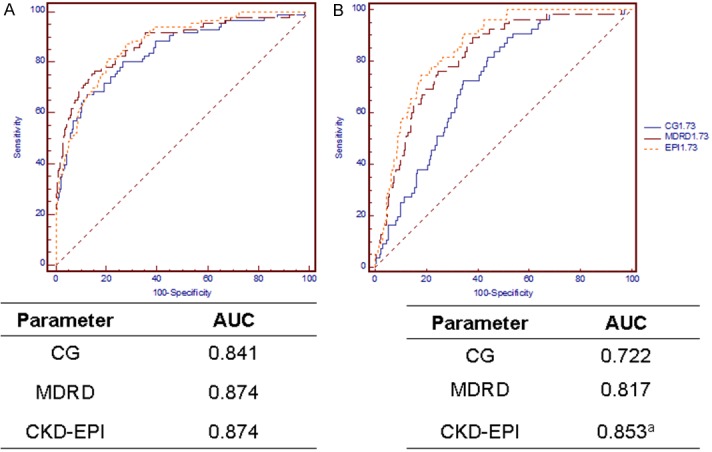
ROC curves in the HbA1c < 7.2% cohort. Diagnosis of moderate renal failure (GFR < 60 mL/min per 1.73 m2, (A) and hyperfiltration (B). aP < 0.01 versus both other equations. Abbreviations: CG, the Cockcroft-Gault equation; MDRD, the Modification of Diet in Renal Disease simplified equation; CKD-EPI, the Chronic Kidney Disease Epidemiology Collaboration (CKD-EPI) equation.
Figure 4.
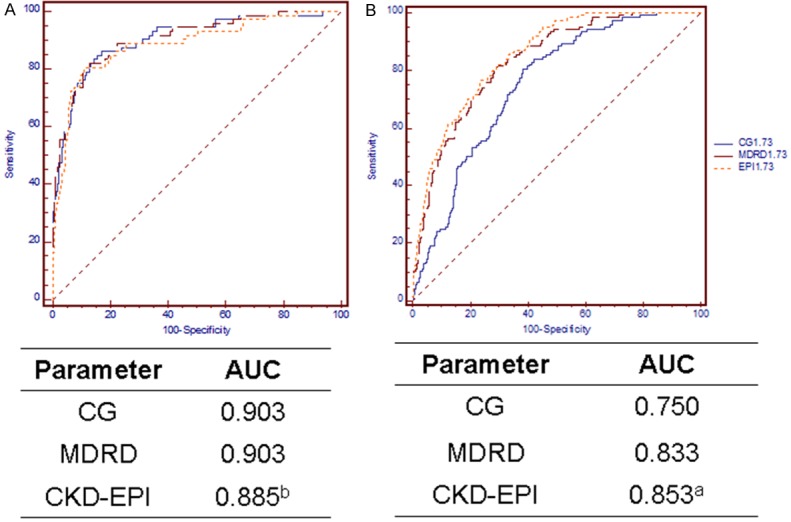
ROC curves in the HbA1c ≥ 10.5% cohort. Diagnosis of moderate renal failure (GFR < 60 mL/min per 1.73 m2, (A) and hyperfiltration (B). aP < 0.05 versus both other equations, bP = 0.04 versus MDRD. Abbreviations: CG, the Cockcroft-Gault equation; MDRD, the Modification of Diet in Renal Disease simplified equation; CKD-EPI, the Chronic Kidney Disease Epidemiology Collaboration (CKD-EPI) equation.
Figure 5 graphically represents agreement between each equation and the Bland-Altman method in the HbA1c < 7.2% cohort. The low limit and upper limit were, respectively, -54.21 and 52.19 for CG, -56.59 and 42.07 for MDRD, and -57.55 and 38.57 for CKD-EPI. The regression line of the CKD-EPI equation was much closer to the line of equality than were those of the other equations. By contrast, for the population with HbA1c ≥ 10.5% (Figure 6), the lower limit and upper limit were -71.09 to 56.22, -76.70 to 43.27, and -77.82 to 47.09, respectively, and the regression line of the CG equation was much closer to the identical line.
Figure 5.
Bland-Altman plot demonstrating the disagreement between estimated GFR and mGFR in the HbA1c < 7.2% cohort. The red line indicates the regression line of differences versus averages; A. CG equation; B. MDRD equation; C. CKD-EPI equation. Abbreviations: CG, the Cockcroft-Gault equation; MDRD, the Modification of Diet in Renal Disease simplified equation; CKD-EPI, the Chronic Kidney Disease Epidemiology Collaboration (CKD-EPI) equation.
Figure 6.
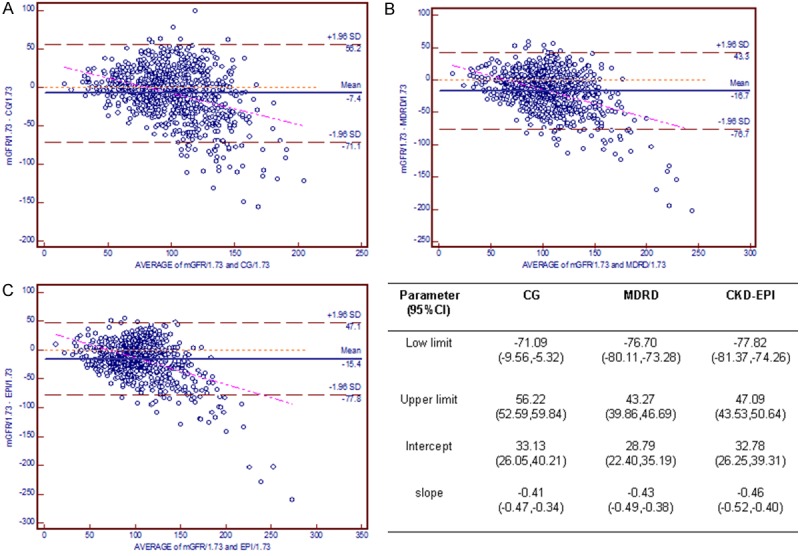
Bland-Altman plot depicting the disagreement between estimated GFR and mGFR in the HbA1c ≥ 10.5% cohort. The red line indicates the regression line of differences versus averages; A. CG equation; B. MDRD equation; C. CKD-EPI equation. Abbreviations: CG, the Cockcroft-Gault equation; MDRD, the Modification of Diet in Renal Disease simplified equation; CKD-EPI, the Chronic Kidney Disease Epidemiology Collaboration (CKD-EPI) equation.
Furthermore, we compared the performance of the same equation at different HbA1c levels. Figure 7 demonstrates that all of the estimations are influenced by the HbA1c level, especially the MDRD equation. The biases of the three equations were significantly higher in the HbA1c ≥ 10.5% (91 mmol/mol) subgroup compared with the HbA1c < 7.2% (55 mmol/mol) cohort (P < 0.01). The Bland-Altman method at various HbA1c levels demonstrated that the limit and regression line of the three equations was much better in the HbA1c < 7.2% (55 mmol/mol) cohort compared with the HbA1c ≥ 10.5% (91 mmol/mol) cohort.
Figure 7.
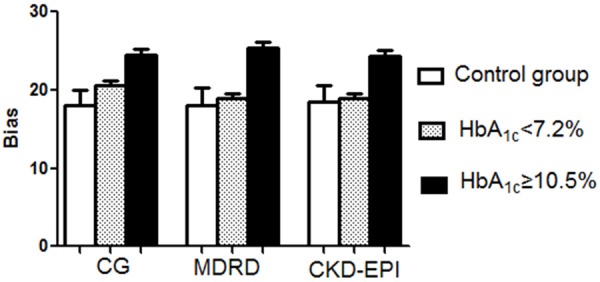
Bias of the CG, MDRD, and CKD-EPI equations in estimating GFR in the control group, HbA1c < 7.2% cohort, and HbA1c ≥ 10.5% cohort. aP < 0.05 versus control and HbA1c < 7.2% cohort. Abbreviations: CG, the Cockcroft-Gault equation; MDRD, the Modification of Diet in Renal Disease simplified equation; CKD-EPI, the Chronic Kidney Disease Epidemiology Collaboration (CKD-EPI) equation.
Discussion
This is the first study to indicate that the CDK-EPI equation exhibits the best performance in detecting hyperfiltration in diabetic patients, although there were no differences among the three equations in identifying patients with moderate renal failure. The highest accuracy within ±15%, and ±30% was also reached with the CKD-EPI equation in both cohorts. However, all of the equations exhibited greater absolute bias in the HbA1c ≥ 10.5% (91 mmol/mol) cohort than in the cohort with HbA1c < 7.2% (55 mmol/mol), especially the MDRD equation.
Our study demonstrated significant advantages in the diagnosis of hyperfiltration and the identification of early renal impairment by CKD-EPI in a large cohort of diabetic patients, which has been reported in previous studies only infrequently [12]. Hyperfiltration is thought to be a maladaptive response to glomerular hemodynamic disturbances that eventually leads to the development of diabetic nephropathy [26,27], which is also a well-characterized phenomenon in the early phase of renal involvement in diabetic nephropathy.
Although the exact incidence of hyperfiltration has not previously been reported, it has been regarded as a putative risk factor in the pathogenesis of clinical nephropathy [2]. The recent study by Magee et al. reported that individuals with type 1 diabetes who exhibit glomerular hyperfiltration or elevated GFR subsequently develop an increased risk of diabetic nephropathy [28]. Hyperfiltration in type 2 diabetes has been associated with a greater rate of decline in GFR over a 6-year period than in normofiltering and non-diabetic control subjects [6]. As the first stage of diabetic nephropathy, hyperfiltration can last as long as 10 years after diagnosis. Therefore, attention should be paid to the early detection and treatment of hyperfiltration. Our study demonstrated that the CKD-EPI equation might be a superior surrogate marker of GFR in patients with hyperfiltration and could be used as a screening tool for early renal impairment in diabetes.
Our data demonstrated that the CKD-EPI equation performance was superior to that of the MDRD equation in our population of diabetic patients. The mean absolute bias was the smallest for CKD-EPI equation in the HbA1c < 7.2% (55 mmol/mol) cohort, and the highest accuracy within ±15%, and ±30% was also reached with the CKD-EPI equation in both cohorts. This result was consistent with most of the previous studies in the general population and in diabetic patients [12,13,29]. However, several authors have reported that the CKD-EPI exhibits worse performance compared with the MDRD or CG equations [16-18]. This discrepancy could be attributed to (1) differences between Caucasian and Asian populations, including the constitution of CKD [30] and the proportions of diabetic patients and type 1 diabetic patients; (2) the influence of the age, BMI, and mGFR of the cohort [29]; (3) the methods of measuring serum creatinine; (4) the influences of gender, muscle mass and analytical interference on serum creatinine; and (5) the distinction between stable patients and progressors in clinical trials [31].
Additionally, in our study, we found that glycemic status could be another factor interfering with the applicability of the equation. In the HbA1c ≥ 10.5% (91 mmol/mol) cohort, the three equations demonstrated more absolute bias than in the HbA1c < 7.2% cohort (55 mmol/mol). In the HbA1c < 7.2% (55 mmol/mol) cohort, the MDRD and CKD-EPI equations significantly overestimated the GFR. However, the three equations all significantly overestimated the GFR in the HbA1c ≥ 10.5% cohort (91 mmol/mol). This was consistent with previous findings. A study in 2012 from Korea on 210 type 2 diabetic patients found that all of the creatinine-based equations were affected by the hyperglycemia [32]. All methods for estimating GFR underestimated mGFR in the HbA1c ≥ 10.8% subgroup. Silveiro SP et al. found that the CKD-EPI and MDRD equations exhibited poor performance in estimating the GFR in individuals with diabetes, especially for high-normal GFRs, with a pronounced underestimation [18]. With respect to the estimation of GFR through predictive equations, this disappointing performance seems to be associated with specific characteristics of the patients with diabetes, such as hyperglycemia, glomerular hyperfiltration, and obesity, which most likely highlights the limitations of creatinine itself as a GFR marker. Hyperglycemia may interfere in GFR calculations in two ways. First, it has long been known that glucose levels above 300 mg/dL may affect the ability of the Jaffe reaction to measure creatinine [33]. Indeed, a previous study has reported that patients with type 2 diabetes exhibit higher serum creatinine levels than healthy individuals, despite similar GFR values [34]. Another possible explanation could be the hyperglycemia-induced glomerular hyperfiltration and the inability of creatinine to mark this typical phenomenon of diabetes [23].
Although all three equations were inaccurate, the applicability of the improved abbreviated MDRD equation was worse when glucose control was poor. This finding is consistent with the study of Oh SJ et al. [32], who reported that the performance of the MDRD equation was worse than that of the CKD-EPI equation, with higher bias, especially for normal GFR. The main reason for this difference may be that the original MDRD cohort did not contain any individuals with diabetic kidney disease, and only few were of nonwhite race or were older than 70 years of age; these differences limit the generalizability of the equation particularly because all three parameters are important risk factors for CKD. Furthermore, the mGFR of our population was higher compared with individuals with CKD, in whom the MDRD equation was developed [29]. Despite the fact that the MDRD equation is reasonably accurate for patients with CKD stage 3 and above, there are some recognized limitations to its use. Most notably, the MDRD equation is not as accurate for higher levels of GFR and tends to overestimate the prevalence of CKD stage 3 in the general population. This underestimation of GFR might affect the performance of MDRD equation in diabetes.
There are several limitations in this study. First, the mGFR measurement method is different from that used by the MDRD Study and the CKD-EPI equation derivation populations. Our study used the 99mTc-DTPA renal dynamic imaging method as a reference method for GFR. Moreover, the mGFR in the MDRD Study and CKD-EPI equation were obtained by renal clearance of 125I-iothalamate. Systemic differences in the eGFR equations derived from the statistical regression model cannot be avoided because two distinct methods were used to obtain the mGFR. Second, due to limited conditions, serum creatinine could not be measured by isotope dilution mass spectrometry.
In conclusion, this study demonstrated that the CKD-EPI equation could be used as a screening tool for hyperfiltration. Furthermore, the CKD-EPI equation exhibited acceptable performance compared with the CG and MDRD equations in Chinese diabetes patients. Therefore, the CKD-EPI equation is more suitable for diabetic patients and exhibited a significant advantage in the diagnosis of early renal impairment in diabetes. However, this study demonstrated that the CG, MDRD and CKD-EPI equation were all influenced by hyperglycemia, especially for the MDRD equation. Although it was the least affected, the original CKD-EPI equation did not include variables for Asian and diabetic patients, so the equation exhibits a large bias in Chinese patients, Therefore, a new term for Chinese diabetic patients should be included in the equation to improve accuracy.
Acknowledgements
This work was supported by the Major State Basic Research Development Program of China (973 program) #2012CB517700, the grants of the National Natural Science Foundation of China #81070649, the Plan for New Hundred People of Shanghai Jiao Tong University, and the EFSD/CDS/Lilly Programme for Collaborative Research between China and Europe to H Chen.
Disclosure of conflict of interest
None.
References
- 1.Parving HH. Renoprotection in diabetes: genetic and non-genetic risk factors and treatment. Diabetologia. 1998;41:745–59. doi: 10.1007/s001250050983. [DOI] [PubMed] [Google Scholar]
- 2.Mogensen CE. Early glomerular hyperfiltration in insulin-dependent diabetics and late nephropathy. Scand J Clin Lab Invest. 1986;46:201–6. doi: 10.3109/00365518609083660. [DOI] [PubMed] [Google Scholar]
- 3.Groop PH, Thomas MC, Moran JL, Wadèn J, Thorn LM, Mäkinen VP, Rosengård-Bärlund M, Saraheimo M, Hietala K, Heikkilä O, Forsblom C FinnDiane Study Group. The presence and severity of chronic kidney disease predicts allcause mortality in type 1 diabetes. Diabetes. 2009;58:1651–8. doi: 10.2337/db08-1543. [DOI] [PMC free article] [PubMed] [Google Scholar]
- 4.Amin R, Turner C, van Aken S, Bahu TK, Watts A, Lindsell DR, Dalton RN, Dunger DB. The relationship between microalbuminuria and glomerular filtration rate in young type 1 diabetic subjects: The Oxford Regional Prospective Study. Kidney Int. 2005;68:1740–9. doi: 10.1111/j.1523-1755.2005.00590.x. [DOI] [PubMed] [Google Scholar]
- 5.Rossing P, Hougaard P, Borch-Johnsen K, Parving HH. Predictors of mortality in insulin dependent diabetes: 10 year observational follow up study. BMJ. 1996;313:779–84. doi: 10.1136/bmj.313.7060.779. [DOI] [PMC free article] [PubMed] [Google Scholar]
- 6.Silveiro SP, Friedman R, de Azevedo MJ, Canani LH, Gross JL. Five-year prospective study of glomerular filtration rate and albumin excretion rate in normofiltering and hyperfiltering normoalbuminuric NIDDM patients. Diabetes Care. 1996;19:171–4. doi: 10.2337/diacare.19.2.171. [DOI] [PubMed] [Google Scholar]
- 7.Vedel P, Obel J, Nielsen FS, Bang LE, Svendsen TL, Pedersen OB, Parving HH. Glomerular hyperfiltration in microalbuminuric NIDDM patients. Diabetologia. 1996;39:1584–9. doi: 10.1007/s001250050618. [DOI] [PubMed] [Google Scholar]
- 8.Caramori ML, Fioretto P, Mauer M. Enhancing the predictive value of urinary albumin for diabetic nephropathy. J Am Soc Nephrol. 2006;17:339–52. doi: 10.1681/ASN.2005101075. [DOI] [PubMed] [Google Scholar]
- 9.Chronic Kidney Disease Prognosis Consortium. Matsushita K, Van der Velde M, Astor BC, Woodward M, Levey AS, de Jong PE, Coresh J, Gansevoort RT. Association of estimated glomerular filtration rate and albuminuria with allcause and cardiovascular mortality in general population cohorts: a collaborative meta-analysis. Lancet. 2010;375:2073–81. doi: 10.1016/S0140-6736(10)60674-5. [DOI] [PMC free article] [PubMed] [Google Scholar]
- 10.Cockcroft DW, Gault MH. Prediction of creatinine clearance from serum creatinine. Nephron. 1976;16:31–41. doi: 10.1159/000180580. [DOI] [PubMed] [Google Scholar]
- 11.Levey AS, Coresh J, Greene T, Stevens LA, Zhang YL, Hendriksen S, Kusek JW, Van Lente F Chronic Kidney Disease Epidemiology Collaboration. Using standardized serum creatinine values in the modification of diet in renal disease study equation for estimating glomerular filtration rate. Ann Intern Med. 2006;145:247–54. doi: 10.7326/0003-4819-145-4-200608150-00004. [DOI] [PubMed] [Google Scholar]
- 12.Vucic Lovrencic M, Radisic Biljak V, Bozicevic S, Prašek M, Pavković P, Knotek M. Estimating glomerular filtration rate (GFR) in diabetes: the performance of MDRD and CKD-EPI equations in patients with various degrees of albuminuria. Clin Biochem. 2012;45:1694–6. doi: 10.1016/j.clinbiochem.2012.07.115. [DOI] [PubMed] [Google Scholar]
- 13.Targher G, Zoppini G, Mantovani W, Chonchol M, Negri C, Stoico V, Mantovani A, De Santi F, Bonora E. Comparison of two creatinine-based estimating equations in predicting all-cause and cardiovascular mortality in patients with type 2 diabetes. Diabetes Care. 2012;35:2347–53. doi: 10.2337/dc12-0259. [DOI] [PMC free article] [PubMed] [Google Scholar]
- 14.Levey AS, Stevens LA, Schmid CH, Zhang YL, Castro AF 3rd, Feldman HI, Kusek JW, Eggers P, Van Lente F, Greene T, Coresh J CKD-EPI (Chronic Kidney Disease Epidemiology Collaboration) A new equation to estimate glomerular filtration rate. Ann Intern Med. 2009;150:604–12. doi: 10.7326/0003-4819-150-9-200905050-00006. [DOI] [PMC free article] [PubMed] [Google Scholar]
- 15.Stevens LA, Schmid CH, Zhang YL, Coresh J, Manzi J, Landis R, Bakoush O, Contreras G, Genuth S, Klintmalm GB, Poggio E, Rossing P, Rule AD, Weir MR, Kusek J, Greene T, Levey AS. Development and validation of GFR-estimating equations using diabetes, transplant and weight. Nephrol Dial Transplant. 2010;25:449–57. doi: 10.1093/ndt/gfp510. [DOI] [PMC free article] [PubMed] [Google Scholar]
- 16.Drion I, Joosten H, Santing L, Logtenberg SJ, Groenier KH, Lieverse AG, Kleefstra N, Bilo HJ. The Cockcroft-Gault: a better predictor of renal function in an overweight and obese diabetic population. Obes Facts. 2011;4:393–9. doi: 10.1159/000333399. [DOI] [PMC free article] [PubMed] [Google Scholar]
- 17.Rognant N, Lemoine S, Laville M, Hadj-Aïssa A, Dubourg L. Performance of the chronic kidney disease epidemiology collaboration equation to estimate glomerular filtration rate in diabetic patients. Diabetes Care. 2011;34:1320–2. doi: 10.2337/dc11-0203. [DOI] [PMC free article] [PubMed] [Google Scholar]
- 18.Silveiro SP, Araujo GN, Ferreira MN, Souza FD, Yamaguchi HM, Camargo EG. Chronic Kidney Disease Epidemiology Collaboration (CKD-EPI) equation pronouncedly underestimates glomerular filtration rate in type 2 diabetes. Diabetes Care. 2011;34:2353–5. doi: 10.2337/dc11-1282. [DOI] [PMC free article] [PubMed] [Google Scholar]
- 19.Christensen PK, Lund S, Parving HH. The impact of glycaemic control on autoregulation of glomerular filtration rate in patients with noninsulin dependent diabetes. Scand J Clin Lab Invest. 2001;61:43–50. doi: 10.1080/00365510151067965. [DOI] [PubMed] [Google Scholar]
- 20.National Kidney Foundation. K/DOQI clinical practice guidelines for chronic kidney disease: evaluation, classification, and stratification. Am J Kidney Dis. 2002;39(Suppl 1):S1–266. [PubMed] [Google Scholar]
- 21.Premaratne E, Macisaac RJ, Tsalamandris C, Panagiotopoulos S, Smith T, Jerums G. Renal hyperfiltration in type 2 diabetes: effect of agerelated decline in glomerular filtration rate. Diabetologia. 2005;48:2486–93. doi: 10.1007/s00125-005-0002-9. [DOI] [PubMed] [Google Scholar]
- 22.Chaiken RL, Eckert-Norton M, Bard M, Banerji MA, Palmisano J, Sachimechi I, Lebovitz HE. Hyperfiltration in African-American patients with type 2 diabetes - Cross-sectional and longitudinal data. Diabetes Care. 1998;21:2129–34. doi: 10.2337/diacare.21.12.2129. [DOI] [PubMed] [Google Scholar]
- 23.Silveiro SP, Friedman R, Gross JL. Glomerular hyperfiltration in NIDDM patients without overt proteinuria. Diabetes Care. 1993;16:115–9. doi: 10.2337/diacare.16.1.115. [DOI] [PubMed] [Google Scholar]
- 24.Zuo L, Ma YC, Zhou YH, Wang M, Xu GB, Wang HY. Application of GFR-estimating equations in Chinese patients with chronic kidney disease. Am J Kidney Dis. 2005;45:463–72. doi: 10.1053/j.ajkd.2004.11.012. [DOI] [PubMed] [Google Scholar]
- 25.Levey AS, Greene T, Kusek JW, et al. A simplified equation to predict glomerular filtration rate from serum creatinine. J Am Soc Nephrol. 2000;11:155A–A. [Google Scholar]
- 26.Hostetter TH. Diabetic nephropathy. Metabolic versus hemodynamic considerations. Diabetes Care. 1992;15:1205–15. doi: 10.2337/diacare.15.9.1205. [DOI] [PubMed] [Google Scholar]
- 27.Brenner BM, Lawler EV, Mackenzie HS. The hyperfiltration theory: a paradigm shift in nephrology. Kidney Int. 1996;49:1774–7. doi: 10.1038/ki.1996.265. [DOI] [PubMed] [Google Scholar]
- 28.Magee GM, Bilous RW, Cardwell CR, Hunter SJ, Kee F, Fogarty DG. Is hyperfiltration associated with the future risk of developing diabetic nephropathy? A meta-analysis. Diabetologia. 2009;52:691–7. doi: 10.1007/s00125-009-1268-0. [DOI] [PubMed] [Google Scholar]
- 29.Michels WM, Grootendorst DC, Verduijn M, Elliott EG, Dekker FW, Krediet RT. Performance of the Cockcroft-Gault, MDRD, and new CKDEPI formulas in relation to GFR, age, and body size. Clin J Am Soc Nephrol. 2010;5:1003–9. doi: 10.2215/CJN.06870909. [DOI] [PMC free article] [PubMed] [Google Scholar]
- 30.Murata K, Baumann NA, Saenger AK, Larson TS, Rule AD, Lieske JC. Relative performance of the MDRD and CKD-EPI equations for estimating glomerular filtration rate among patients with varied clinical presentations. Clin J Am Soc Nephrol. 2011;6:1963–72. doi: 10.2215/CJN.02300311. [DOI] [PMC free article] [PubMed] [Google Scholar]
- 31.Tent H, Waanders F, Krikken JA, Heerspink HJ, Stevens LA, Laverman GD, Navis G. Performance of MDRD study and CKD-EPI equations for long-term follow-up of nondiabetic patients with chronic kidney disease. Nephrol Dial Transplant. 2012;27(Suppl 3):iii89–95. doi: 10.1093/ndt/gfr235. [DOI] [PubMed] [Google Scholar]
- 32.Oh SJ, Lee JI, Ha WC, Jeong SH, Yim HW, Son HS, Sohn TS. Comparison of cystatin C- and creatinine-based estimation of glomerular filtration rate according to glycaemic status in Type 2 diabetes. Diabet Med. 2012;29:e121–5. doi: 10.1111/j.1464-5491.2012.03628.x. [DOI] [PubMed] [Google Scholar]
- 33.Husdan H, Rapoport A. Estimation of creatinine by the Jaffe reaction. A comparison of three methods. Clin Chem. 1968;14:222–38. [PubMed] [Google Scholar]
- 34.Camargo EG, Soares AA, Detanico AB, Weinert LS, Veronese FV, Gomes EC, Silveiro SP. The Chronic Kidney Disease Epidemiology Collaboration (CKD-EPI) equation is less accurate in patients with Type 2 diabetes when compared with healthy individuals. Diabet Med. 2011;28:90–5. doi: 10.1111/j.1464-5491.2010.03161.x. [DOI] [PubMed] [Google Scholar]