

Abstract
Objectives: This work aims to investigate the expression of miRNA-186 in patients with colorectal cancer tissues, blood and feces and its roles in regulating the infiltration and invasion in colorectal cancer. Methods: Totally 39 patients with surgical resection were included from August 2012 to February 2015 in Jilin Province People’s Hospital as the Colorectal Neuroendocrine tumor (CNET). Peripheral blood, stool, and resected tumor tissues with adjacent normal of each patient was collected. In the same period, the blood and stool from 25 patients with hemorrhoids or other non-neoplastic diseases were collected and these samples used as clinical control group. MiR-186 expression and PTTG1 (pituitary tumor-transforming 1) expression were detected by quantitative Real-Time PCR (qRT-PCR). The PTTG1 protein expression in tumor samples were detected by Western Blot, while its expression in blood and stool were detected by Elisa. Results: Compared with the control group, the expression of PTTG1 mRNA and protein was significantly up-regulated in tumor samples, blood, and stool of patients with CNET, while the expression of miR-186 was down-regulated (P < 0.05). Conclusion: PTTG1 expression was significantly up-regulated in patients with CNET, which was induced by the down-regulated miR-186. MiR-186 may participate in the regulation of infiltration and invasion in CNET patients through targeting PTTG1 expression.
Keywords: miRNA-186, colorectal neuroendocrine tumor, CNET, PTTG1
Introduction
Gastroenteropancreatic Neuroendocrine tumors (GEP-NETs) are mainly located in the gastrointestinal mucosa and submucosa, which originate from gastrointestinal and pancreatic neuroendocrine cells that can secrete a variety of hormones. In recent years, the morbidity of GEP-NETs increased year by year in the world, which has become the second largest common gastrointestinal tumors [1]. Based on the primary sites, neuroendocrine tumors can be divided into foregut (thymus, esophagus, lung, stomach, pancreas, duodenum), the intestine (ileum, appendix, cecum, ascending colon), and hindgut (far end of the large intestine and rectum). In alimentary system, the top three parts that easily prone to neuroendocrine tumors are the ileum, colon, and rectum [2]. Among them, the Colorectal Neuroendocrine tumor (CNET) is difficult to diagnosis in early stage because of its inertia, no typical clinical symptoms, and lack of specificity. Most patients are diagnosed when surgery for other diseases, and more than 75% of patients have occurred liver metastasis when were diagnosed. The best time will be lost for treatment. It is urgently necessary to identify biomarkers of clinical stage, treatment and prognosis in neuroendocrine tumors [3,4].
The development and progression of CNET is caused by the interaction of different pathways, in which many mRNA and miRNA is involved. It was found that the expression of many miRNA were significantly different in CNET compared with colon adenocarcinoma [5]. Neurotensin can promote the proliferation of neuroendocrine tumors [6]. PTTG1 (pituitary tumor-transforming 1) in our study was firstly cloned by Pei et al. as an oncogene in late 1990s, which can promote occurrence, growth, and metastasis of tumor cells. PTTG1 have five exons and 4 introns that located on chromosome 5q33. Without the collaboration of auxiliary genes, the encoded product of PTTG1 can activate a variety of cancer-related genes and pathways to induce tumor occurrence and development [7]. PTTG1 has been reported to be up-regulated in several endocrine-related tumors, especially pituitary, thyroid, breast, ovary and uterus cancer as well as some non-endocrine-related tumors, such as nervous system, respiratory system and digestive system tumors [8-14]. PTTG1 are closely related to colorectal cancer, and several papers mentioned that PTTG1 participated in the development and metastasis of colorectal cancer [15]. Actually in CNET, the regulated roles of PTTG1 is few reported until now.
In this study, qRT-PCR, Western Blot, bioinformatics prediction and Elisa was applied to detect the mRNA and protein expression of PTTG1 in tumor tissue, stool and blood of CNET patients. The relationship between PTTG1 and miR-186 was predicted and validated in this study, which help to explore the mechanism of how miR-186 regulates the CNET through targeting PTTG1.
Materials and methods
Clinical data of patients
This study included 39 patients with CNET admitted in Jilin Province People’s Hospital from August 2012 to February 2015. Among them, there were 18 males and 21 females with age from 27 to 65 years old (the median age of patients was 46 years old). For the control group, 25 patients with hemorrhoids, volvulus and other non-neoplastic diseases from same period were used. Among this group, there were 15 males and 10 females with age from 25-72 years old, and the median age was 51. All the patients were first onset, and no hormone, traditional Chinese medicine (TCM), radiotherapy and chemotherapy treated before surgery. According to clinical grading standard of CNET, there were 5 patients with carcinoids, 11 patients with gland carcinoid, 9 patients with adenocarcinoma, 8 patients with small cell carcinoma, and 6 patients with large cell neuroendocrine carcinoma. All the clinical information was given by pathological professors in Jilin Province People’s Hospital.
The specimen of each patients was included three parts: excision of tumor tissues with adjacent normal, stored in liquid nitrogen; peripheral blood by fasting collecting in morning, stored in -20°C with EDTA anticoagulant; and stools before 2-3 days for surgery, stored in -80°C after collection less than 2 hours. All the stools were collected before drug treatment or enema. Prior written and informed consent were obtained from every patient and the study was approved by the ethics review board of Jilin Province People’s Hospital.
Stool RNA extraction and reverse transcription
Total RNA in stool specimens were extracted based on the following procedure. After thawing and grinding, the specimens were washed by PBS, then centrifuged at 100 rpm for 5 min. The sediment was added into 1 ml Trizol (Invitrogen, California, USA) for 5 min in room temperature, then transferred to 0.2 ml chloroform. The re-suspended was centrifuged at 12000 rpm for 15 min in 4°C after violent oscillation. The upper aqueous phase was removed to another EP tube and added with 0.5 ml isopropanol, mixed well and placed in 10 min. Centrifugation at 12000 rpm for 15 min in 4°C was applied to discard the supernatant. And 1 ml 75% cold ethanol-DEPC was used to wash the sediment by centrifugation at 12000 rpm for 10 min in 4°C. After discarding the supernatant, the ethanol was volatilized to get the RNA. Total RNA was added with 40 ul DEPC-processed water and stored in -80°C. Total RNA from tumor tissues and peripheral blood were also extracted by Trizol method. The purity of RNA was detected by Spectrophotometer 260/280. The cDNA was synthesized from total RNA by the reverse transcription with TIANScriptⅡcDNA kit (Tiangen, Beijing, CHINA).
Protein isolation in stools
After collecting and precision weighing, each 0.19 g fresh stool was dissolved by 0.4 ml RIPA lysate and oscillated until no visible fecal particles. The yellow suspension was lysed for 60 min with ice bath, then centrifuged at 10000 rpm for 30 min in 4°C. The supernatant was centrifuged at same condition as above, then stored in -70°C. The UV irradiation was required before and after all the above operation. The proteins in tumor samples were extracted by the similar methods.
Fluorescence quantitative real-time PCR (qRT-PCR)
The SYBR Green qRT-PCR of Super Real Pre Mix (Tiangen, Beijing, CHINA) was used to detect the expression of PTTG1 in different specimen. Theβ-actin was used as internal reference. The primers for PTTG1 were 5’-TGATCCTTG ACG AGGGAG-3’ and 5’-GGTGGCAATTCAACATCCAGG-3’. The primers for β-actin were 5’-CCTCGCCTTTGCCGATCC-3’ and 5’-GGATCTTCATGAGGTAGTCAGTC-3’. The cycle conditions were the following: 95°C for 5 min, and followed by 25 cycles at 95°C for 45 s, 60°C for 45 s, 72°C for 30s. The relative expression was calculated by the 2-ΔΔT method. And the relative expression was calculated by the ratio of PTTG1/β-actin.
Western blot analysis
Total proteins were isolated from specimen by the standard protocol of protein lysate and the protein concentration were detected using the BCA assay Kit. After boiled 5 min, each 20 g isolated proteins was separated by 10% SDS-PAGE and then transferred to PVDF membrane. The primary antibody was rabbit anti-human PTTG1 (ZSGB-BIO, Beijing, China, 1:1000) and rabbit anti-human β-actin antibody (Abcam, Massachusetts, USA, 1:5000). The secondary antibody was HRP-conjugated goat anti-rabbit IgG (Abcam, Massachusetts, USA, 1:3000). Finally, the membrane was developed by enhanced chemiluminescence (ECM) plus reagent. The image lab 3.0 software was applied to analyze the image and intensity of the bands.
Elisa
The peripheral blood was centrifuged at 3000 rpm for 10 min to separate serum and red blood cells. The serum and the protein lysate of stool were used as samples to do Elisa according to Elisa Kit (Bangyi Biotechnology, Shanghai, Chian). Each 50 ul standard samples of different concentration were added into different wells on the Elisa plate, and 10 ul sample was added into each well (40 ul diluted sample was added into different well too). Except for blank well, each well was added by 100 ul HRP labeled antibody and covered with microplate sealers, then incubated 1 h. After washed 5 times, 50 ul substrate A and 50 ul substrate B were added into each well. After incubated in 37°C for 15 min, 50 ul stop solution was added into each well. The OD value was measured at a wavelength of 450 nm within 15 min.
Bioinformatics prediction
To infer which miRNA directly regulates PTTG1 to play important roles in the progression of CNET, we applied bioinformatics algorithms to predict candidate miRNAs that can directly complementary binding to 3’UTR of PTTG1. Combined with the miRanda, TargetScan, PicTar, MiRanda and BibiServ software, we predicted miR-186 was one of the miRNAs that directly regulating PTTG1. The 3’UTR of PTTG1 mRNA and the target site of miR-186 was shown in Figure 1. It was reported that miR-186 participated in the invasion and metastasis of human non-small cell lung cancer through regulating PTTG1 [16]. Finally we selected miR-186 for further study in CNET.
Figure 1.

The sequence of 3’UTR in PTTG1 mRNA and binding site of miR-186.
MiRNA qRT-PCR
Total miRNAs were isolated from tumor samples, peripheral bloods, and stools based on the manufacture’s protocol of miRcute miRNA Isolation kit (Tiangen, Beijing, China). The cDNA was reverse transcript by miRcute miRNA cDNA kit (Tiangen, Beijing, China). The miR-186 was detected by the miRNA luciferase quantitative kit(Tiangen, Beijing, China). The U6 was used as internal reference. The primers for miR-186 was 5’-CCCGATAAAGCTAGATAACC-3’ and 5’-CAGTGCGTGTCGTGGAGT-3’. The primers for U6 were 5’-GCTTCGGCAGCACATATACTAAAAT-3’ and 5’-CAGTGCGTGTCGTGGAGT-3’. The cycle conditions were the following: 95°C for 5 min, and followed by 40 cycles at 95°C for 10 s, 60°C for 20 s, 72°C for 20 s. The relative expression was calculated by the 2-ΔΔT method. And the relative expression was calculated by the ratio of miR-186/U6.
Statistics analysis
All the data were shown as the mean ± SD, and difference were determined by two-tailed Student’s t-test of SPSS. For comparison in multiple groups, one-way ANOVA was applied. The LSD and SNK methods were used when homogeneity of variance, while Tamhane’s T2 or Dunnett’s T3 method was considered when heteroskedasticity. P < 0.05 was considered as statistically significant, and P < 0.01 was regarded as strong significant.
Results
The expression of PTTG1 mRNA in different samples
To detect the change of PTTG1 mRNA among different samples, qRT-PCR was applied. As shown in Figure 2, PTTG1 mRNA was up-regulated in CNET tumor tissues (Figure 2A), blood (Figure 2B) and stools (Figure 2C), compared with adjacent normal, normal blood and stools from non-tumor patients respectively (P < 0.05). The results indicated that PTTG1 might play regulatory roles in CNET.
Figure 2.

The expression of PTTG1 mRNA in CNET tissues, blood and stools by qRT-PCR. A. PTTG1 mRNA was increased in CNET tissues compared with control tissues by qRT-PCR (P < 0.01). B. PTTG1 mRNA was increased in CNET blood compared with control blood by qRT-PCR (P < 0.05). C. PTTG1 mRNA was increased in CNET stools compared with control stools by qRT-PCR (P < 0.01).
The expression of PTTG1 protein in tumor samples
To examine the expression of PTTG1 protein in CNET tumor tissues, Western Blot was performed. Compared with adjacent control, PTTG1 protein expression in CNET was significantly up-regulated in CNET tissues (P < 0.05), as shown in Figure 3. The results showed that the increase of PTTG1 protein was consistent with mRNA level, which indicated that over-expression of PTTG1 played regulatory roles in CNET.
Figure 3.

The expression of PTTG1 protein in CNET tissues by western blot. A. Western blot to detect the expression of PTTG1 protein in CNET tissues. B. The expression of PTTG1 protein was increased by western blot.Compared with control tissues, *P< 0.05. C. The expression of PTTG1 protein in CNET tissue and associated control tissue for another 10 patients.
The expression of PTTG1 protein in blood and stool
To examine PTTG1 protein in peripheral blood and stool of CNET patients, Elisa assay was performed. Compared with associated controls, PTTG1 protein expression in blood and stool of CNET was significantly increased (P < 0.05), as shown in Figure 4. The results showed that the increase of PTTG1 protein was consistent with mRNA level not only in tumor samples, but in blood and stools. Because blood is a common channel for tumor metastasis, increased PTTG1 protein in blood indicated that PTTG1 might influenced the metastasis of CNET. The up-regulation of PTTG1 in feces might be resulted by the high expression of PTTG1 from shedding tumor cells.
Figure 4.
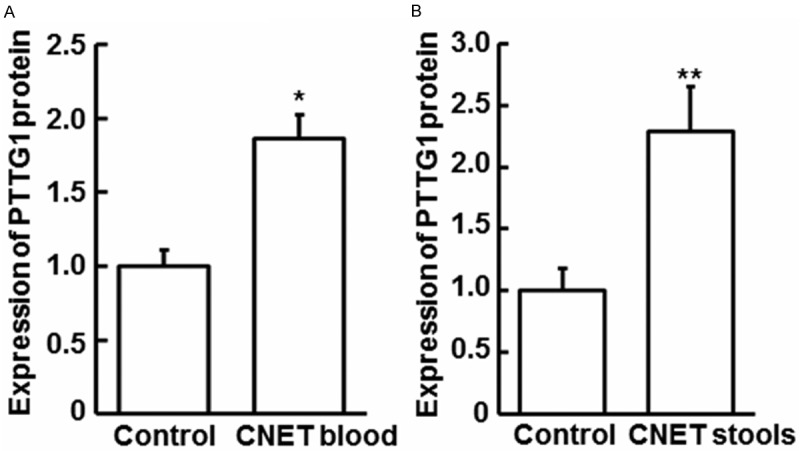
The expression of PTTG1 protein in CNET blood and stools by Elisa assay. A. The expression of PTTG1 protein was increased in CNET blood compared with control blood by Elisa assay (P < 0.05). B. Elisa assay to detect the expression of PTTG1 protein was increased in CNET stools compared with control stoolsby Elisa assay (P < 0.01).
MiR-186 expression in different samples
To detect miR-186 expression among different samples, qRT-PCR was performed. Compared with control group, miR-186 was significantly down-regulated in CNET patients (P < 0.05), shown in Figure 5A-C. Combined with the bioinformatics prediction that miR-186 directly regulating PTTG1, it can be inferred that miR-186 played important roles in pathological processes of CNET. MiR-186 exerted its function through regulating PTTG1 mRNA then inducing the PTTG1 protein expression.
Figure 5.

The expression of miR-186 inCNET tissues, blood and stools by qRT-PCR. A. MiR-186 mRNA was decreased in CNET tissues compared with control tissues by qRT-PCR (P < 0.05). B. MiR-186 mRNA was decreased in CNET blood compared with control blood by qRT-PCR (P < 0.01). C. MiR-186 mRNA was decreased in CNET stools compared with control stools by qRT-PCR (P < 0.01).
Discussion
In this study, we observed PTTG1 expression from mRNA level and protein level in tumor tissues, stools, and blood of CNET patients. The expression of miR-186 was also explored in all types of specimens. We discussed the mechanisms of how miR-186 influenced CNET through regulating PTTG1.
CNET is a common cancer in digestive system, which is classified by WHO in 2010 into 3 grades [17]: Grade I, neuro endocrine tumor (NETGl), Grade II, neuroendocrine carcinoma (NEC), and Grade III, mixed adno endocrine carcinoma (MANEC) [18]. Tumors in Grade I have relatively well differentiated, while tumors in Grade II and Grade III have become a malignant tumors with strong migration capability and lethality. However, there is no perfect methods to screen CNET and no clear mechanisms of carcinogenesis. It will be valuable to identify the biomarkers for early diagnosis of CNET.
The main prevention strategy for CNET is screening tumor in vulnerable populations. In addition to the currently used tools like intestinal peep, the hot spot is screening populations in non-invasive manner. As the particular site, colorectum, the commonly used non-invasive screening includes gene test in blood, as well as fecal genetic test. Gene test in feces has prominent advantages: no aggressive or only minor invasive, no special preparation, test site involving the entire gastrointestinal tract. It was reported by Japanese scholars that the expression of COX-2 mRNA had high sensitivity and specificity in diagnosis of colorectal cancer [19]. In this study, we also used both blood and stool samples to find out more reliable biomarkers.
Furthermore, we investigated PTTG1, a neuroendocrine-related factors in colorectal cancer. PTTG1 was highly expressed not only in pituitary tumor cells, but also in normal tissue cells with high proliferative activity: such as the thymus, testis and other tissues. In most of normal adult tissues as colon, brain, liver, pancreas, kidney, ovary, and peripheral blood leukocytes, PTTG1 was weakly expressed even undetectable, while it was highly expressed in tumor cell lines [20-25]. Heaney et al found that highly expressed PTTG1 was associated with the infiltration of surrounding lymph nodes [26]. It was shown that PTTG1 expression was positively correlated with expression of VEGF protein [27]. Ishikawa, et al. found that high expression of PTTG1 was related to the invasion and angiogenesis of colorectal cancer and ovarian cancer through mediating bFGF [28]. Solbach found that overexpressed PTTG1 mRNA in tumors was associated with lymph node invasion and tumor recurrence, and confirmed that PTTG1 expression was invasion biomarker in early stage of breast cancer [9]. Other studies validated that PTTG1 was abnormally over-expressed in tumor, which was related to the staging and metastasis of tumor. In this study, we found that PTTG1 was significantly up-regulated in tumor tissues of CNET patients, which was consistent with our expectation. As to the mechanisms of PTTG1 in tumor, our results indicated that PTTG1 may play as an oncogene that regulate the proliferation, infiltration and invasion of CNET. We also found that PTTG1 was highly expressed in blood and stool of CNET patients. In blood, the up-regulation of PTTG1 may play a “transporter” roles in CNET is metastasis, which is another important way besides of local infiltration. The over-expression of PTTG1 in blood and stool indicated that it may be regarded as a potential candidate of CNET biomarker.
For further studying the mechanisms of PTTG1, we applied bioinformatics methods to predict the up-stream genes of PTTG1. We found that miRNA, one class of endogenous and small non-coding RNA, might degrade PTTG1 mRNA to repress translation [29]. Through degradation to up or down regulate mRNA level, miRNAs played important roles in tumorigenesis [30,31]. Based on prediction, we found that miR-186 might be an upstream regulator to interact with PTTG1. Combined with other publications, we noticed that miR-186 was involved in the invasion and metastasis of human non-small cell lung cancer through regulating PTTG1 [16]. As to the roles of miR-186 in cancers, it is shown that miR-186 may be a novel target of prevention, diagnosis, and treatment in cancers. Zhang, et al. demonstrated that miR-186 was used as diagnosis predictors of pancreatic cancer, and also affected tumor cell proliferation and invasion [32]. Lee, et al. showed that over-expression of miR-186 was highly related to the proliferation recession of human lung fibroblasts [33]. Sun, et al. found that miR-186 can control the formation of tumor-associated fibroblasts [34]. Cui, et al. indicated that miR-186 can repress the proliferation and metastasis of NSCLC cells through targeting Rock1 [35].
The results in our study showed that miR-186 was down-regulated in tumor tissue, blood, and stool of CNET patients, which indicated that miR-186 was related to the proliferation, infiltration and metastasis of CNET. The down-regulation of miR-186 will decrease the degradation of target mRNAs, then influence the translation of target genes, which promotes cell tumorigenesis. Considering the expression of PTTG1 mRNA and protein we detected in CNET, the over-expression of PTTG1 may be caused by the down-regulation of miR-186. The development and progression of CNET may be induced by the broken balance between the expression of miR-186 and PTTG1 expression.
In this study, we included feces sample of CNET patients besides of tumor tissue and blood. As the position located in colorectum, the detection of miR-186 and PTTG1 in feces, from non-invasive samples, had relative high sensitivity and specificity. The easier collection character determines the application prospect in clinic which can be a good auxiliary besides of blood test, the intestine endoscopic, and PET-CT in diagnosis of CNET [36]. We need to find more direct evidences about how miR-186 regulate CNET through target PTTG1, which can help us to understand the roles of miR-186 in the development and progression of tumor. The findings in this study can provide theoretical basis for the tumor prevention, diagnosis, and treatment.
Acknowledgements
This work was supported by Science and Technology Department of Jilin Province-based research projects grant (No. 201015225).
Disclosure of conflict of interest
None.
References
- 1.Yao JC, Hassan M, Phan A, Dagohoy C, Leary C, Mares JE, Abdalla EK, Fleming JB, Vauthey JN, Rashid A, Evans DB. One hundred years after “carcinoid”: epidemiology of and prognostic factors for neuroendocrine tumors in 35,825 cases in the United States. J. Clin. Oncol. 2008;26:3063–3072. doi: 10.1200/JCO.2007.15.4377. [DOI] [PubMed] [Google Scholar]
- 2.Bernick PE, Klimstra DS, Shia J, Minsky B, Saltz L, Shi W, Thaler H, Guillem J, Paty P, Cohen AM, Wong WD. Neuroendocrine carcinomas of the colon and rectum. Dis Colon Rectum. 2004;47:163–169. doi: 10.1007/s10350-003-0038-1. [DOI] [PubMed] [Google Scholar]
- 3.Ning L, Chen H, Kunnimalaiyaan M. Focal adhesion kinase, a downstream mediator of Raf-1 signaling, suppresses cellular adhesion, migration, and neuroendocrine markers in BON carcinoid cells. Mol Cancer Res. 2010;8:775–782. doi: 10.1158/1541-7786.MCR-09-0525. [DOI] [PMC free article] [PubMed] [Google Scholar]
- 4.Greenblatt DY, Kunnimalaiyaan M, Chen H. Raf-1 activation in gastrointestinal carcinoid cells decreases tumor cell adhesion. Am J Surg. 2007;193:331–335. doi: 10.1016/j.amjsurg.2006.09.016. discussion 335. [DOI] [PMC free article] [PubMed] [Google Scholar]
- 5.Hamfjord J, Stangeland AM, Hughes T, Skrede ML, Tveit KM, Ikdahl T, Kure EH. Differential expression of miRNAs in colorectal cancer: comparison of paired tumor tissue and adjacent normal mucosa using high-throughput sequencing. PLoS One. 2012;7:e34150. doi: 10.1371/journal.pone.0034150. [DOI] [PMC free article] [PubMed] [Google Scholar]
- 6.Kim JT, Liu C, Zaytseva YY, Weiss HL, Townsend CM Jr, Evers BM. Neurotensin, a novel target of Wnt/beta-catenin pathway, promotes growth of neuroendocrine tumor cells. Int J Cancer. 2015;136:1475–1481. doi: 10.1002/ijc.29123. [DOI] [PMC free article] [PubMed] [Google Scholar]
- 7.Cai SQ, Dou TT, Li W, Li SQ, Chen JQ, Zhou J, Zheng M, Man XY. Involvement of pituitary tumor transforming gene 1 in psoriasis, seborrheic keratosis, and skin tumors. Discov Med. 2014;18:289–299. [PubMed] [Google Scholar]
- 8.Heaney AP, Nelson V, Fernando M, Horwitz G. Transforming events in thyroid tumorigenesis and their association with follicular lesions. J Clin Endocrinol Metab. 2001;86:5025–5032. doi: 10.1210/jcem.86.10.7886. [DOI] [PubMed] [Google Scholar]
- 9.Solbach C, Roller M, Fellbaum C, Nicoletti M, Kaufmann M. PTTG mRNA expression in primary breast cancer: a prognostic marker for lymph node invasion and tumor recurrence. Breast. 2004;13:80–81. doi: 10.1016/j.breast.2003.09.008. [DOI] [PubMed] [Google Scholar]
- 10.Puri R, Tousson A, Chen L, Kakar SS. Molecular cloning of pituitary tumor transforming gene 1 from ovarian tumors and its expression in tumors. Cancer Lett. 2001;163:131–139. doi: 10.1016/s0304-3835(00)00688-1. [DOI] [PubMed] [Google Scholar]
- 11.Tsai SJ, Lin SJ, Cheng YM, Chen HM, Wing LY. Expression and functional analysis of pituitary tumor transforming gene-1 [corrected] in uterine leiomyomas. J Clin Endocrinol Metab. 2005;90:3715–3723. doi: 10.1210/jc.2004-2303. [DOI] [PubMed] [Google Scholar]
- 12.Sanchez-Ortiga R, Sanchez Tejada L, Peiro Cabrera G, Moreno-Perez O, Arias Mendoza N, Aranda Lopez FI, Pico Alfonso A. Rol of pituitary tumour-transforming gene (PTTG) in the pituitary adenomas. Endocrinol Nutr. 2010;57:28–34. doi: 10.1016/S1575-0922(10)70006-1. [DOI] [PubMed] [Google Scholar]
- 13.Chamaon K, Kirches E, Kanakis D, Braeuninger S, Dietzmann K, Mawrin C. Regulation of the pituitary tumor transforming gene by insulin-like-growth factor-I and insulin differs between malignant and non-neoplastic astrocytes. Biochem Biophys Res Commun. 2005;331:86–92. doi: 10.1016/j.bbrc.2005.03.124. [DOI] [PubMed] [Google Scholar]
- 14.Kakar SS, Malik MT. Suppression of lung cancer with siRNA targeting PTTG. Int J Oncol. 2006;29:387–395. [PubMed] [Google Scholar]
- 15.Zhou C, Tong Y, Wawrowsky K, Melmed S. PTTG acts as a STAT3 target gene for colorectal cancer cell growth and motility. Oncogene. 2014;33:851–861. doi: 10.1038/onc.2013.16. [DOI] [PMC free article] [PubMed] [Google Scholar]
- 16.Li H, Yin C, Zhang B, Sun Y, Shi L, Liu N, Liang S, Lu S, Liu Y, Zhang J, Li F, Li W, Liu F, Sun L, Qi Y. PTTG1 promotes migration and invasion of human non-small cell lung cancer cells and is modulated by miR-186. Carcinogenesis. 2013;34:2145–2155. doi: 10.1093/carcin/bgt158. [DOI] [PubMed] [Google Scholar]
- 17.Bosman FT, Carneiro F, Hruban RH, Theise ND. WHO classification of tumours of the digestive system. World Health Organization. 2010 [Google Scholar]
- 18.Fingar DC, Salama S, Tsou C, Harlow E, Blenis J. Mammalian cell size is controlled by mTOR and its downstream targets S6K1 and 4EBP1/eIF4E. Genes Dev. 2002;16:1472–1487. doi: 10.1101/gad.995802. [DOI] [PMC free article] [PubMed] [Google Scholar]
- 19.Kanaoka S, Yoshida K, Miura N, Sugimura H, Kajimura M. Potential usefulness of detecting cyclooxygenase 2 messenger RNA in feces for colorectal cancer screening. Gastroenterology. 2004;127:422–427. doi: 10.1053/j.gastro.2004.05.022. [DOI] [PubMed] [Google Scholar]
- 20.Dominguez A, Ramos-Morales F, Romero F, Rios RM, Dreyfus F, Tortolero M, Pintor-Toro JA. hpttg, a human homologue of rat pttg, is overexpressed in hematopoietic neoplasms. Evidence for a transcriptional activation function of hPTTG. Oncogene. 1998;17:2187–2193. doi: 10.1038/sj.onc.1202140. [DOI] [PubMed] [Google Scholar]
- 21.Zhang X, Horwitz GA, Prezant TR, Valentini A, Nakashima M, Bronstein MD, Melmed S. Structure, expression, and function of human pituitary tumor-transforming gene (PTTG) Mol Endocrinol. 1999;13:156–166. doi: 10.1210/mend.13.1.0225. [DOI] [PubMed] [Google Scholar]
- 22.Kakar SS. Molecular cloning, genomic organization, and identification of the promoter for the human pituitary tumor transforming gene (PTTG) Gene. 1999;240:317–324. doi: 10.1016/s0378-1119(99)00446-1. [DOI] [PubMed] [Google Scholar]
- 23.Zhang X, Horwitz GA, Heaney AP, Nakashima M, Prezant TR, Bronstein MD, Melmed S. Pituitary tumor transforming gene (PTTG) expression in pituitary adenomas. J Clin Endocrinol Metab. 1999;84:761–767. doi: 10.1210/jcem.84.2.5432. [DOI] [PubMed] [Google Scholar]
- 24.Saez C, Japon MA, Ramos-Morales F, Romero F, Segura DI, Tortolero M, Pintor-Toro JA. hpttg is over-expressed in pituitary adenomas and other primary epithelial neoplasias. Oncogene. 1999;18:5473–5476. doi: 10.1038/sj.onc.1202914. [DOI] [PubMed] [Google Scholar]
- 25.Xu MD, Dong L, Qi P, Weng WW, Shen XH, Ni SJ, Huang D, Tan C, Sheng WQ, Zhou XY, Du X. Pituitary tumor-transforming gene-1 serves as an independent prognostic biomarker for gastric cancer. Gastric Cancer. 2016;19:107–15. doi: 10.1007/s10120-015-0459-2. [DOI] [PubMed] [Google Scholar]
- 26.Heaney AP, Singson R, McCabe CJ, Nelson V, Nakashima M, Melmed S. Expression of pituitary-tumour transforming gene in colorectal tumours. Lancet. 2000;355:716–719. doi: 10.1016/S0140-6736(99)10238-1. [DOI] [PubMed] [Google Scholar]
- 27.Hunter JA, Skelly RH, Aylwin SJ, Geddes JF, Evanson J, Besser GM, Monson JP, Burrin JM. The relationship between pituitary tumour transforming gene (PTTG) expression and in vitro hormone and vascular endothelial growth factor (VEGF) secretion from human pituitary adenomas. Eur J Endocrinol. 2003;148:203–211. doi: 10.1530/eje.0.1480203. [DOI] [PubMed] [Google Scholar]
- 28.Ishikawa H, Heaney AP, Yu R, Horwitz GA, Melmed S. Human pituitary tumor-transforming gene induces angiogenesis. J Clin Endocrinol Metab. 2001;86:867–874. doi: 10.1210/jcem.86.2.7184. [DOI] [PubMed] [Google Scholar]
- 29.Zhao X, Mohan R, Ozcan S, Tang X. MicroRNA-30d induces insulin transcription factor MafA and insulin production by targeting mitogen-activated protein 4 kinase 4 (MAP4K4) in pancreatic beta-cells. J Biol Chem. 2012;287:31155–31164. doi: 10.1074/jbc.M112.362632. [DOI] [PMC free article] [PubMed] [Google Scholar]
- 30.Chen K, Rajewsky N. The evolution of gene regulation by transcription factors and microRNAs. Nat Rev Genet. 2007;8:93–103. doi: 10.1038/nrg1990. [DOI] [PubMed] [Google Scholar]
- 31.Lewis BP, Burge CB, Bartel DP. Conserved seed pairing, often flanked by adenosines, indicates that thousands of human genes are microRNA targets. Cell. 2005;120:15–20. doi: 10.1016/j.cell.2004.12.035. [DOI] [PubMed] [Google Scholar]
- 32.Zhang ZL, Bai ZH, Wang XB, Bai L, Miao F, Pei HH. miR-186 and 326 predict the prognosis of pancreatic ductal adenocarcinoma and affect the proliferation and migration of cancer cells. PLoS One. 2015;10:e0118814. doi: 10.1371/journal.pone.0118814. [DOI] [PMC free article] [PubMed] [Google Scholar]
- 33.Lee YH, Kim SY, Bae YS. Upregulation of miR-760 and miR-186 is associated with replicative senescence in human lung fibroblast cells. Mol Cells. 2014;37:620–627. doi: 10.14348/molcells.2014.0157. [DOI] [PMC free article] [PubMed] [Google Scholar]
- 34.Sun P, Hu JW, Xiong WJ, Mi J. miR-186 regulates glycolysis through Glut1 during the formation of cancer-associated fibroblasts. Asian Pac J Cancer Prev. 2014;15:4245–4250. doi: 10.7314/apjcp.2014.15.10.4245. [DOI] [PubMed] [Google Scholar]
- 35.Cui G, Cui M, Li Y, Liang Y, Li W, Guo H, Zhao S. MiR-186 targets ROCK1 to suppress the growth and metastasis of NSCLC cells. Tumour Biol. 2014;35:8933–8937. doi: 10.1007/s13277-014-2168-6. [DOI] [PubMed] [Google Scholar]
- 36.Pickhardt PJ, Choi JR, Hwang I, Butler JA, Puckett ML, Hildebrandt HA, Wong RK, Nugent PA, Mysliwiec PA, Schindler WR. Computed tomographic virtual colonoscopy to screen for colorectal neoplasia in asymptomatic adults. N Engl J Med. 2003;349:2191–2200. doi: 10.1056/NEJMoa031618. [DOI] [PubMed] [Google Scholar]