Abstract
Monosodium glutamate (MSG) is a major flavor enhancer used as a food additive. The present study investigates the effects of different doses of MSG on the morphometric and histological changes of the thyroid gland. 28 male albino rats were used. The rats were divided into four groups: group I control, group II, III and IV treated with MSG (0.25 g/kg, 3 g/kg, 6 g/kg daily for one month) respectively. The thyroid glands were dissected out and prepared for light and electron microscopic examination. Light microscopic examination of thyroid gland of group II revealed increase in follicular epithelial height. Groups III & IV showed decrease in the follicular diameter and irregularity in the shape of some follicles with discontinuity of basement membrane. Follicular hyperplasia was detected in some follicles with appearance of multiple pyknotic nuclei in follicular and interfollicular cells and multiple exfoliated cells in the colloid. In addition, areas of loss of follicular pattern were appeared in group IV. Immunohistochemical examination of BCL2 immunoexpression of the thyroid glands of groups III & IV reveals weak positive reaction in the follicular cells cytoplasm. Ultrathin sections examination of groups III & IV revealed follicular cells with irregular hyperchromatic nuclei, marked dilatation of rER and increased lysosomes with areas of short or lost apical microvilli. In addition, vacuolation of mitochondria was detected in group IV. The results displayed that MSG even at low doses is capable of producing alterations in the body weights and thyroid tissue function and histology.
Keywords: Monosodium glutamate, thyroid gland, histological study
Introduction
Monosodium L-glutamate (MSG) is a common glutamic acid salt. It has 78% glutamic acid, 22% sodium salt and water [1]. Glutamate is one of the greatest public amino acids present in wildlife. It is the core constituent of tissue proteins and peptides. There are two main sources of glutamate; the first is the body itself can form glutamate as it plays a critical role in human metabolism; the second is the protein-rich food products as fish, meat, milk and cheese or vegetable origins as mushroom and tomato [2].
MSG is one the commonest food additive. It has been used as taste enhancer since 1907 by a Japanese professor [3]. It has been used in different concentration according to the type of nutrients [4]. Nowadays, the harmless concentration of MSG in diets and its toxicity in human is still a debatable matter [5].
MSG is commonly used as a flavor enhancer in home as well as in food industry. Therefore, most of canned and fast food as flavored chips, canned soups, prepared meals, marinated meats, bottled soy or oriental sauces, freezing foods and tested tuna containing variable concentrations of MSG [6].
In animals, higher doses of MSG were confirmed to be neurotoxic as it destructs neurons in the hypothalamic nuclei through their changes in the hypothalamo-pituitary-adrenal axis (HPA) [7-10]. Moreover, the excessive MSG administration may lead to damage of liver and kidney [11]. These findings denote that unbound glutamate dissociated from MSG may possibly act on certain receptors in the central or peripheral neurons, causing histopathological changes [12].
Unfortunately, literatures investigating the effect of MSG on the morphology and function of thyroid gland are very controversial. Some authors reported non-significant changes in thyroid morphology after long period of MSG treatment in neonatal rats [13]. On the other side, a picture of a typical hypothyroidism was reported by other authors in mice treated with different doses of MSG for one week and the changes are seen only after a period of 13 and 52 weeks of the treatment [14]. On the other hand, a picture of increased thyroid activity was reported in adult rats received MSG (4 mg/g body weight) for one week and the effect was observed one month after the last dose [15].
Recently, MSG phobia had increased due to the opposing reactions and harmfulness of MSG, with few and limited literature concerning the structural changes in thyroid gland of animals treated with MSG. So this study was designed to examine the effects of different doses of monosodium glutamate on the morphometric, histological and functional changes of the thyroid gland of adult.
Materials and methods
Drug
Monosodium glutamate was obtained from Sigma chemical Co (USA) and it was liquefied in distilled water.
Animals
This study was performed on twenty eight adult male albino rats weighting about 200 g. The Animals were obtained from Mansoura Experimental Research Center (MERC), and were used in agreement with the Animal Welfare Act and Guide for Care Use of MERC. The rats were housed in separate metal cages under constant environmental conditions. Food and water were available ad libitum.
Experimental design
The rats were divided into four groups (n=7 for each group). They were classified into:
Group (I): (control group) rats received distilled water (vehicle) for one month.
Group (II): Rats received MSG solutions at concentrations of 0.25 g/kg body weight, daily, by gavages for one month.
Group (III): Rats received MSG solutions at concentrations of 3 g/kg body weight, daily, by gavages for one month.
Group (IV): Rats received MSG solutions at concentrations of 6 g/kg body weight, daily, by gavages for one month.
The chosen doses were built on the harmfulness levels described by previous studies [16,17]; 0.25 g/kg body weight (non-toxic dose of MSG), 3 and 6 g/kg body weight (slightly toxic and highly toxic doses, respectively) (the doses were divided and given twice/day to avoid the rat’s stomach injury from the single excess administration of MSG).
On the next day after the final dose, rats were anesthetized with ether. Blood samples were obtained and the thyroid glands were dissected out (supported by the tracheas).
Body weight
The body weight of each animal was assessed before and at the end of treatments.
Assessment of serum T3 and T4 [18]
Blood sample was obtained through a cardiac puncture of each rat, centrifuged and the sera were used to determine T3 and T4 levels.
Light microscopic (LM) dtudy
he right lobes of the thyroid glands were fixed immediately in Bouin’s fluid for 24 hours, dehydrated in ascending grades of ethyl alcohol, cleared in xylene, impregnated and embedded in paraffin. Serial sections, 5 micrometer in thickness, were cut, mounted on slides in groups of 10 sections each. The slides of the central third of the thyroid lobe were used and stained with:-
-Haematoxylin and eosin stain (H&E) [19].
-Periodic Acid Schiff (PAS) reaction [20].
-Immunohistochemical staining for detection of Bcl2 protein (antiapoptotic indicator) [21].
Immunohistochemical reaction was performed using avidin biotin peroxidase technique. The primary antibody was a mouse monoclonal antibody (Genemed Biotechnologics Inc., South San Francisco, CA 94080, USA).
Tissue sections were dewaxed and rehydrated. Slides were incubated in hydrogen peroxide (10%) for 10-15 min to inhibit the activity of endogenous peroxidase and to reduce nonspecific background staining. Antigen recovery was done by immersing the sections in a preheated citrate buffer solution (pH 6) and maintaining heat in a microwave for 45 min. Sections were left to cool at room temperature. Then slides were washed in buffer (0.05% sodium azide) for 2 times. Monoclonal anti Bcl-2 (clone Bcl-2-100) was applied. Slides were washed in buffer (0.05% sodium azide) for 4 times. Biotinylated goat anti-polyvalent was applied. Slides were incubated for 10 min at room temperature. Slides were washed in buffer (0.05% sodium azide) for 4 times. Chromogenic substrate was applied (diaminobenzidine) DAB and incubated until desired reaction was achieved. Mayer’s haematoxylin was used as a counter stain [22,23].
The Bcl2 cytoplasmic site of reaction was stained brown. For the negative control sections the primary antibody was omitted and replaced by phosphate buffer saline. Tonsil was used as positive control tissue [24].
Electron microscopic (EM) study
The left lobes of the thyroid glands of all groups were obtained, fixed in glutaraldehyde (2.5%) and post fixed in osmium tetroxide (1.0%).
Semithin sections (1 um thickness) were prepared and stained with Toluidine blue. Ultrathin sections (80 nm thickness) were obtained and stained with uranyl acetate and lead citrate [25].
Morphometric study
Haematoxylin and eosin stained sections were used for the measurement of follicular diameter and follicular epithelial height. This was performed in 5 non overlapping fields from 5 different sections of 5 different rats in each group at × 100 (for follicular diameter) and × 400 (for epithelial height).
Immune stained-slides for each group were used for the measurement of area % of immunoexpression of Bcl2. This was performed in 5 non overlapping fields from 5 different sections of 5 different rats in each group at × 400.
Statistical analysis
Student’s-t test was used to test the significance of difference between the weight at the beginning of the experiment and at the end in each group.
Student’s-t test was used in statistical analysis of the serum T3, T4 values and the morphometric study to test the significance of difference between the treated groups (II, III & IV) and the control one.
Results
Histological results: control group
Haematoxylin and eosin stained sections of thyroid glands from the control group revealed a C. T. capsule covering the gland. The follicles were variable in size and epithelial lining; the peripheral ones were larger in size and delimited with flat or low cubical epithelium whereas, the central follicles had a smaller diameter and lined by single layer of cubical epithelium with rounded nuclei. The follicular lumen was filled with an acidophilic colloid (Figure 1).
Figure 1.
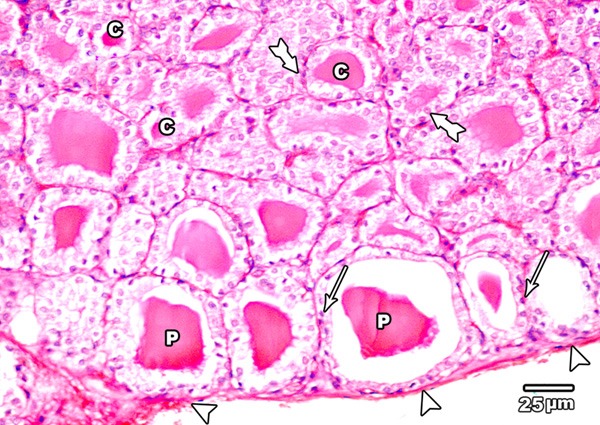
A section in the thyroid gland of adult control rat showing a C.T. capsule covering the thyroid (arrow head). The thyroid follicles showing large peripheral follicles (P) lined with flat or low cubical epithelium (arrow) and small central ones (C) lined with cubical epithelium (tailed arrow) (H&E × 400).
Periodic acid Schiff (PAS) reaction of the thyroid glands from control group exhibited the magenta coloured colloid in the follicular lumina and the basement membrane surrounding the follicles. The colloid of the peripheral follicles revealed few marginal vacuoles (Figure 2).
Figure 2.
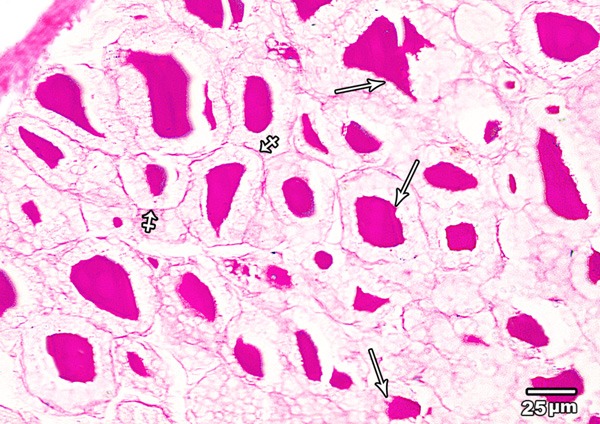
A section in the thyroid gland of adult control rat showing PAS-positive colloid with few marginal vacuoles (arrow). PAS positive basement membrane (crossed arrow) is seen surrounding the follicles (PAS × 400).
Immunohistochemical examination of BCL2 immunoexpression of the thyroid glands of the control group revealed a dark brown color in the cytoplasm and nuclei of the majority of follicular cells (Figure 3).
Figure 3.
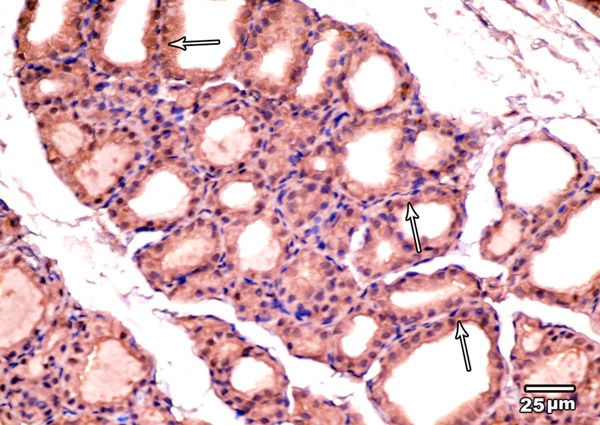
A photomicrograph of the thyroid gland of the control group showing strong BCL2 immunoexpression in the cytoplasm and nuclei of the majority of follicular cells (arrows) (BCL2 immunoexpression × 400).
Electron microscopic examination of the thyroid gland of control group showed the cubical follicular lining cells with almost rounded euchromatic nuclei. The basal lamina of the cells was surrounded by a network of blood capillaries. The apical part of the cells revealed numerous microvilli that project into the central colloid. The cytoplasm exhibited numerous cisternae of rER, mitochondria with moderate electron dense matrix and few lysosomes appeared in the apical part of the follicular cells (Figure 4).
Figure 4.
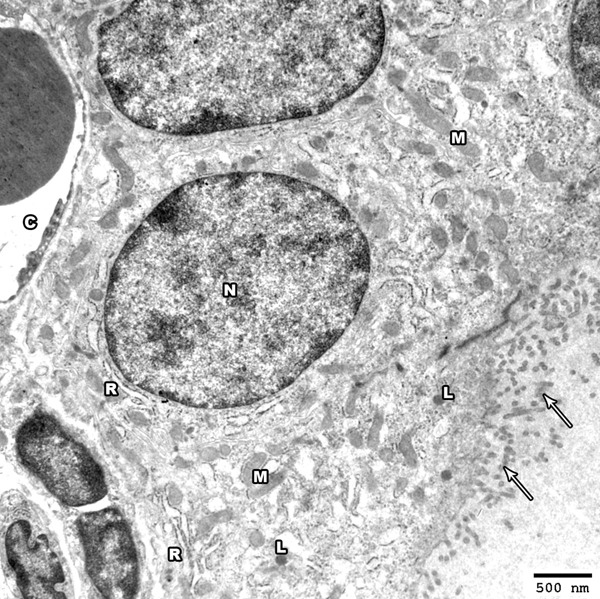
Electron photomicrograph of the thyroid gland of adult control rat showing part of a thyroid follicle. The follicular cells have euchromatic nuclei (N). The apical surface exhibits numerous microvilli projecting into the colloid (arrows); the cytoplasm shows cisternae of rough endoplasmic reticulum (R) and mitochondria (M). Electron dense lysosomes are present mainly at the apical part of the follicular cells (L). A blood capillary (C) is seen under the basal lamina (Uranyl acetate and lead citrate × 2500).
Low dose MSG treated group
Haematoxylin and eosin stained sections of the thyroid glands of low dose MSG treated group revealed no obvious changes regarding follicular shape or diameter. On the other side, increase in follicular epithelial height was detected; the peripheral follicles were delimited by cubical epithelial cells with rounded central nuclei and the central ones were lined by columnar epithelium. Most of follicular cell nuclei were vesicular apart from few pyknotic ones (Figure 5).
Figure 5.
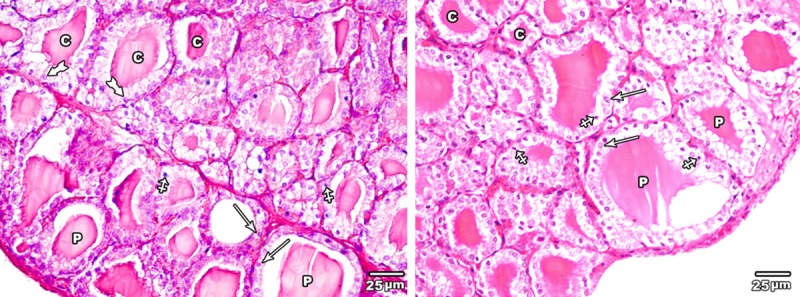
A section in the thyroid gland of adult rat treated with low dose of MSG (group II) the thyroid follicles showing large peripheral follicles (P) lined with cubical epithelium with central rounded nuclei (arrow) and central ones (C) lined with columnar epithelium with basal nuclei (tailed arrow). Note few pyknotic nuclei (crossed arrow) were seen (H&E × 400).
PAS reaction of the thyroid glands of low dose MSG treated group showed a similar reaction to that of group I. In addition, increased marginal vacuoles in the colloid especially in the peripheral follicles were observed (Figure 6).
Figure 6.
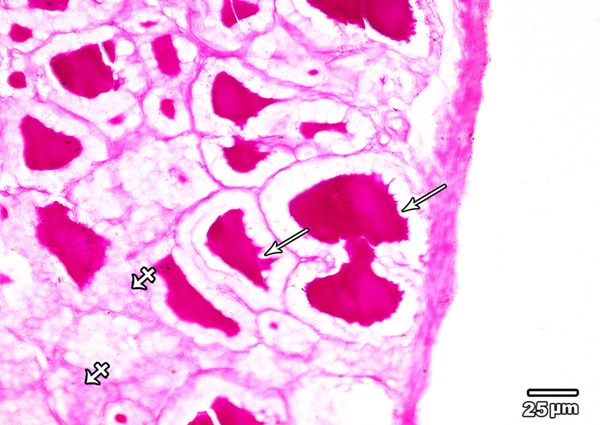
A section in the thyroid gland of adult rat treated with low dose of MSG (group II) showing PAS positive reaction appears in the cytoplasm of follicular cell (crossed arrow). PAS positive colloid with increased marginal vacuolation is seen (arrows) (PAS × 400).
Immunohistochemical examination of BCL2 immunoexpression of the thyroid glands of low dose MSG treated group showed a reaction similarity to control group (Figure 7).
Figure 7.
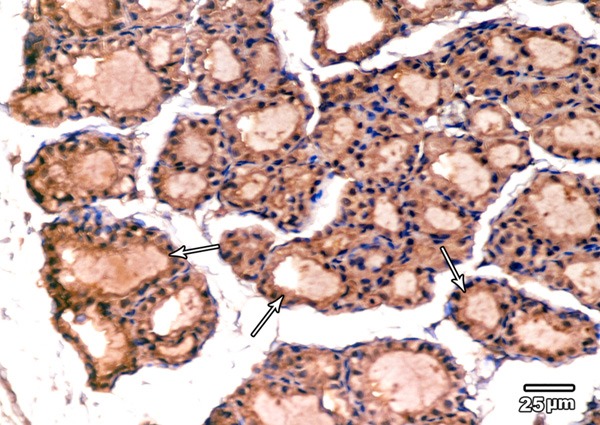
A section in the thyroid gland of adult rat treated with low dose of MSG (group II) showing strong BCL2 immunoexpression in the cytoplasm and nuclei of the majority of follicular cells (arrows) (BCL2 immunoexpression × 400).
Electron microscopic examination of the thyroid glands showed a similar ultra-structure to that of group I with slight dilatation of the rER cisternae. Few nuclei are irregular with wide nuclear pores and peripheral chromatin condensation. Areas with partial loss of the apical microvilli can be detected (Figure 8).
Figure 8.
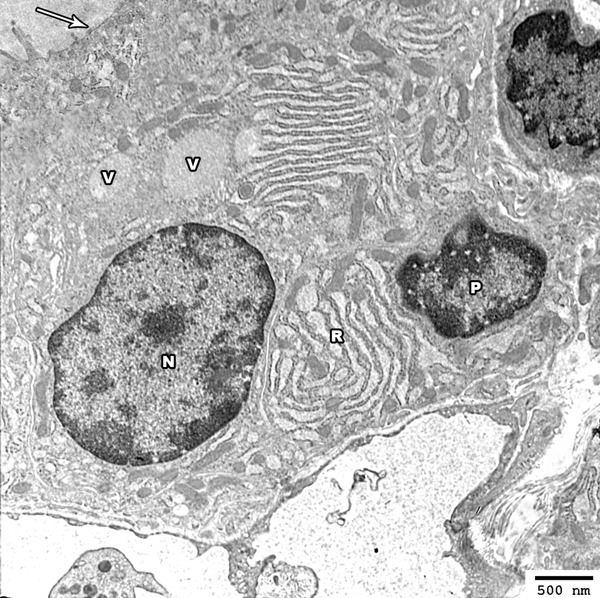
Electron photomicrograph of the thyroid gland of adult rat treated with low dose of MSG (group II) showing columnar follicular cell with oval euchromatic nucleus (N) and other cell showing irregular nuclei (P) with increased condensation of its peripheral chromatin and widening of its nuclear pores. The cytoplasm of the follicular cells revealed mild dilated rER cisternea (R) and colloidal vesicles (V) are also seen above the nucleus. The apical border revealed partial loss of the projecting microvilli (arrow) (Uranyl acetate and lead citrate × 2500).
Low toxic dose MSG treated group
H&E stained sections of the thyroid glands of low toxic dose MSG treated group (group III) revealed decrease in the follicular diameter and irregularity in the shape of some thyroid follicles with discontinuity of their basement membrane. Follicular hyperplasia was detected in some thyroid follicles. The follicular epithelium was increased in height with appearance of multiple pyknotic nuclei in both follicular lining epithelial and interfollicular cells. The central colloid contained multiple exfoliated cells (Figure 9).
Figure 9.
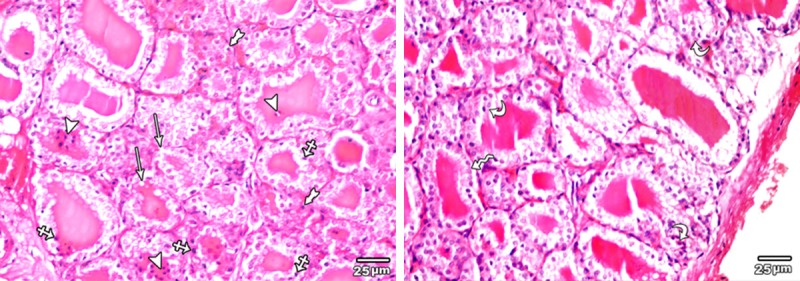
A section in the thyroid gland of adult rat treated with low toxic dose of MSG (group III) showing some irregular thyroid follicles with discontinuity of their basement membrane (arrow), other with columnar epithelial lining (zigzag arrow). Multiple pyknotic nuclei are seen in both follicular lining epithelial (crossed arrow) and interfollicular cells (tailed arrow). The central colloid contained multiple exfoliated cells (arrow head).Note, the presence of hyperplasia of the lining epithelium of follicular cells (curved arrow) (H&E × 400).
PAS reaction of the thyroid glands of low toxic dose MSG treated group (group III) revealed decrease in the amount of magenta coloured colloid with increased marginal vacuolation. In addition, completely empty follicles from colloid were seen. Positive PAS reaction is also observed in the cytoplasm of follicular cells (Figure 10).
Figure 10.
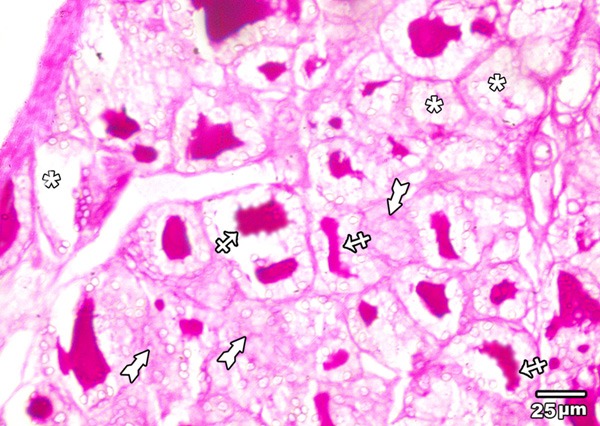
A section in the thyroid gland of adult rat treated with low toxic dose of MSG (group III) showing reduced amount of PAS positive colloid with increased marginal vacuolation (crossed arrows), completely empty follicles from colloid (asterisks) are also seen. Positive PAS reaction is also observed in the cytoplasm of follicular cells (tailed arrow) (PAS × 400).
Immunohistochemical examination of BCL2 immunoexpression of the thyroid glands of low toxic dose MSG treated group revealed weak positive reaction (moderate brown color) in the cytoplasm of the majority of follicular cells (Figure 11).
Figure 11.
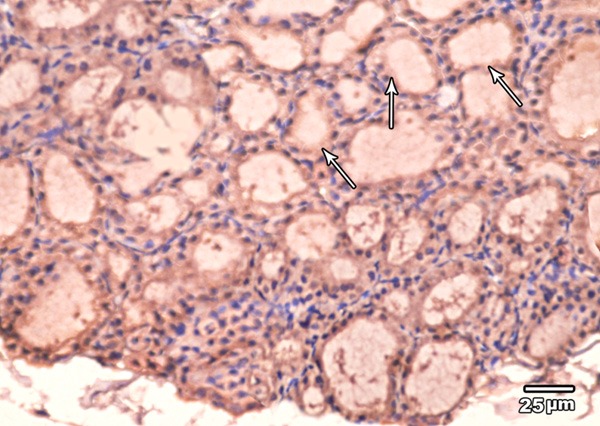
A section in the thyroid gland of adult rat treated with low toxic dose of MSG (group III) showing weak BCL2 immunoexpression in the cytoplasm and nuclei of the majority of follicular cells (arrow) (BCL2 immunoexpression × 400).
Ultrathin sections examination of the thyroid glands of low toxic dose MSG treated group revealed columnar follicular cells lining the thyroid follicles with hyperchromatic nuclei. Their cytoplasm revealed marked dilatation of rER and increased number of lysosomes. The apical border of these cells revealed areas of short or lost microvilli (Figure 12).
Figure 12.
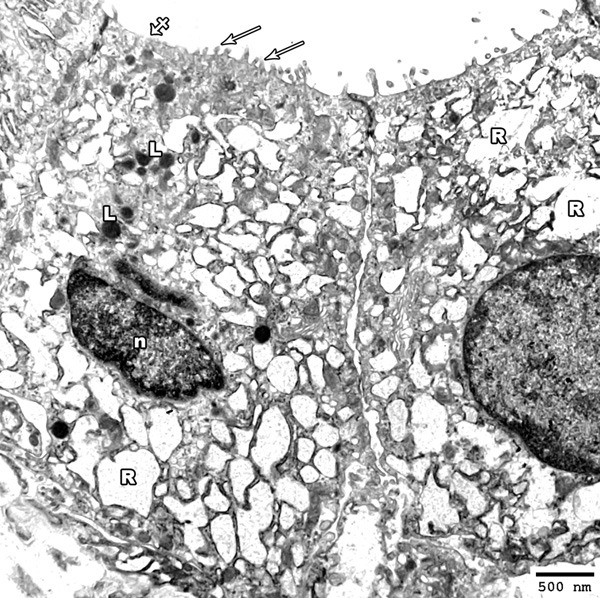
Electron photomicrograph of the thyroid gland of adult rat treated with low toxic dose of MSG (group III) showing columnar follicular cells; one with oval hyper-chromatic nucleus (n). Marked dilatation of rER (R) and increased lysosomes (L) are also observed. Areas of short microvilli (arrows) and others with lost microvilli (crossed arrow) are seen (Uranyl acetate and lead citrate × 2500).
High toxic dose MSG treated group
Haematoxylin and eosin stained sections of the thyroid glands of high toxic dose MSG treated group (group IV) revealed areas with loss of follicular pattern and others with follicular destruction. Follicular hyperplasia and reduction in amount of colloid were also observed (Figure 13).
Figure 13.
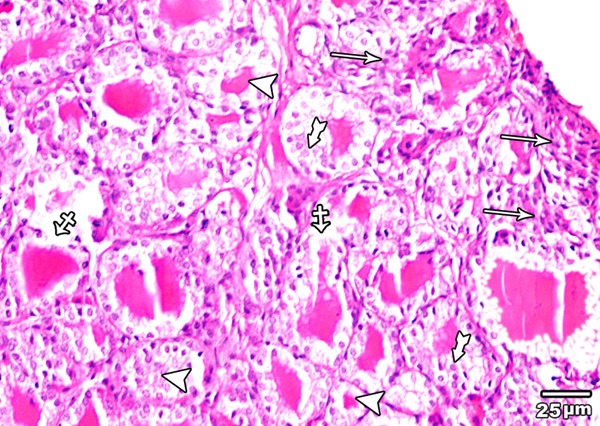
A section in the thyroid gland of adult rat treated with high toxic dose of MSG (group IV) showing an area with complete loss of the normal architecture of the thyroid gland (arrow), and other with disruption of the basal laminae of some follicles with their coalescence (crossed arrow). Follicular hyperplasia (tailed arrow) and reduction in amount of colloid (arrow head) are also obvious (H&E × 400).
PAS reaction of the thyroid glands of high toxic dose MSG treated group (group IV) showed marked decrease in the amount of PAS positive central colloid, some follicles are completely empty (Figure 14).
Figure 14.
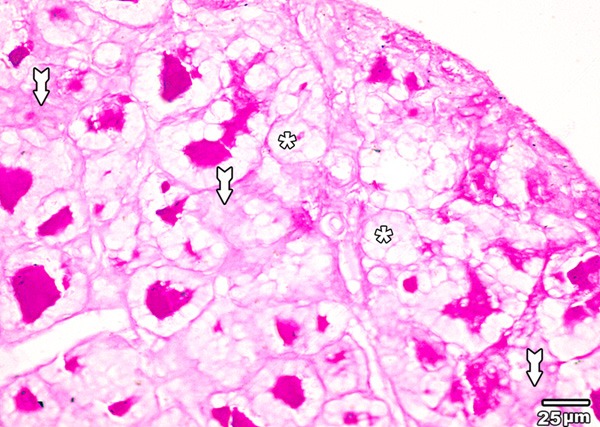
A section in the thyroid gland of adult rat treated with high toxic dose of MSG (group IV) showing marked decrease in the amount of PAS positive central colloid, some follicles are completely empty (asterisk). Positive PAS reaction is also observed in the cytoplasm of follicular cells (tailed arrow) (PAS × 400).
Immunohistochemical examination of BCL2 immunoexpression of the thyroid glands of high toxic dose MSG treated group revealed also a faint brown color in the cytoplasm of the majority of the follicular cells (Figure 15).
Figure 15.
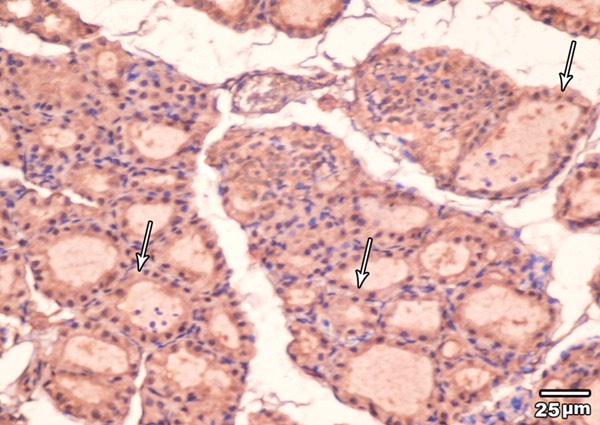
A section in the thyroid gland of adult rat treated with high toxic dose of MSG (group IV) showing weak BCL2 immunoexpression in the cytoplasm and nuclei of the majority of follicular cells (arrow) (BCL2 immunoexpression × 400).
Electron microscopic examination of the thyroid gland of high toxic dose MSG treated group revealed columnar follicular cells having oval small sized irregular hyperchromatic nuclei. Marked dilatation of rER and vacuolation of mitochondria were seen. The cytoplasm contained also colloid vacuoles and myelin body. The apical surface revealed short microvilli with area of partial loss (Figure 16).
Figure 16.
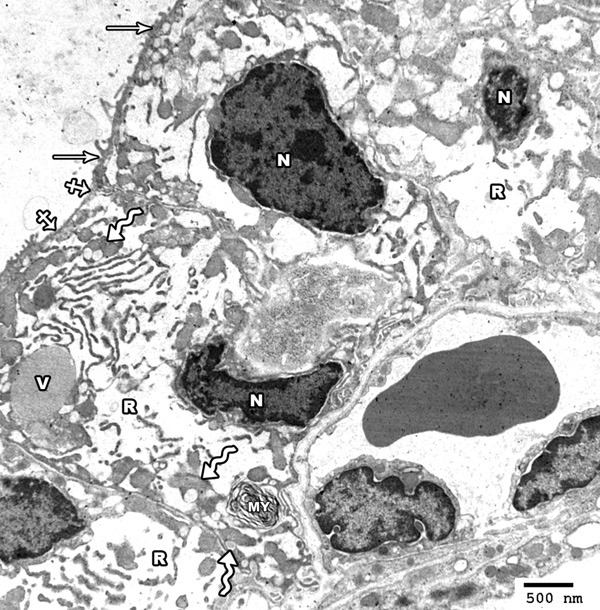
Electron photomicrograph of the thyroid gland of adult rat treated with high toxic dose of MSG (group IV) showing columnar follicular cells having oval small sized irregular hyperchromatic nuclei (N). Marked dilatation of rER (R) and vacuolation of mitochondria (zigzag arrows) are seen. The cytoplasm contains colloid vacuoles (V) and a myeloid body (MY). The apical surface revealed short microvilli (arrow) with area of partial loss (crossed arrow) (Uranyl acetate and lead citrate × 2000).
Histomorphometric and statistical results
The body weight of the rats of control group was non-significantly increased at the end of the experiment. On the other side, the body weights of rats of all MSG treated groups were significantly increased at the end of the experiment (Table 1).
Table 1.
Changes in the body weight
| Groups | Initial body wt. (g) | Final body wt. (g) | P value |
|---|---|---|---|
| Group I | 200 ± 5.3 | 204 ± 4.6 | P0 = 0.154 |
| Group II | 197 ± 6.2 | 234 ± 3.9 | P1 < 0.001* |
| Group III | 202 ± 4.2 | 239 ± 4.5 | P2 < 0.001* |
| Group IV | 198 ± 3.7 | 244 ± 5.1 | P3 < 0.001* |
P0: Control group after versus before treatment; P1: Low dose MSG treated group (II) after versus before treatment; P2: Low toxic dose MSG treated group (III) after versus before treatment; P3: High toxic dose MSG treated group (IV) after versus before treatment;
Significant.
The serum level of T3 and T4 was non-significantly increased in the low dose MSG treated group and significantly increased in high and toxic doses treated groups compared to the control one (Tables 2, 3).
Table 2.
Serum T3 level (ng/dl)
Table 3.
Serum T4 level (μg/dl)
| Groups | Group I | Group II | Group III | Group IV | |
|---|---|---|---|---|---|
| 8.95 ± 0.53 | 9.38 ± 0.41 | 9.98 ± 0.55 | 10.01 ± 0.52 | P1 = 0.106 | |
| P2 = 0.004* | |||||
| P3 = 0.003* |
The external follicular diameter was non-significantly increased in group II and significantly increased in group III and IV compared to control one (Table 4).
Table 4.
The external follicular diameter (μm)
| Groups | Group I | Group II | Group III | Group IV | |
|---|---|---|---|---|---|
| 75.43 ± 1.45 | 77.03 ± 1.44 | 70.01 ± 0.21 | 68.22 ± 0.43 | P1 = 0.061 | |
| P2 < 0.001* | |||||
| P3 < 0.001* |
The follicular epithelial height was non-significantly increased in group II and significantly increased in group III and IV compared to control group (Table 5).
Table 5.
The follicular epithelial height (μm)
| Groups | Group I | Group II | Group III | Group IV | |
|---|---|---|---|---|---|
| 10.55 ± 1.23 | 11.42 ± 1.2 | 12.6 ± 1.5 | 13.02 ± 1.34 | P1 = 0.205 | |
| P2 = 0.015* | |||||
| P3 = 0.002* |
The area percent of the immune reaction was non-significantly decreased in group II and significantly decreased in group III and IV compared to control group (Table 6).
Table 6.
Area % of immune reaction in the studied group
| Groups | Group I | Group II | Group III | Group IV | |
|---|---|---|---|---|---|
| 35.96 ± 5.93 | 31.29 ± 7.45 | 6.71 ± 1.74 | 2.73 ± 0.74 | P1 = 0.084 | |
| P2 < 0.001* | |||||
| P3 < 0.001* |
Discussion
As food additive, MSG is recorded as a “Flavoring”. It can motivate the oro-sensory receptors, improves the deliciousness of meals and increases the appetite therefore, MSG is considered as a leading cause of weight gain [26]. On the other side, a significant increase in weight gain without hyperphagia was previously reported as a common outcome of numerous studies after MSG treatment [27-30]. Weight gain in newborn mice after MSG administration had caused lesions in hypothalamic arcuate nucleus (ARCN). Reduced leptin and insulin signaling were also documented after MSG administration resulting in hyperleptinemia and hyper-insulinemia. Leptin is an appetite-repressing hormone, so it regulates appetite as well as the body weight. MSG administration was also reported to induce damage in the Intra-hypothalamic arcuate-para-ventricular nuclear axis (ARCN) which is the main factor of food-intake regulation by neuropeptide-Y (NPY). Decreasing NPY secreting neurons as a result to damage of ARCN supports the hypopahgia induced with MSG administration [31].
In the current study, a statistically significant increase (P < 0.001) in the mean body weight of all MSG treated groups without increase in food intake as compared to the control one was observed.
The danger of MSG’s usage has generated much controversy [26]. MSG was reported as a safe food additive with no maximum daily average intake by The Food and Drug Administration (FDA) [32]. On the other side, several previous studies reported hazards and toxic effects for MSG administration in human and animals [33-38]. These effects varies from allergic reaction; flushing, sweating, numbness, weakness, dizziness and headaches [34] to lethal organs damage including; male and female genital organs [35,36], liver and kidney [37,38]. In addition, MSG administration has been supposed to cause or worsen numerous conditions; including ventricular arrhythmia and neuropathy [34].
Although, MSG is a widely used flavor enhancing food additive, literatures investigating the effect of MSG on the morphology and function of thyroid gland are few and controversial. In this study different doses of MSG were used for one month. The selected doses were chosen according to the toxicity levels of MSG administration on different body organs reported by previous authors [16,17].
In the current study Hx. and E. stained sections of the thyroid gland of group II revealed no obvious changes are observed regarding follicular shape or diameter. On the other side, irregularity in the shape of some thyroid follicles with discontinuity of their basement membrane were detected in group III and IV. This irregularity in the shape of thyroid follicles was previously described in MSG treated rats [15].
Increase in follicular epithelial height and decrease in the colloid was detected in the present work in all groups treated with MSG; the peripheral follicles were delimited by cubical epithelial cells with rounded central nuclei and the central ones were lined by columnar epithelium. This result came in accordance with other authors [15] who reported significant increase in the average height of the follicular cells, reduced amount of colloid in some follicles together with congested stromal blood vessel after a daily intra-peritoneal injection of MSG 4 mg/g body weight for seven days and the rats examined after one month from the last dose. They referred that to the hyperthyroid state after this period of MSG administration. On the other side, a typical histological picture of hypothyroid state; large follicles with abundant colloid and delimited with flat cells was previously reported in young female mice treated with different doses of MSG (2, 4 and 6 mg/g) for seven days and the effects were seen after 13 and 52 weeks [39]. Conversely, no apparent changes were reported in neonatal rats’ thyroid histology, number of follicles, follicular epithelium thickness, amount of colloid and stromal vascularity after a period of 6 to 18 months of MSG treatment [40].
Follicular epithelial hyperplasia and decrease in the amount of magenta coloured colloid with increased marginal vacuolation were detected in some thyroid follicles especially of group III and IV. In addition, completely empty follicles from colloid were also observed. This result come in accordance with other authors [15] after intra-peritoneal injection of MSG (4 mg/g body weight) for seven days and the rats examined after one month from the last dose. They explained that, this response looks like the histological changes created by the goitrogens. The response of the thyroid to goitrogens is previously described as tri-phasic response [41]. First, there is an early piercing increase in the proliferation of the epithelial and stromal cells of the thyroid gland reaching its peaks at about 2 weeks and returns to pretreatment levels within 3 months. In this study the follicular cell hyperplasia observed after one month of MSG comes in accordance with this explanation. On the other side, non-significant changes in the thyroid gland histology after a period of 6-18 months of MSG administration were previously reported [42]. It is likely that this long duration was adequate for the histological changes of the thyroid gland to return back, this leading to increase the amount of colloid, reduction in the epithelium height and the follicular cells to return to their normal morphology.
In the present study few pyknotic cells started to appear in group II which became more predominant with the appearance of exfoliated cells in the colloid in group III & IV. In addition, areas of loss of follicular pattern, and others with follicular destruction were observed in group IV. A similar result was previously reported in the kidney of MSG treated rats. They referred that to oxidative damage. They added that the generation of reactive oxygen species is considered to be a primary incident under a variety of stress conditions [43].
The release of reactive oxygen species induced DNA fragmentation, increased apoptosis, increased cytochrome c release from the mitochondria to cytosol, down regulated anti-apoptotic Bcl-2 and other mediators; upregulated pro-apoptotic markers [44].
Ultrastructural examination of the thyroid follicles of MSG treated groups’ revealed follicular cells with areas of short or lost microvilli and hyperchromatic or pyknotic nuclei with irregular nuclear membrane. A similar ultrastructure was previously described in proximal convoluted renal tubules of MSG treated rats by other authors [43]. They observed incomplete brush border damage, few lysosomes and cytoplasmic vacuoles with degenerative changes in most of the cytoplasmic organelles.
The cytoplasm of the follicular cells revealed increased number of lysosomes and dilatation of rER; this dilatation was more marked in group III and IV. Vacuolation of mitochondria was detected in group IV. This response resembled the histological changes produced by the goitrogens [45]. Similar ultrastructural changes were previously reported in pancreatic acinar cells of MSG treated rats in a concentration of 1% MSG for 1 month [46]. They observed the presence of numerous large size autophagic vacuoles, dilatation of rough endoplasmic reticulum and swollen vacuolated mitochondria.
Previous researches have explained the mechanisms of action of MSG on different tissue. Some researchers referred that to the presence of glutamate receptors as in the hypothalamus, kidneys, endocrine system, spleen, thymus, liver, ovaries, etc. [47,48]. Other researchers [49,50] reported that there are neurotoxic effects of MSG on the function of hypothalamus-pituitary-gonadal system. The third mechanism stipulated that MSG administration resulted in a decrease in ascorbic acid level which leads to oxidative damage in rat different organs [51-53].
Conclusion
We can conclude that MSG administration in rats even at very low doses is efficient to induce weight gain, altered thyroid function and histology. With change in the way of life today, we are depending on the managed foods that contain chemicals which increase the shelf life and improve taste. Taking in consideration the possible harmful effects of MSG, Thus, it is a must to reconsider the usage of MSG as a flavor enhancer.
Disclosure of conflict of interest
None.
References
- 1.Samuels S. The toxicity/safety of MSG: a study in suppression of information. Account Res. 1999;6:259–310. doi: 10.1080/08989629908573933. [DOI] [PubMed] [Google Scholar]
- 2.IFIC (the International Food Information Council Foundation) Review of monosodium glutamate, examining the myths: 1994 [Google Scholar]
- 3.Ikeda K. New seasonings. Chem Senses. 2002;27:847–849. doi: 10.1093/chemse/27.9.847. [DOI] [PubMed] [Google Scholar]
- 4.Walker R, Lupien JR. The safety evaluation of monosodium glutamate. J Nutr. 2000;130(Suppl):1049S–52S. doi: 10.1093/jn/130.4.1049S. [DOI] [PubMed] [Google Scholar]
- 5.Beyreuther K, Biesalski HK, Fernstrom JD, Grimm P, Hammes WP, Heinemann U, Kempski O, Stehle P, Steinhart H, Walker R. Consensus meeting: monosodium glutamatean update. Eur J Clin Nutr. 2007;61:304–13. doi: 10.1038/sj.ejcn.1602526. [DOI] [PubMed] [Google Scholar]
- 6.Bojanić V, Bojanić Z, Najman S, Savić T, Jakovljević V, Najman S, Jančić S. Diltiazem prevention of toxic effects of monosodium glutamate on ovaries in rats. Gen Physiol Biophys. 2009;28:149–154. [PubMed] [Google Scholar]
- 7.Olney JW, Sharpe LG. Brain lesions in an infant rhesus monkey treated with monosodium glutamate. Science. 1969;166:386–8. doi: 10.1126/science.166.3903.386. [DOI] [PubMed] [Google Scholar]
- 8.Pizzi WJ, Barnhart JE, Fanslow DJ. Monosodium glutamate administration to the newborn reduces reproductive ability in female and male mice. Science. 1977;196:452–4. doi: 10.1126/science.557837. [DOI] [PubMed] [Google Scholar]
- 9.Nemero CB, Lamartiniere CA, Mason GA, Squibb RE, Hong JS, Bondy SC. Marked reduction in gonadal steroid hormone levels in rats treated neonatally with monosodium Lglutamate: Further evidence for disruption of hypothalamicpituitary-gonadal axis regulation. Neuroendocrinology. 1981;33:265–7. doi: 10.1159/000123243. [DOI] [PubMed] [Google Scholar]
- 10.Seo HJ, Ham HD, Jin HY, Lee WH, Hwang HS, Park SA, Kim YS, Choi SC, Lee S, Oh KJ, Kim BS, Park BR, Lee MY. Chronic administration of monosodium glutamate under chronic variable stress impaired hypothalamic-pituitaryadrenal axis function in rats. Korean J Physiol Pharmacol. 2010;14:213–21. doi: 10.4196/kjpp.2010.14.4.213. [DOI] [PMC free article] [PubMed] [Google Scholar]
- 11.Ortiz GG, Bitzer-Quinter OK, Beas Zárate C, Rodríguez-Reynoso S, Larios-Arceo F, Velázquez-Brizuela IE, Pacheco-Moisés F, Rosales-Corral SA. Mono-sodium glutamate-induced damage in liver and kidney: a morphological and bio-chemical approach. Biomed Pharmacother. 2006;60:86–91. doi: 10.1016/j.biopha.2005.07.012. [DOI] [PubMed] [Google Scholar]
- 12.Iamsaard S, Sukhorum W, Samrid R, Yimdee J, Kanla P, Chaisiwamongkol K, Hipkaeo W, Fongmoon D, Kondo H. the sensitivity of male rat reproductive organs to monosodium glutamate. Acta Medica Acad. 2014;43:3–9. doi: 10.5644/ama2006-124.94. [DOI] [PubMed] [Google Scholar]
- 13.Miskowiak B, Partyka M. Effect of neonatal treatment with MSG (monosodium glutamate) on thyroid of the adult male rats. Histol Histopathol. 1999;14:63–67. doi: 10.14670/HH-14.63. [DOI] [PubMed] [Google Scholar]
- 14.Dhindsa KS, Omran RG, Bhup R. Histological changes in the thyroid gland induced by monosodium glutamate in mice. Acta Anat (Basel) 1981;109:97–102. doi: 10.1159/000145371. [DOI] [PubMed] [Google Scholar]
- 15.Rani P, Khatri K, Chauhan R. Monosodium glutamate induced histomorphome-tric changes in thyroid gland of adult Wistar rat. J Med Allied Sci. 2013;3:67–71. [Google Scholar]
- 16.Bogdanov MB, Wurtman RJ. Effects of systemic or oral ad libitum monosodium glutamate administration on striatal glutamate release, as measured using microdialysis in freely moving rats. Brain Res. 1994;660:337–40. doi: 10.1016/0006-8993(94)91309-9. [DOI] [PubMed] [Google Scholar]
- 17.Eweka A, Om’Iniabohs F. Histological studies of the effects of monosodium glutamate on the testes of adult Wistar rats. Ann Med Health Sci Res. 2011;1:37–43. [PMC free article] [PubMed] [Google Scholar]
- 18.Whitley RJ. Tietz-Text book of Clinical Chemistry. 3rd edition. Philadelphia: W.B. Saunders; 1999. Thyroid function; p. 1496. Chapter 3. [Google Scholar]
- 19.Drury RAB, Walington EAF. Carleton’s histological techniques. 4th edition. London: Oxford University Press; 1980. pp. 85–84. [Google Scholar]
- 20.Elias JM, Newgard OF, Schorck TL. Sensitivity and efficiency of the peroxidase anti peroxidase (PAP), avidin-biotin peroxidase complex (ABC) and peroxidase-labeled avidin-biotin (LAB) method. Am J Pathol. 1989;92:62–69. doi: 10.1093/ajcp/92.1.62. [DOI] [PubMed] [Google Scholar]
- 21.Kiernan J. Histological and histochemical methods: theory and practice. 3rd edition. Oxford: Butterworth-Heinemann; 2000. pp. 320–390. [Google Scholar]
- 22.Bancroft M, Gamble J. Theory practice of histological techniques 6th edition. Churchill L ivingstone; 2008. p. 121. [Google Scholar]
- 23.Sharma R, Gandhi E. Localization of interleukin-2 in goat ovary. IOSR J Pharm. 2012;2:7–11. [Google Scholar]
- 24.Huang A, Fone P, Gandour E, White R, Low R. Immunohistochemical analysis of BCL-2 protein expression in renal cell carcinoma. J Urol. 1999;162:610–613. [PubMed] [Google Scholar]
- 25.Woods AE, Stirling JW. Electron microscopy. In: Bancroft JD, Gamble M, editors. Theory and practice of histological techniques. 6th edition. Edinburgh: Churchill Livingstone Elsevier; 2008. pp. 601–636. [Google Scholar]
- 26.Biodun D, Biodun A. “A Spice or Poison? Is Monosodium Glutamate Safe for Human Consumption?”. National Concord. 1993;5 [Google Scholar]
- 27.Olney JW. Brain lesions, obesity, and other disturbances in mice treated with monosodium glutamate. Science. 1969;164:719–721. doi: 10.1126/science.164.3880.719. [DOI] [PubMed] [Google Scholar]
- 28.Nakagawa T, Ukai K, Hyama T, Gomita Y, Okamura H. Effects of chronic administration of sibutramine on body weight, food intake and motor activity in neonatally mono-sodium glutamate-treated obese female rats: relationship of anti-obesity effect with monoamines. Exp Anim. 2000;49:239–249. doi: 10.1538/expanim.49.239. [DOI] [PubMed] [Google Scholar]
- 29.Hermanussen M, Tresguerres JA. Does the thrifty phenotype result from chronic glutamate intoxication? A hypothesis. J Perinat Med. 2003;31:489–495. doi: 10.1515/JPM.2003.075. [DOI] [PubMed] [Google Scholar]
- 30.Hermanussen M, Garci AP, Sunder M, Voigt M, Salazar V, Tresguerres JA. Obesity, voracity, and short stature, the impact of glutamate on the regulation of appetite. Eur J Clin Nutr. 2006;60:25–31. doi: 10.1038/sj.ejcn.1602263. [DOI] [PubMed] [Google Scholar]
- 31.Strieker-Krongrad A, Beck B, Burlet C. Enhanced feeding response to neuropeptide Y in hypothalamic neuropeptide Y-depleted rats. Eur J Pharmacol. 1996;295:27–34. doi: 10.1016/0014-2999(95)00647-8. [DOI] [PubMed] [Google Scholar]
- 32.Rogers PP, Blundell JE. Umani and appetite: effects of monosodium glutamate on hunger and food intake in human subjects. Physiol Behav. 1990;486:801–804. doi: 10.1016/0031-9384(90)90230-2. [DOI] [PubMed] [Google Scholar]
- 33.Belluardo M, Mudo G, Bindoni M. Effect of early Destruction of the mouse arcuate nucleus by MSG on age Dependent natural killer activity. Brain Res. 1990;534:225–333. doi: 10.1016/0006-8993(90)90132-u. [DOI] [PubMed] [Google Scholar]
- 34.Geha RS, Beiser A, Ren C, Patterson R, Grammar LC, Ditto AM, Harris KE. Review of Allergic Reaction to Monosodium Glutamate and Outcome of a Multicenter Double Blind Placebo-Controlled Study. J Nutr. 2001;130:1032S–1038S. doi: 10.1093/jn/130.4.1058S. [DOI] [PubMed] [Google Scholar]
- 35.Das R, Ghosh S. Long-term effects of monosodium glutamate on spermatogenesis following neonatal exposure in albino mice-a histological study. Nepal Med Coll J. 2010;12:149–153. [PubMed] [Google Scholar]
- 36.Eweka AO, Eweka A, Om’Iniabohs FA. Histological studies of the effects of monosodium glutamate of the fallopian tubes of adult female Wistar rats. North Am J Med Sci. 2010;2:146–149. doi: 10.4297/najms.2010.3146. [DOI] [PMC free article] [PubMed] [Google Scholar]
- 37.Eweka AO. Histological studies of the effects of monosodium glutamate on the kidney of adult Wistar rats. The Internet Journal of Health. 2007;6:2. [Google Scholar]
- 38.Tawfik MS, Al-Badr N. Adverse Effects of Monosodium Glutamate on Liver and Kidney Functions in Adult Rats and Potential Protective Effect of Vitamins C and E. Food and Nutrition Sciences. 2012;3:651–659. [Google Scholar]
- 39.Dhindsa KS, Omran RG, Bhup R. Histological changes in the thyroid gland induced by monosodium glutamate in mice. Acta Anat (Basel) 1981;109:97–102. doi: 10.1159/000145371. [DOI] [PubMed] [Google Scholar]
- 40.Miskowiak B, Partyka M. Effect of neonatal treatment with MSG (monosodium glutamate) on thyroid of the adult male rats. Histol Histopathol. 1999;14:63–67. doi: 10.14670/HH-14.63. [DOI] [PubMed] [Google Scholar]
- 41.Thomas GA, William D, Mohr U, Dungworth DL, Capen CC. Pathobiology of the aging rat. Washington, DC: ILSI Press; 1992. Changes in structure and function of the thyroid follicular cell; pp. 269–283. [Google Scholar]
- 42.Miskowiak B, Partyka M. Effect of neonatal treatment with MSG (monosodium glutamate) on thyroid of the adult male rats. Histol Histopathol. 1999;14:63–67. doi: 10.14670/HH-14.63. [DOI] [PubMed] [Google Scholar]
- 43.Afeefy AA, Mahmoud MS, Arafa MA. Effect of Honey on Monosodium Glutamate Induced Nephrotoxicity (Histological and Electron Microscopic Studies) Journal of American Science. 2012;8:146–156. [Google Scholar]
- 44.Banu SK, Stanley JA, Lee J, Stephen SD, Arosh JA, Hoyer PB, Burghardt RC. Hexavalent chromium-induced apoptosis of granulosa cells involves selective sub-cellular translocation of Bcl-2 members, ERK1/2 and p53. Toxicol Appl Pharmacol. 2011;251:253–266. doi: 10.1016/j.taap.2011.01.011. [DOI] [PMC free article] [PubMed] [Google Scholar]
- 45.Ikeda T, Nishikawa A, Imazawa T. Dramatic synergism between excess soybean intake and iodine deficiency on the development of rat thyroid hyperplasia. Carcinogenesis. 2000;21:707–713. doi: 10.1093/carcin/21.4.707. [DOI] [PubMed] [Google Scholar]
- 46.Lee KT, Sheen PC. Study of lysosomal changes in rat pancreas after ingesting monosodium L-glutamate. Pancreas. 1994;9:304–8. doi: 10.1097/00006676-199405000-00004. [DOI] [PubMed] [Google Scholar]
- 47.Gill S, Pulido O. Glutamate receptors in peripheral tissue excitatory transmission outside the CNS Kulwer Academic. New York: Plenum Publisher; 2005. pp. 3–26. [Google Scholar]
- 48.Gill SS, Mueller RW, Mcguire PF, Pulido OM. Potential target sites in peripheral tissues for excitatory neurotransmission and excitotoxicity. Toxicol Pathol. 2000;28:277–284. doi: 10.1177/019262330002800207. [DOI] [PubMed] [Google Scholar]
- 49.Gong SL, Xia FQ, Wei J, Li XY, Sun TH, Lu Z, Liu SZ. Harmful effects of MSG on function of hypothalamus-pituitary-target gland system. Biomed Environ Sci. 1995;8:310–317. [PubMed] [Google Scholar]
- 50.Giovambattista A, Suescun M, Nessralla C, Franca L, Spinedi E, Calandra R. Modulatory effects of leptin on Leydig cell function of normal and hyperleptinemic rats. Neuroendocrinology. 2003;78:270–279. doi: 10.1159/000074448. [DOI] [PubMed] [Google Scholar]
- 51.Moreno G, Perello M, Gaillard RC, Spine E. Orexina stimulates hypothalamic-pituitary-adrenal (HPA) axis function, but not food intake in the absence of full hypothalamic NPY-ergic activity. Endocrine. 2005;26:99–106. doi: 10.1385/ENDO:26:2:099. [DOI] [PubMed] [Google Scholar]
- 52.Farmobi E, Onyema O. Monosodium glutamate-induced oxidative damage and genotoxicity in the rat modulatory role of vitamin C, vitamin E and quercetin. Hum Exp Toxicol. 2006;25:251–259. doi: 10.1191/0960327106ht621oa. [DOI] [PubMed] [Google Scholar]
- 53.Pavlovic V, Pavlovic D, Kocic G, Sokolovic D, Jevtovic-Stoimenov T, Cekic S, Velickovic D. Effect of monosodium glutamate on oxidative stress and apoptosis in rat thymus. Mol Cell Biochem. 2007;303:161–166. doi: 10.1007/s11010-007-9469-7. [DOI] [PubMed] [Google Scholar]


