

Abstract
Background
First metabolomics studies have indicated that metabolic fingerprints from accessible tissues might be useful to better understand the etiological links between metabolism and cancer. However, there is still a lack of prospective metabolomics studies on pre-diagnostic metabolic alterations and cancer risk.
Methods
Associations between pre-diagnostic levels of 120 circulating metabolites (acylcarnitines, amino acids, biogenic amines, phosphatidylcholines, sphingolipids, and hexoses) and the risks of breast, prostate, and colorectal cancer were evaluated by Cox regression analyses using data of a prospective case-cohort study including 835 incident cancer cases.
Results
The median follow-up duration was 8.3 years among non-cases and 6.5 years among incident cases of cancer. Higher levels of lysophosphatidylcholines (lysoPCs), and especially lysoPC a C18:0, were consistently related to lower risks of breast, prostate, and colorectal cancer, independent of background factors. In contrast, higher levels of phosphatidylcholine PC ae C30:0 were associated with increased cancer risk. There was no heterogeneity in the observed associations by lag time between blood draw and cancer diagnosis.
Conclusion
Changes in blood lipid composition precede the diagnosis of common malignancies by several years. Considering the consistency of the present results across three cancer types the observed alterations point to a global metabolic shift in phosphatidylcholine metabolism that may drive tumorigenesis.
Electronic supplementary material
The online version of this article (doi:10.1186/s12916-016-0552-3) contains supplementary material, which is available to authorized users.
Keywords: Metabolomics, Epidemiology, Breast cancer, Prostate cancer, Colorectal cancer
Background
The simultaneous measurement of a large variety of small molecules in accessible tissues by metabolomics techniques may facilitate the identification of metabolic fingerprints of different cancers [1]. First prospective metabolomics studies have shown that elevations in circulating branched-chained amino acids 2–5 years prior to diagnosis are related to increased risk of pancreatic adenocarcinoma [2], that significant differences in serum levels of phosphatidylcholines and fatty acids between later prostate cancer cases and controls can be detected [3], and that pre-diagnostic serum concentrations of glycochenodeoxycholate are associated with colon cancer risk [4]. A complex pattern of pre-diagnostic metabolites representing several pathways has been identified in another prospective study on hepatocellular carcinoma [5]. For other cancers, differences in plasma metabolite concentrations between cases and controls have also been demonstrated, but prospective data are missing [1].
Here, we report results of the largest prospective metabolomics study so far on cancers of the breast, colorectum, and prostate. Our goal was the identification of metabolites that may give insight into metabolic alterations preceding the manifestation of cancer. In a case-cohort subset of the prospective population-based EPIC-Heidelberg study, we analyzed pre-diagnostic levels of 120 plasma metabolites by liquid chromatography-tandem mass spectrometry (LC-MS/MS) and flow injection analysis-tandem mass spectrometry (FIA-MS/MS), and evaluated associations between these metabolites and cancer risk over time.
Methods
Study population
EPIC-Heidelberg was established as part of the European Prospective Investigation into Cancer and Nutrition (EPIC) between 1994 and 1998 [6]. Overall, 25,540 adults (53.3 % females) aged 35–65 years from the local general population entered the study [7]. The vast majority of participants are white. Detailed information on habitual diet, smoking, alcohol consumption, physical activity, and socio-economic status was obtained by questionnaires and during interviews. In addition, anthropometric measurements were taken by trained personnel. Blood was drawn, processed, and aliquoted into 0.5 ml straws of serum (8 straws), plasma (12 straws), buffy coat (4 straws), and erythrocytes (4 straws), which were stored in liquid nitrogen at −196 °C. Plasma straws used for the present study were retrieved for the first time, i.e. they had not undergone freeze-and-thaw cycles.
Since the baseline, participants are followed-up by active and passive procedures [8]. Self-reported and registry-derived incident cases of cancer were validated by study physicians who accessed diagnostic records provided by treating physicians and hospitals. A case-cohort design [9] was chosen for the present metabolomics study and metabolites were measured in pre-diagnostic blood samples of cancer cases and a random subcohort [10]. Individuals in the case-cohort selection were free of diabetes at baseline, as the subcohort was initially drawn for the EPIC-InterAct study on incident diabetes [10]. All incident primary cases of breast (ICD-10 C50), prostate (ICD-10 C61), and colorectal cancer (ICD-10 C18–20) as well as cases secondary to non-melanoma skin cancer that had occurred before 31 December 2006 were selected. After exclusion of participants with missing covariate information (n = 4) and prevalent cancer cases (n = 65), the subcohort comprised 774 individuals. The final numbers of incident cases of breast, prostate, and colorectal cancer were 362, 310, and 163, respectively, after exclusions due to missing covariate information (breast cancer: n = 3; colorectal cancer: n = 2).
Ethics
The present study was approved by the Ethics Committee of the Medical Faculty of the University of Heidelberg (Heidelberg, Germany). The study participants provided written consent for the use of their blood samples and data.
Laboratory analyses
Metabolites, i.e. 40 acylcarnitines, 21 amino acids, 14 biogenic amines and creatinine, 76 phosphatidylcholines (PCs), 14 lysophosphatidylcholines (lysoPCs), 15 sphingomyelins, and overall hexose were quantified using the MetaDisIDQ™ Kit (Biocrates, Innsbruck, Austria). Sample preparation and measurements were carried out according to the suppliers’ protocol and have been described in detail elsewhere [11]. In short, 10 μl of standards, quality controls, and plasma samples, which had been thawed for 30 minutes at −4 °C, were pipetted onto filter paper within each well of the 96-well plate that had been commercially prepared. Nitrogen gas was used to dry the samples followed by application of phenylisothiocyanate (PITC) and extraction of metabolites from the filter paper. The eluate was then dried under flowing nitrogen gas and the wells sealed. Kit plates were shipped to the partner laboratory at the Department of Proteomics, Helmholtz Centre for Environmental Research (Leipzig, Germany), where liquid FIA-MS/MS (amino acids and biogenic amines) and LC-MS/MS (lipids and hexoses) analyses were carried out on each kit. Samples were blinded to the laboratory team. Metabolites were detected using an Agilent 1100 HPLC (Agilent Technologies, Böblingen, Germany) coupled to an API 5000 triple quadrupole mass spectrometer (AB Sciex, Darmstadt, Germany).
The MetaDisIDQ™ software (Biocrates) was used to randomize samples of the study population so that samples of cases and non-cases were stratified within and across batches. Each analytical batch contained three quality control (QC) samples of lyophilized human EDTA-plasma with standardized low, medium (spiked), and high (spiked) concentrations of internal standards to monitor the validity of measurements. Two blinded pooled QC plasma samples were included in duplicate to independently verify the consistency of measurements within and across batches. In addition to a commercially available pooled QC sample (NIST SRM 1950), we used a pooled sample from our own population. One blank without internal standard was included on each batch to calculate background levels and to check the system for contamination. Three additional zero samples with internal standards, but no analytes were integrated to calculate limits of detection.
Data pre-processing and statistical analyses
Metabolites with more than 25 % missing values (n = 2), within batch coefficients of variation greater than 25 % (n = 12), or more than 25 % of values below the limit of detection (n = 47) were excluded so that 120 out of 181 metabolites were used for statistical evaluation (Additional file 1). All metabolite values were then log2-tranformed and normalized by metabolite-wise batch-standardization [12]. Multivariable outliers were identified by robust principal components analyses and excluded [13]. Spearman’s rho adjusted for age and sex was calculated to detect correlations between metabolites. Associations between metabolite concentrations and epidemiological covariates were assessed by calculating Spearman’s correlations (continuous covariates) and geometric mean values across categories (categorical covariates). Cox proportional hazards regression analyses were carried out to evaluate the relationships between circulating metabolites and cancer risks. Metabolite concentrations were divided into quartiles and linear trends were tested for using log2-transformed metabolite values on the continuous scale. The so-called Prentice method was used to account for the case-cohort design of the study [14]. Age was used as the underlying timescale, with age at recruitment as age at entry and age at the end of follow-up, death, or cancer diagnosis, whichever came first, as age at exit. The proportional hazards assumption was tested based on Schoenfeld residuals [15]. With respect to the vast majority of metabolites, and particularly those which showed significant associations with cancer risk, no strong violations of the proportional hazards assumption were noted. Adjustment factors for multivariable Cox regression models were selected based on literature review. The Bonferroni method was used to adjust for multiple testing, i.e. P values of single tests were divided by the total number of tests (n = 120). All statistical tests were two-sided and P values below 0.05 were considered statistically significant. All analyses were performed using SAS 9.3 (SAS Institute, Cary, NC, USA).
Results
Characteristics of the study population are shown in Table 1. The case-cohort sample comprised a random subcohort (n = 774) and cases of breast (n = 362), prostate (n = 310), and colorectal cancer (n = 163). Median follow-up durations were 8.34 years in the subcohort and 6.36 years (breast cancer), 6.57 years (colorectal cancer), 6.83 years (prostate cancer), and 6.48 (overall cancer) among incident cases.
Table 1.
Characteristics of the study population (EPIC-Heidelberg, case-cohort sample)
| Incident cancer cases | Subcohort | ||||
|---|---|---|---|---|---|
| Colorectum | Breast | Prostate | Women | Men | |
| N | 163 | 362 | 310 | 426 | 348 |
| Age at recruitment (years) | 55.8 ± 6.4 | 51.4 ± 7.8 | 57.9 ± 5.2 | 49.1 ± 8.5 | 52.3 ± 7.1 |
| Women (%) | 37.4 | 100 | |||
| Menopausal status (%) | |||||
| Premenopausal | 31.5 | 48.6 | |||
| Postmenopausal | 68.5 | 51.4 | |||
| BMI (kg/m2) | 27.2 ± 3.8 | 25.1 ± 4.4 | 26.9 ± 3.3 | 24.8 ± 4.4 | 26.5 ± 3.4 |
| Waist circumference (cm) | 93.5 ± 12.5 | 81.0 ± 11.3 | 96.2 ± 9.6 | 79.8 ± 11.0 | 95.2 ± 9.8 |
| Smoking (%) | |||||
| Never | 31.9 | 55.0 | 42.6 | 50.5 | 34.4 |
| Former | 44.8 | 25.7 | 41.6 | 28.4 | 41.7 |
| Current | 23.3 | 19.3 | 15.8 | 21.1 | 23.9 |
| Physical activity (%)a | |||||
| Inactive | 12.3 | 11.6 | 11.6 | 9.9 | 11.8 |
| Moderately inactive | 34.3 | 35.1 | 36.1 | 34.5 | 31.3 |
| Moderately active | 27.0 | 26.5 | 29.7 | 29.8 | 29.6 |
| Active | 26.4 | 26.8 | 22.6 | 25.8 | 27.3 |
| Education level (%) | |||||
| Primary school | 33.1 | 24.6 | 34.2 | 25.6 | 25.9 |
| Secondary school | 34.4 | 48.6 | 32.9 | 51.2 | 33.0 |
| University degree | 32.5 | 26.8 | 32.9 | 23.2 | 41.1 |
| NSAID use (%) | 9.2 | 2.5 | 8.7 | 2.1 | 6.0 |
| Age at diagnosis (years) | 62.3 ± 7.2 | 57.5 ± 7.8 | 64.5 ± 5.2 | ||
| Stage at diagnosis (%) | |||||
| Local | 40.5 | 62.2 | 70.7 | ||
| Regional | 40.5 | 32.0 | 24.8 | ||
| Distant | 19.0 | 2.2 | 3.2 | ||
| Unknown | - | 3.6 | 1.3 | ||
Values are means ± standard deviations or proportions. aAccording to the Cambridge physical activity index
Associations between metabolite levels and cancer risk are depicted in Fig. 1. The strongest statistical relationship was found between levels of the lysoPC a C18:0 and breast cancer risk, at a P value of 0.00421 corrected for multiple testing by the Bonferroni method. The hazard ratio (HR) of breast cancer among women in the highest quartile of lysoPC a C18:0 concentrations was 0.29 (95 % CI, 0.18–0.47, Table 2). The second and third strongest associations were between PC ae C38:1 and breast cancer risk (HR = 0.53, 95 % CI, 0.34–0.83, P = 0.08), and PC ae C30:0 and prostate cancer risk (HR = 1.89, 95 % CI, 1.06–3.36, P = 0.23). Considering the consistency of associations between levels of lysoPC a C18:0 and PC ae C30:0 and individual cancer types, visualized in Fig. 1, we decided to expand our analyses to overall cancer risk. LysoPC a C18:0 concentrations were strongly associated with decreased overall cancer risk (HR = 0.37, 95 % CI, 0.27–0.51, P <0.0001, Table 2). Similarly, levels of lysoPC a C18:1 and further lysoPCs, which positively correlated with lysoPC a C18:0 levels (Fig. 2), showed inverse associations (Fig. 1, Table 2). Circulating PC ae C30:0 was directly associated with overall cancer risk (HR = 1.85, 95 % CI, 1.31–2.60, P = 0.0314, Table 2).
Fig. 1.
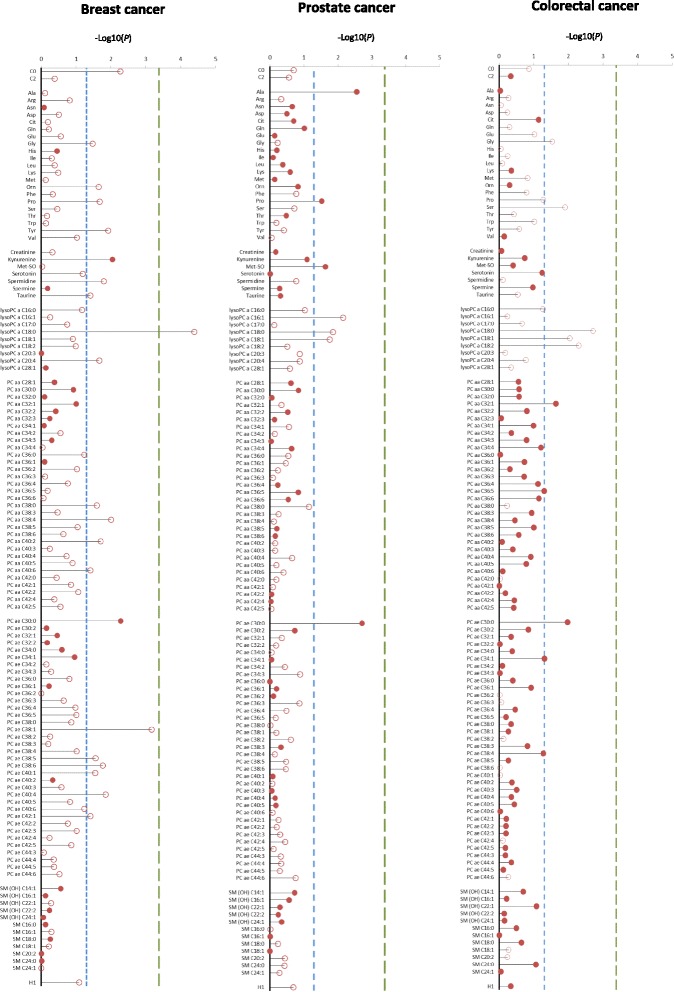
Plasma metabolite concentrations and cancer risk. P values from Cox regression analyses on individual metabolite concentrations on the log-2 scale and cancer risk are represented by the needles. The blue dashed lines depict the significance threshold at an uncorrected P <0.05 and green dashed lines depict the significance threshold after Bonferroni correction (0.05 divided by 120). Unfilled circles indicate inverse associations and filled circles indicate direct associations. Metabolites are grouped by chemical properties: block 1, acylcarnitines; block 2, amino acids; block 3, biogenic amines; block 4, lysophosphatidylcholines (lysoPCs); block 5, diacylphosphatidylcholines; block 6, acyl-alkyl-phosphatidylcholines; block 7, sphingolipids; and block 8, overall hexoses. All multivariable Cox regression models were adjusted for age, smoking (never, former, current), lifetime alcohol intake (g/d), current aspirin use (yes/no), physical activity (Cambridge index), waist circumference (cm), BMI (continuous), height (cm), and education level (primary school, secondary school, university degree). Analyses on breast cancer risk were additionally adjusted for menopausal status, current HRT use (yes/no), current oral contraceptive use (yes/no), and at least one full term pregnancy (yes/no). Analyses on colorectal cancer risk were additionally adjusted for sex, fiber intake (g/d), and processed meat intake (g/d)
Table 2.
Hazard ratios (95 % CIs) of cancer across quartiles of lysoPC a C18:0 and PC ae C30:0 concentrations
| Quartile 1 | Quartile 2 | Quartile 3 | Quartile 4 | ptrend (raw) | ptrend (corrected) | Measured in | ||
|---|---|---|---|---|---|---|---|---|
| LysoPC a C18:0 | 100 % | |||||||
| Breast cancer | Mediana | 13.52 | 17.34 | 20.36 | 23.23 | |||
| n cases | 137 | 96 | 84 | 45 | ||||
| Ref. | 0.63 (0.41, 0.97) | 0.65 (0.41, 1.02) | 0.29 (0.18, 0.47) | 0.00004 | 0.00421 | |||
| Prostate cancer | Median | 15.33 | 18.69 | 21.43 | 26.3 | |||
| n cases | 93 | 96 | 73 | 48 | ||||
| Ref. | 1.31 (0.75, 2.28) | 0.79 (0.45, 1.39) | 0.57 (0.33, 0.98) | 0.01388 | 1 | |||
| Colorectal cancer | Median | 14.37 | 17.71 | 21.21 | 24.13 | |||
| n cases | 47 | 47 | 46 | 23 | ||||
| Ref. | 1.16 (0.67, 2.01) | 1.06 (0.62, 1.82) | 0.50 (0.28, 0.90) | 0.00196 | 0.2348 | |||
| Overall cancer | Median | 14.37 | 17.93 | 20.85 | 24.63 | |||
| n cases | 280 | 228 | 211 | 116 | ||||
| Ref | 0.83 (0.61, 1.12) | 0.74 (0.55, 1.00) | 0.37 (0.27, 0.51) | 1.10 × 10⁻⁹ | 1.10 × 10⁻⁷ | |||
| PC ae C30:0 | 95.6 % | |||||||
| Breast cancer | Median | 0.33 | 0.40 | 0.47 | 0.60 | |||
| n cases | 69 | 74 | 92 | 113 | ||||
| Ref. | 1.08 (0.67, 1.75) | 1.45 (0.88, 2.37) | 1.97 (1.20, 3.23) | 0.00522 | 0.6260 | |||
| Prostate cancer | Median | 0.28 | 0.35 | 0.4 | 0.53 | |||
| n cases | 64 | 63 | 71 | 100 | ||||
| Ref. | 0.89 (0.50, 1.58) | 1.38 (0.78, 2.44) | 1.89 (1.06, 3.36) | 0.00194 | 0.2328 | |||
| Colorectal cancer | Median | 0.28 | 0.38 | 0.45 | 0.59 | |||
| n cases | 36 | 36 | 46 | 39 | ||||
| Ref | 1.00 (0.54, 1.83) | 1.79 (1.01, 3.18) | 1.84 (1.02, 3.34) | 0.01069 | 1 | |||
| Overall cancer | Median | 0.30 | 0.37 | 0.44 | 0.58 | |||
| n cases | 168 | 174 | 208 | 253 | ||||
| Ref | 1.03 (0.73, 1.45) | 1.41 (1.01, 1.96) | 1.85 (1.31, 2.60) | 0.00026 | 0.03137 |
Results from Cox proportional hazards regression analyses on pre-diagnostic metabolite concentrations and cancer risk over time. All multivariable Cox models were adjusted for age, smoking (never, former, current), lifetime alcohol intake (g/d), current aspirin use (yes/no), physical activity (Cambridge index), waist circumference (cm), BMI (continuous), height (cm), and education level (primary school, secondary school, university degree). Analyses on breast cancer risk were additionally adjusted for menopausal status, current HRT use (yes/no), current oral contraceptive use (yes/no), and at least one full term pregnancy (yes/no). Analyses on colorectal cancer risk were additionally adjusted for sex, fiber intake (g/d), and processed meat intake (g/d). aMedian metabolite concentrations in μmol/L
Fig. 2.
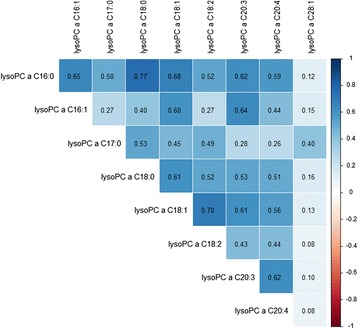
Age- and sex-adjusted Spearman’s correlations between levels of different lysoPCs
There was no heterogeneity in the associations between lysoPC a C18:0 or PC ae C30:0 concentrations and cancer risk by lag time (Additional file 2: Table S2). No meaningful associations between metabolite levels and epidemiological covariates such as age, BMI, dietary factors, or smoking status were observed (Tables 3 and 4). Moderate to strong positive correlations were observed between a majority of metabolites within chemical groups (Fig. 2 and Additional file 2: Figure S1).
Table 3.
Age- and sex-adjusted partial Spearman’s correlations between levels of lysoPC a C18:0 as well as PC ae C30:0 and covariates
| Age | BMI | Height (cm) | Waist (cm) | Fiber intake (g/d) | Meat intake (g/d) | |
|---|---|---|---|---|---|---|
| LysoPC a C18:0 | −0.01 | −0.01 | −0.03 | −0.02 | 0.00051 | 0.06 |
| PC ae C30:0 | −0.02 | −0.17 | 0.06 | −0.16 | 0.03 | −0.22 |
Table 4.
Geometric means (95 % CIs) of metabolite levels adjusted for age and sex across strata of covariates
| LysoPC a C18:0 | PC ae C30:0 | |
|---|---|---|
| Smoking status | ||
| Current | 19.3 (18.6, 20.1) | 0.40 (0.38, 0.41) |
| Former | 19.7 (19.1, 20.3) | 0.43 (0.41, 0.44) |
| Never | 19.8 (19.2, 20.3) | 0.42 (0.41, 0.44) |
| Physical activity | ||
| Inactive | 19.5 (18.4, 20.7) | 0.43 (0.40, 0.45) |
| Moderately inactive | 19.1 (18.4, 19.7) | 0.40 (0.39, 0.42) |
| Moderately active | 19.9 (19.2, 20.6) | 0.43 (0.42, 0.45) |
| Active | 20.1 (19.4, 20.9) | 0.43 (0.41, 0.44) |
Discussion
Since the metabolite levels in our study were measured in blood samples taken years before diagnosis, the present associations between lysoPC and PC ae C30:0 concentrations with the risk of cancer may represent general metabolic alterations fostering the development and growth of cancer cells. In contrast to the relationship between PC ae C30:0 and cancer risk that has not been described in the literature, our findings of associations between lysoPC levels and cancer risk are consistent with results of three case-control studies, in which lower blood concentrations of lysoPCs in patients with breast, prostate and colorectal cancer were found, as compared to controls [16-18].
While a potential shift between lysoPC levels from blood to tumor tissue indicates a higher consumption of lysoPCs by cancer cells, specific signaling properties of lysoPCs in cancer remain to be established [19]. Alternatively, lysoPCs may act as carriers of fatty acids, and extracellular hydrolization of lysoPC a C18:0 and lysoPC a C18:1, followed by a rapid uptake of the respective fatty acids, i.e. stearic (18:0) and oleic acid (18:1), appears to be a characteristic of solid tumors in mice [20]. This is in line with epidemiologic observations of inverse associations between stearic acid levels and breast [21], prostate [3], and colorectal cancer risk [4]. However, it appears spurious why lysoPC a C16:0, lysoPC a C18:1, and lysoPC a C20:4 concentrations also showed inverse associations with cancer risk in our study, whereas circulating palmitic (16:0), oleic (18:1), and arachidonic acid (20:4)—that were not covered by our assay—were not related to cancer risk in previous epidemiological studies.
Possibly, other degradation products of lysoPCs than fatty acids drive tumorigenesis. Extracellular lysoPCs are converted into lysophosphatidic acid (LPA), which induces tumor growth, by autotaxin (ATX), a secreted lysophospholipase D. Overexpression of ATX and LPA receptors has been proposed to be a common feature of several cancers, and both ATX and LPA receptor knockout mice show lower cancer risk [22–24]. Moreover, lysophosphatidylcholine acyltransferase 1 (LPCAT1), which converts lysoPCs into PCs is overexpressed in several cancers, and increased incorporation of PCs into cell membranes may facilitate proliferation, adhesion, and motility of cancer cells [25–27].
Less is known about the role of PC ae C30:0 in carcinogenesis. Elevated PC ae C30:0 concentrations were detected in plasma of patients with ovarian endometriosis [28]. Even though PC levels were inversely associated with prostate cancer risk in one previous study [3] and have been found to be higher in cancer cells than in non-malignant cells [29–31], a distinct biological function of PC ae C30:0 has not been described and ours was the first prospective study on PC ae C30:0 and cancer to our knowledge.
Levels of lysoPCs and PC ae C30:0 were not related to background factors such as BMI, physical activity, or smoking in our study. While PC ae C30:0 has not been shown to be associated with chronic diseases in previous studies, it may seem noteworthy that lysoPC a C18:2 has been proposed to be a potential pre-diagnostic biomarker of diabetes [32]. At the same time, associations between lysoPC a C18:0 and diabetes risk have not been observed in previous studies [32, 33], and potential mediation of associations between lysoPCs and cancer risk by a pre-diabetic state does therefore not appear to be a valid explanation for the present findings.
A limitation of our study is that only a single blood sample was available; however, reasonable mid-term reliability of metabolite levels over time has been demonstrated in reproducibility studies [34–37]. While we cannot provide data on the stability of the analyzed metabolites in long-term storage at −196 °C, it has been shown that freeze-and-thaw cycles do not substantially affect most metabolites covered by the kit we used [38, 39]. Longer exposure to room temperature, which may indeed lead to an increase of lysoPC levels [38], was avoided in our study, and the plasma samples of case patients and non-cases used for the present metabolomics project have been stored and prepared under exactly the same conditions. Many of the metabolites measured in our project are not part of metabolomics platforms previously used in other studies, which hampers comparisons across studies and underlines the need for standardization [1]. Undoubtedly, replication of the present associations is needed before metabolites such as lysoPC a C18:0 or PC ae C30:0 may eventually be used as cancer biomarkers. Moreover, our findings require further investigation in mechanistic studies, before more definite conclusions on lysoPCs and PC ae C30:0 in tumorigenesis can be drawn.
Conclusion
In summary, we observed consistent associations of lysoPC a C18:0 and PC ae C30:0 concentrations with the risk of three frequent cancer types independent of background factors. Intriguingly, associations in our study did not depend on lag time between blood draw and diagnosis, indicating that low levels of lysoPCs and high levels of PC ae C30:0 are cancer risk factors rather than early markers of disease. The consistency of findings across three cancer types points to global rather than cancer type-specific alterations underlying the observed associations. Further studies are needed to evaluate whether the top hits from our study may have a potential as biomarkers of cancer risk.
Acknowledgements
Guarantor of the article: Tilman Kühn, PhD.
Funding
The present metabolomics project was supported by the Helmholtz Association (portfolio theme “metabolic dysfunction”). The EPIC-Heidelberg study was further supported by the German Federal Ministry of Education and Research (BMBF, grant number 01ER0809). The funders had no involvement in the design of the study, the conduct of the study, or the submission of the manuscript for publication.
Abbreviations
- ATX
autotaxin
- BMI
body mass index
- CI
confidence interval
- EPIC
European Prospective Investigation into Cancer and Nutrition
- FIA-MS/MS
flow injection analysis-tandem mass spectrometry
- HR
hazard ratio
- HRT
hormone replacement therapy
- ICD
International Classification of Diseases
- LC-MS/MS
liquid chromatography-tandem mass spectrometry
- LPA
lysophosphatidic acid
- lysoPC
lysophosphatidylcholine
- NSAID
nonsteroidal anti-inflammatory drug
- PC
phosphatidylcholine
- PITC
phenylisothiocyanate
- QC
quality control
Additional files
Limits of detection, coefficients of variation, and percentages of missing values for individual metabolites. (XLSX 19 kb)
Supplementary main results on hazard ratios of cancer across quartiles of metabolite levels (Table S1 as an extension of Fig. 1 ), results of evaluations of associations between metabolites and cancer risk by lag time (Table S2), and correlations between metabolite concentrations by chemical group (Figure S1). (PDF 586 kb)
Footnotes
Competing interests
The authors have no conflicts of interest to declare.
Authors’ contributions
RK conceived and designed the study. MvB coordinated the laboratory analyses. TJ prepared the samples. MvB and UK-R performed the laboratory analyses. WO and DS pre-processed the data. DS analyzed the data. TK coordinated the statistical analyses and verified the results together with AF. TK wrote the manuscript. All authors critically revised and approved the manuscript.
Contributor Information
Tilman Kühn, Email: t.kuehn@dkfz.de.
Anna Floegel, Email: anna.floegel@dife.de.
Disorn Sookthai, Email: d.sookthai@dkfz.de.
Theron Johnson, Email: t.johnson@dkfz.de.
Ulrike Rolle-Kampczyk, Email: ulrike.rolle-kampczyk@ufz.de.
Wolfgang Otto, Email: wolfgang.otto@ufz.de.
Martin von Bergen, Email: martin.vonbergen@ufz.de.
Heiner Boeing, Email: boeing@dife.de.
Rudolf Kaaks, Email: r.kaaks@dkfz.de.
References
- 1.Liesenfeld DB, Habermann N, Owen RW, Scalbert A, Ulrich CM. Review of mass spectrometry-based metabolomics in cancer research. Cancer Epidemiol Biomarkers Prev. 2013;22(12):2182–201. doi: 10.1158/1055-9965.EPI-13-0584. [DOI] [PMC free article] [PubMed] [Google Scholar]
- 2.Mayers JR, Wu C, Clish CB, Kraft P, Torrence ME, Fiske BP et al. Elevation of circulating branched-chain amino acids is an early event in human pancreatic adenocarcinoma development. 2014;20(10):1193–8. doi:10.1038/nm.3686 [DOI] [PMC free article] [PubMed]
- 3.Mondul AM, Moore SC, Weinstein SJ, Karoly ED, Sampson JN, Albanes D. Metabolomic analysis of prostate cancer risk in a prospective cohort: The alpha-tocolpherol, beta-carotene cancer prevention (ATBC) study. Int J Cancer. 2015;137(9):2124–32. doi: 10.1002/ijc.29576. [DOI] [PMC free article] [PubMed] [Google Scholar]
- 4.Cross AJ, Moore SC, Boca S, Huang WY, Xiong X, Stolzenberg-Solomon R, et al. A prospective study of serum metabolites and colorectal cancer risk. Cancer. 2014;120(19):3049–57. doi: 10.1002/cncr.28799. [DOI] [PMC free article] [PubMed] [Google Scholar]
- 5.Fages A, Duarte-Salles T, Stepien M, Ferrari P, Fedirko V, Pontoizeau C, et al. Metabolomic profiles of hepatocellular carcinoma in a European prospective cohort. BMC Med. 2015;13:242. doi: 10.1186/s12916-015-0462-9. [DOI] [PMC free article] [PubMed] [Google Scholar]
- 6.Riboli E, Hunt KJ, Slimani N, Ferrari P, Norat T, Fahey M, et al. European Prospective Investigation into Cancer and Nutrition (EPIC): study populations and data collection. Public Health Nutr. 2002;5(6B):1113–24. doi: 10.1079/PHN2002394. [DOI] [PubMed] [Google Scholar]
- 7.Boeing H, Wahrendorf J, Becker N. EPIC-Germany--A source for studies into diet and risk of chronic diseases. European Investigation into Cancer and Nutrition. Ann Nutr Metab. 1999;43(4):195–204. doi: 10.1159/000012786. [DOI] [PubMed] [Google Scholar]
- 8.Bergmann MM, Bussas U, Boeing H. Follow-up procedures in EPIC-Germany--data quality aspects. European Prospective Investigation into Cancer and Nutrition. Ann Nutr Metab. 1999;43(4):225–34. doi: 10.1159/000012789. [DOI] [PubMed] [Google Scholar]
- 9.Kulathinal S, Karvanen J, Saarela O, Kuulasmaa K. Case-cohort design in practice - experiences from the MORGAM Project. Epidemiol Perspect Innov. 2007;4:15. doi: 10.1186/1742-5573-4-15. [DOI] [PMC free article] [PubMed] [Google Scholar]
- 10.Langenberg C, Sharp S, Forouhi NG, Franks PW, Schulze MB, Kerrison N, et al. Design and cohort description of the InterAct Project: an examination of the interaction of genetic and lifestyle factors on the incidence of type 2 diabetes in the EPIC Study. Diabetologia. 2011;54(9):2272–82. doi: 10.1007/s00125-011-2182-9. [DOI] [PMC free article] [PubMed] [Google Scholar]
- 11.Römisch-Margl W, Prehn C, Bogumil R, Röhring C, Suhre K, Adamski J. Procedure for tissue sample preparation and metabolite extraction for high-throughput targeted metabolomics. Metabolomics. 2012;8(1):133–42. doi: 10.1007/s11306-011-0293-4. [DOI] [Google Scholar]
- 12.Lazar C, Meganck S, Taminau J, Steenhoff D, Coletta A, Molter C, et al. Batch effect removal methods for microarray gene expression data integration: a survey. Brief Bioinform. 2013;14(4):469–90. doi: 10.1093/bib/bbs037. [DOI] [PubMed] [Google Scholar]
- 13.Hubert M, Rousseeuw PJ, Vanden BK. ROBPCA: a new approach to robust principal component analysis. Technometrics. 2005;47(1):64–79. doi: 10.1198/004017004000000563. [DOI] [Google Scholar]
- 14.Prentice RL. A case-cohort design for epidemiologic cohort studies and disease prevention trials. Biometrika. 1986;73(1):1–11. doi: 10.1093/biomet/73.1.1. [DOI] [Google Scholar]
- 15.Xue X, Xie X, Gunter M, Rohan TE, Wassertheil-Smoller S, Ho GY, et al. Testing the proportional hazards assumption in case-cohort analysis. BMC Med Res Methodol. 2013;13:88. doi: 10.1186/1471-2288-13-88. [DOI] [PMC free article] [PubMed] [Google Scholar]
- 16.Osl M, Dreiseitl S, Pfeifer B, Weinberger K, Klocker H, Bartsch G, Schäfer G, Tilg B, Graber A, Baumgartner C. A new rule-based algorithm for identifying metabolic markers in prostate cancer using tandem mass spectrometry. Bioinformatics. 2008 Dec 15;24(24):2908-14. doi:10.1093/bioinformatics/btn506. Epub 2008 Sep 24. PubMed PMID: 18815183. [DOI] [PubMed]
- 17.Qiu Y, Zhou B, Su M, Baxter S, Zheng X, Zhao X, et al. Mass spectrometry-based quantitative metabolomics revealed a distinct lipid profile in breast cancer patients. Int J Mol Sci. 2013;14(4):8047–61. doi: 10.3390/ijms14048047. [DOI] [PMC free article] [PubMed] [Google Scholar]
- 18.Zhao Z, Xiao Y, Elson P, Tan H, Plummer SJ, Berk M, et al. Plasma lysophosphatidylcholine levels: potential biomarkers for colorectal cancer. J Clin Oncol. 2007;25(19):2696–701. doi: 10.1200/JCO.2006.08.5571. [DOI] [PubMed] [Google Scholar]
- 19.Joo EJ, Weyers A, Li G, Gasimli L, Li L, Choi WJ, et al. Carbohydrate-containing molecules as potential biomarkers in colon cancer. OMICS. 2014;18(4):231–41. doi: 10.1089/omi.2013.0128. [DOI] [PMC free article] [PubMed] [Google Scholar]
- 20.Raynor A, Jantscheff P, Ross T, Schlesinger M, Wilde M, Haasis S, et al. Saturated and mono-unsaturated lysophosphatidylcholine metabolism in tumour cells: a potential therapeutic target for preventing metastases. Lipids Health Dis. 2015;14(1):69. doi: 10.1186/s12944-015-0070-x. [DOI] [PMC free article] [PubMed] [Google Scholar]
- 21.Chajes V, Hulten K, Van Kappel AL, Winkvist A, Kaaks R, Hallmans G, et al. Fatty-acid composition in serum phospholipids and risk of breast cancer: an incident case–control study in Sweden. Int J Cancer. 1999;83(5):585–90. doi: 10.1002/(SICI)1097-0215(19991126)83:5<585::AID-IJC2>3.0.CO;2-Z. [DOI] [PubMed] [Google Scholar]
- 22.Houben AJ, Moolenaar WH. Autotaxin and LPA receptor signaling in cancer. Cancer Metastasis Rev. 2011;30(3–4):557–65. doi: 10.1007/s10555-011-9319-7. [DOI] [PubMed] [Google Scholar]
- 23.Panupinthu N, Lee HY, Mills GB. Lysophosphatidic acid production and action: critical new players in breast cancer initiation and progression. Br J Cancer. 2010;102(6):941–6. doi: 10.1038/sj.bjc.6605588. [DOI] [PMC free article] [PubMed] [Google Scholar]
- 24.Liu S, Murph M, Panupinthu N, Mills GB. ATX-LPA receptor axis in inflammation and cancer. Cell Cycle. 2009;8(22):3695–701. doi: 10.4161/cc.8.22.9937. [DOI] [PMC free article] [PubMed] [Google Scholar]
- 25.Abdelzaher E, Mostafa MF. Lysophosphatidylcholine acyltransferase 1 (LPCAT1) upregulation in breast carcinoma contributes to tumor progression and predicts early tumor recurrence. Tumour Biol. 2015;36(7):5473–83. doi: 10.1007/s13277-015-3214-8. [DOI] [PubMed] [Google Scholar]
- 26.Grupp K, Sanader S, Sirma H, Simon R, Koop C, Prien K, et al. High lysophosphatidylcholine acyltransferase 1 expression independently predicts high risk for biochemical recurrence in prostate cancers. Mol Oncol. 2013;7(6):1001–11. doi: 10.1016/j.molonc.2013.07.009. [DOI] [PMC free article] [PubMed] [Google Scholar]
- 27.Mansilla F, da Costa KA, Wang S, Kruhoffer M, Lewin TM, Orntoft TF, et al. Lysophosphatidylcholine acyltransferase 1 (LPCAT1) overexpression in human colorectal cancer. J Mol Med (Berl) 2009;87(1):85–97. doi: 10.1007/s00109-008-0409-0. [DOI] [PMC free article] [PubMed] [Google Scholar]
- 28.Vouk K, Hevir N, Ribic-Pucelj M, Haarpaintner G, Scherb H, Osredkar J, et al. Discovery of phosphatidylcholines and sphingomyelins as biomarkers for ovarian endometriosis. Hum Reprod. 2012;27(10):2955–65. doi: 10.1093/humrep/des152. [DOI] [PubMed] [Google Scholar]
- 29.Doria ML, Cotrim CZ, Simoes C, Macedo B, Domingues P, Domingues MR, et al. Lipidomic analysis of phospholipids from human mammary epithelial and breast cancer cell lines. J Cell Physiol. 2013;228(2):457–68. doi: 10.1002/jcp.24152. [DOI] [PubMed] [Google Scholar]
- 30.He M, Guo S, Li Z. In situ characterizing membrane lipid phenotype of breast cancer cells using mass spectrometry profiling. Sci Rep. 2015;5:11298. doi: 10.1038/srep11298. [DOI] [PMC free article] [PubMed] [Google Scholar]
- 31.Trock BJ. Application of metabolomics to prostate cancer. Urol Oncol. 2011;29(5):572–81. doi: 10.1016/j.urolonc.2011.08.002. [DOI] [PMC free article] [PubMed] [Google Scholar]
- 32.Klein MS, Shearer J. Metabolomics and type 2 diabetes: translating basic research into clinical application. J Diabetes Res. 2016;2016:3898502. doi: 10.1155/2016/3898502. [DOI] [PMC free article] [PubMed] [Google Scholar]
- 33.Suhre K. Metabolic profiling in diabetes. J Endocrinol. 2014;221(3):R75–85. doi: 10.1530/JOE-14-0024. [DOI] [PubMed] [Google Scholar]
- 34.Floegel A, Drogan D, Wang-Sattler R, Prehn C, Illig T, Adamski J, et al. Reliability of serum metabolite concentrations over a 4-month period using a targeted metabolomic approach. PLoS One. 2011;6(6):e21103. doi: 10.1371/journal.pone.0021103. [DOI] [PMC free article] [PubMed] [Google Scholar]
- 35.Carayol M, Licaj I, Achaintre D, Sacerdote C, Vineis P, Key TJ, et al. Reliability of serum metabolites over a two-year period: a targeted metabolomic approach in fasting and non-fasting samples from EPIC. PLoS One. 2015;10(8):e0135437. doi: 10.1371/journal.pone.0135437. [DOI] [PMC free article] [PubMed] [Google Scholar]
- 36.Sampson JN, Boca SM, Shu XO, Stolzenberg-Solomon RZ, Matthews CE, Hsing AW, et al. Metabolomics in epidemiology: sources of variability in metabolite measurements and implications. Cancer Epidemiol Biomarkers Prev. 2013;22(4):631–40. doi: 10.1158/1055-9965.EPI-12-1109. [DOI] [PMC free article] [PubMed] [Google Scholar]
- 37.Townsend MK, Clish CB, Kraft P, Wu C, Souza AL, Deik AA, et al. Reproducibility of metabolomic profiles among men and women in 2 large cohort studies. Clin Chem. 2013;59(11):1657–67. doi: 10.1373/clinchem.2012.199133. [DOI] [PMC free article] [PubMed] [Google Scholar]
- 38.Anton G, Wilson R, Yu ZH, Prehn C, Zukunft S, Adamski J, et al. Pre-analytical sample quality: metabolite ratios as an intrinsic marker for prolonged room temperature exposure of serum samples. PLoS One. 2015;10(3):e0121495. doi: 10.1371/journal.pone.0121495. [DOI] [PMC free article] [PubMed] [Google Scholar]
- 39.Breier M, Wahl S, Prehn C, Fugmann M, Ferrari U, Weise M, et al. Targeted metabolomics identifies reliable and stable metabolites in human serum and plasma samples. PLoS One. 2014;9(2):e89728. doi: 10.1371/journal.pone.0089728. [DOI] [PMC free article] [PubMed] [Google Scholar]