Abstract
The surface characteristics and electrochemical properties of bioactive coatings produced by plasma electrolytic oxidation (PEO) with calcium, phosphorous, silicon and silver on commercially pure titanium were evaluated. PEO treatment produced a porous oxide layer, which improved the surface topography, and enriched the surface chemistry with bioactive elements, responsible for mimicking bone surface. The surfaces with higher calcium concentration presented antibacterial and biocompability properties with better responses for corrosion and barrier properties, due to the presence of rutile crystalline structure. PEO may be a promising surface treatment option to improve the electrochemical behavior of dental implants mitigating treatment failures.
Keywords: A. Titanium, B. EIS, C. Anodic Films, C. Oxidation, C. Oxide Coatings
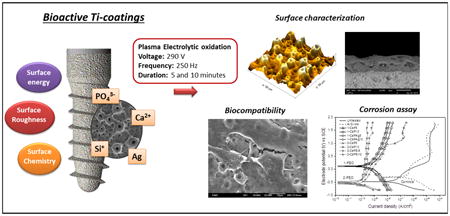
Graphical abstract
1. Introduction
Titanium (Ti) and its alloys are the most common used implant materials for medical and dental applications due to their biocompatibility and corrosion resistance [1, 2]. A thin oxide layer is normally formed on the substrate when exposed to air, but no strong bond is formed between them. The oxide film can be destroyed and materials can degrade when exposed to oral environment due to its constant chemical and mechanical changing, which induces the corrosion process [3, 4]. This electrochemical instability can affect the biocompatibility of dental implants and lead to failure of osseointegration [5].
Different surface treatments have been developed to overcome this drawback. Plasma Electrolytic Oxidation (PEO) is one effective technique. It consists of an electrochemical process of oxidation to create ceramic-like bioactive coatings on Ti and its alloys when voltages higher than those used in conventional anodization process are employed [6-8]. As this coating is formed by a convertion of metal substrate into its oxide, the bonding to the substrate may be stronger than those observed with coatings produced by other techniques [9]. Further, this technique promotes the formation of micropores on the surface. This allows the different chemical elements such as calcium (Ca), phosphorous (P), silicon (Si) and silver (Ag) to be incorporated onto the surface. These novel surfaces can improve the biological response by promoting increased bone-implant contact, improving the osseointegration and the bioactivity of the surface [10-12], and providing antibacterial function [13]. The pore size and the coating type formed on the material may vary with the electrolyte solution, the time of surface treatment employed and with the system voltage and frequency [7]. Further, it is important to prepare bioactive surfaces that mimic the native bone tissue by modifying the Ca/P ratio as close as possible to the hydroxyapatite (1.67), a natural mineral phase in bone [14, 15].
Another advantage of PEO procedure is that anatase and rutile cristallyne structures can be formed on the porous oxide layers. These crystal phases of oxide layer have a significant role on surface characteristics. Anatase has great contribution for bone compatibility and rutile has an important role on corrosion resistance [16, 17]. It is imperative to investigate ideal film process parameters to develop better surface characteristics, such as enhanced mechanical properties, surface roughness, corrosion and wear resistance and biocompatibility [16].
Some in vitro [13] and in vivo [18] studies have been performed to evaluate PEO coatings. The results showed improved bone healing during osseointegration process and the bioactivity of Ti [8, 13, 18]. However, the literature on the corrosion behavior of the oxide layers formed on commercially pure titanium (cp-Ti) using electrolytes mixed with Ca, P, Si and Ag are scarce [8, 19, 20]. A comprehensive investigation is needed for a complete understanding of the coating formation, characterization and corrosion resistance behavior.
Therefore, the aims of the present study were (i) to create and characterize bioactive Ti-coatings doped with Ca, P, Si and Ag produced by plasma electrolytic oxidation (PEO) to improve biological, chemical and mechanical properties for implants surfaces, (ii) to investigate the corrosion behavior of cp-Ti treated with PEO with different Ca/P proportions and incorporation of Si and Ag and (iii) to evaluate antibacterial and biocompability properties.
2. Materials and methods
Cp-Ti discs (American Society for Testing of Materials - Grade II) (MacMaster Carr) with 15 mm in diameter and 2 mm thickness were ground with #320, #400, and #600 SiC abrasive paper (Carbimet 2, Buehler). The composition in wt% of cp-Ti was Ti (99.7), C (0.006), Fe (0.12), O2 (0.16), N2 (0.004), and H2 (0.0019) [4, 21].
The experimental design of this study (Figure 1) consists of 2 main groups for PEO treatment, 1-PEO and 2-PEO, according to the electrolytes main composition (Ca and P) and control groups. For each electrolyte, the PEO treatment duration was set up either in 5 or 10 minutes. Two control groups were considered in the present study: a Ti surface (Untreated) polished as described above and a sandblasted, large-grit, acid-etched surface (Al oxide). The second control group was used to compare the proposed surface treatment to a well stablished surface treatment.
Figure 1.
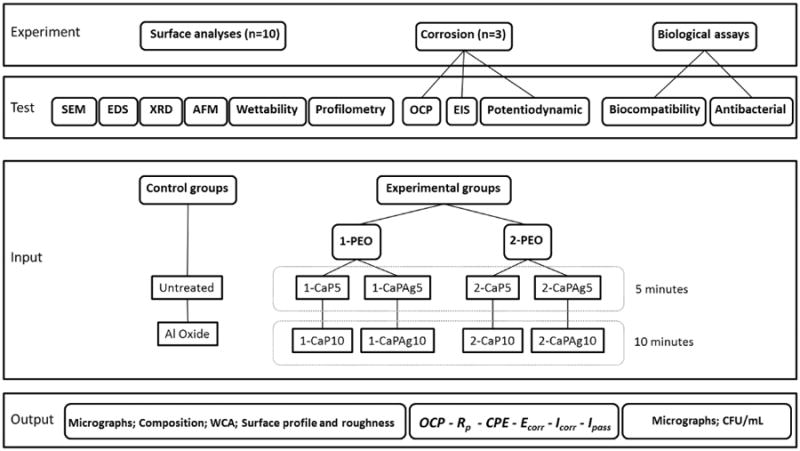
Schematic diagram of the experimental design of the present study.
For the Al oxide group, the discs were sandblasted with aluminum oxide particles of 150 μm at a distance of 50 mm and an angle of 90°. The air pressure used was 0.45 MPa for 30 seconds [22]. Subsequently, the discs were washed in an ultrasonic bath containing distilled water for 15 minutes and allowed to dry at room temperature. Subsequently, the surface of the discs were etched by a mixture of 0.1 mol/L of HCl and 8.8 mol/L of H2O2 at a temperature of 80° for 20 minutes and then rinsed in distilled water and oven dried at 50° C for 12 hours and finally heated in air at 400° C for 1 hour and cooled in an electric oven [23]. The discs were washed in distilled water and vacuum dried.
2.1. Preparation of plasma electrolytic oxidation ceramic coatings
Prior to Plasma Electrolytic Oxidation (PEO) treatment, the specimens were washed and degreased with acetone, alcohol and distilled water for 10 minutes each in an ultrasonic bath and then air dried. PEO treatment was carried out for 5 and 10 min using a pulsed DC power supply (Plasma Technology Ltd). The treatment was performed in a stainless steel beaker with re-circulating cooling system that maintained the temperature of the electrolyte at approximately 20°C. This electrolytic solution container was used as cathode while titanium discs were placed in the electrolytic cell as the anode. The specimen holder was designed to allow complete exposure of the sample to the electrolyte. The voltage, frequency and duty cycle were set at 290 V, 250 Hz, 60% respectively. The electrochemical treatments were performed using four different electrolytes and two different treatment duration (5 and 10 minutes) resulting in 8 experimental groups. All PEO treated surfaces were generated in the electrolyte based on calcium acetate (Ca(CH3CO2)2) (Sigma-Aldrich) and glycerophosphate disodium (C3H7Na2O6P) with different Ca/P concentrations (higher-0.3M/0.02M and lower-0.1M/0.03M). The first main solution with higher Ca/P ratio (1-PEO) generated four groups with or without Ag incorporation by dissolving Ag nanoparticles (Sigma-Aldrich) in the electrolyte (1-CaP5, 1-CaP10, 1-CaPAg5, 1-CaPAg10). The second main solution with lower Ca/P ratio (2-PEO) also generated four groups with the incorporation or not of Si, by adding sodium silicate (Na2SiO3) (Vetec Quimica Fina Ltda) in the electrolyte (2-CaP5, 2-CaP10, 2-CaPSi5 and 2-CaPSi10) (Figure 1). More details can be found in Table 1. After PEO, the samples were rinsed with deionized water and air dried.
Table 1.
Parameters of the electrolytes used for PEO treatment.
| Experimental groups | Ca(CH3CO2)2 | C3H7Na2O6P | Na2SiO3 | Ag | Treatment duration (min) | |
|---|---|---|---|---|---|---|
| 1-PEO | 1-CaP5 | 0.3 M | 0.02 M | 5 | ||
| 1-CaP10 | 0.3 M | 0.02 M | 10 | |||
| 1-CaPAg5 | 0.3 M | 0.02 M | 0.62 g/L | 5 | ||
| 1-CaPAg10 | 0.3 M | 0.02 M | 0.62 g/L | 10 | ||
| 2-PEO | 2-CaP5 | 0.1 M | 0.03 M | 5 | ||
| 2-CaP10 | 0.1 M | 0.03 M | 10 | |||
| 2-CaPSi5 | 0.1 M | 0.03 M | 0.04 M | 5 | ||
| 2-CaPSi10 | 0.1 M | 0.03 M | 0.04 M | 10 | ||
2.2 Surface characterization
The surface roughness (n=10) parameter Ra of cp-Ti was measured using a profilometer (Dektak D150; Veeco). Three measurements of 500 μm length were performed at different areas during 12 seconds on each disc for each PEO condition and the mean value was calculated. The wettability (n=10) was evaluated from water contact angle measurements using deionized water as test liquid and an automatic goniometer (Ramé-Hart Instrument Co. 0.100-00). The phase composition of the coatings was determined by a X-ray diffractometer (XRD; X′ Pert Powder) using Cu-Kα radiation (λ = 1,540598 Å) at 45 kV and 40 mA. The coatings morphologies were observed with scanning electron microscopy (SEM; JEOL JSM-6010LA) and the chemical composition was evaluated with an energy dispersive X-ray spectroscopy (EDS) device attached to the SEM. Three different regions were selected to perform the EDS analysis, the surface (top) and two points in the cross-section (middle and bottom) in order to have a better understanding of elements distribution in the treatment layer. Three-dimensional images (50 × 50 μm2) were taken to observe the topographies and profile of all surfaces using atomic force microscope (AFM, 5500 AFM/SPM, Agilent Technologies). A non-contact mode was used and two distinct areas of the samples were chosen for profile analysis to get the depth of the porous. Gwyddion software was used for image processing.
2.3 Electrochemical test
A potentiostat (G300, Gamry Inc.) was used to perform the corrosion measurements with a standardized method of three-electrode cell as per American Society for Testing of Materials guidelines (G61-86 and G31-72). A saturated calomel electrode (SCE) was used as the reference electrode, a graphite rod as a counter electrode, the exposed surface of the cp-Ti disc as a working electrode and artificial saliva (10 mL) as an electrolyte solution. The chemical composition for the artificial saliva was KCl (0.4 g/L), NaCl (0.4 g/L), CaCl2.2H2O (0.906 g/L), NaH2PO4.2H2O (0.690 g/L), Na2S.9H2O (0.005 g/L), and Urea (1.0 g/L), based on previous studies [21, 24]. The exposed area was determined by AFM analysis for all groups (Untreated = 0.39 cm2, Al Oxide = 0.48 cm2, 1-PEO = 0.45 cm2, 2-PEO = 0.42 cm2). The electrolyte temperature was maintained at 37 ± 1°C and pH 6.5 to mimic the oral environment. A specific protocol was followed in the electrochemical testing [4]. Initially, the discs were subjected to a cathodic potential (-0.9 V vs. SCE) for 10 min to standardize the starting conditions in terms of oxide layer thickness for all samples, through electrochemical cleaning process. The open circuit potential (OCP) was monitored for a period of 3600s to evaluate the free corrosion potential of the material in the electrolyte solution. When sample OCPs reached stable values over time, EIS was acquired at frequencies between 105 and 10−2 Hz with amplitude of the sinusoidal voltage signal of 10 mV and OCP as initial potential to observe the permeability of electrolyte through the coating and to evaluate the passive layer. The values were used to determine the real (Z′) and imaginary (Z″) components of Impedance, which were used to construct Nyquist, Bode (|Z|) and phase angle plots. The EIS data were analyzed using Echem Analyst Software from Gamry and were fit to appropriate equivalent electrical circuit in order to quantify the corrosion process of the oxide layer (Rp – polarization resistance and CPE – constant phase element).
Finally, the samples were polarized from -0.8 V to 1.8 V (2 mV/s scan rate). Such high potential was achieved, due to the possibility of failure prediction and the dynamic behavior evaluation, particularly in a case of current study when surface modifications are involved. Furthermore, as the polarization curves were obtained as last step in the electrochemical protocol, the previous tests would not be influenced. The scan rate of 2 mV/s was selected based on initial experiments, in which it was found as an optimal sweep rate. Corrosion parameters Ecorr (corrosion potential), Icorr (corrosion current density), Ipass (passivation current density) and Tafel slopes (bc, ba) were obtained from the polarization curves by Tafel extrapolation method using electrochemical software (Echem Analyst Software, Gamry). Ipass was obtained by measuring the current density value of the passivation region of the polarization plot. All tests were repeated at least three times to ensure reliability and reproducibility.
2.4. Biological characterization
2.4.1. Biocompatibility assay
All samples were sterilized in ethylene oxide gas prior to the tests. After sterilization, the discs were cultured with Human Mesenchymal Stem Cells (hMSCs) provided by Tulane University. HMSCs were incubated in Dulbecco's Modified Eagle Medium (Hyclone, GE Healthcare Life Sciences) supplemented with 10% fetal bovine serum (Gibco, Life Technologies), 1% antibiotics (penicillin-streptomycin) (Gibco, Life Technologies) at 37°C in a humidified atmosphere of 5% CO2/air. Every three days the culture medium was replaced. After reaching 70-80% of confluence, the cells were detached using trypsin-EDTA (Gibco, Life Technologies), centrifuged and re-suspended in culture medium for seeding over the sterilized samples at a density of 1.3 × 10⁵ cells/mL. Cells at the forth passage were used for experiments.
Field Emission Scanning Electron Microscope (FESEM, JEOL, JSM-6320F) and Fluorescence Microscope (Leica DMI6000 B, Leica) were used to evaluate the surfaces biocompability by focusing on the cells response and morphology after 6 days of culture. Following the FESEM observation protocol, all surfaces were washed twice with PBS, fixated with 2% glutaraldehyde in sodium cacodylate buffer (pH 7.4) and gradually dehydrated with gradient ethanol solution, critical-point dried and sputter-coated with gold in sequence. For fluorescence analysis, the cells were washed in PBS, fixed with 3.7% formaldehyde for 20 min and permeabilized in 0.05% triton ×100 in PBS for 15 min. The cell cytoskeleton and nucleus were stained with ActinRed™ 555 ReadyProbes® Reagent (Molecular Probes, Life Technologies) and NucBlue® Fixed Cell ReadyProbes® Reagent (Molecular Probes, Life Technologies) respectively. As final step, the samples were washed in PBS twice again before imaging.
2.4.2. Antibacterial activity
2.4.2.1. Bacterial strain and growth condition
In this study, Streptococcus sanguinis reference strain (IAL 1832) was used and maintained as frozen stocks with 20% glycerol at -80°C. A mixture of 100 μL of stock culture and 5 mL of brain hearth infusion (BHI) broth (Difco Laboratories, Becton, Dickinson and Company) supplemented with 1% of glucose and incubated overnight in 10% CO2 (v/v) at 37°C without agitation was obtained. Afterwards, 1 mL of the growth medium was transferred to 9 mL of BHI broth supplemented with 1% of glucose for 6 h (exponential growth phase) in 10% CO2 (v/v) at 37°C. Then, S. sanguinis cells were harvested by centrifugation (6,000 g for 5 min at 4°C), washed twice with 0.9% NaCl and suspended with BHI broth. A final concentration of 107 cells/mL was adjusted by a spectrophotometer (Spectronic 20; Bausch & Lomb) at 600 nm (OD = 1±0.02). A pilot study was conducted to prove such concentration of cells.
2.4.2.2. Biofilm formation
All samples were coated with human saliva pellicle prior to biofilm development to simulate the oral cavity. Stimulated human saliva was provided by two healthy volunteers. The Ethics Committee in Research of the Piracicaba Dental School – Univ of Campinas (UNICAMP) approved this study and certified that the recommendations of the National Health Council - Ministry of Health of Brazil for research in human subjects were followed.
The pool of saliva was centrifuged under 10000 g during 10 min at 4°C. The supernatant was filter-sterilized and immediately used. Under aseptic conditions, the discs were horizontally placed individually into a 24-well culture plate containing 1 mL of saliva and incubated under agitation for 2 h at 37°C to allow the formation of salivary pellicle. Afterwards, the discs were transferred to another 24-well culture plate containing 100 μL of S. sanguinis cell suspension (107 cells/mL) and 900 μL of BHI broth supplemented with 1% glucose and incubated at 37°C, in 10% CO2 (v/v), for 1.5 h (adhesion phase).
Finally, the discs were washed with 2 mL of 0.9% NaCl to remove non-adherent cells, transferred to 24-well culture plate containing fresh BHI broth supplemented with 1% glucose and incubated under microaerophilic (10% CO2) conditions at 37°C during 24 h. All assays were performed independently 2 times in triplicate (2 × 3 = 6 − n value).
2.4.2.3. Number of viable cells
The suspension of the bacterial cells (planktonic cells) were serially diluted in 0.9% NaCl, and 20 μL samples were plated in quadruplicate onto Trypticase Soy Broth (Difco Laboratories) with agar. The plates were incubated at 37°C in 10% CO2 and after 24 h, the number of colony forming units per mL was enumerated.
2.5. Statistical analysis
All analyses were conducted using statistical software (SPSS v. 20.0; SPSS Inc.). One way ANOVA test was used to determine the differences among groups and Tukey HSD test was used as a post hoc technique for multiple-comparison. For all analyses, the differences were considered to be significant if p ≤ 0.05.
3. Results
3.1 Surface characterization
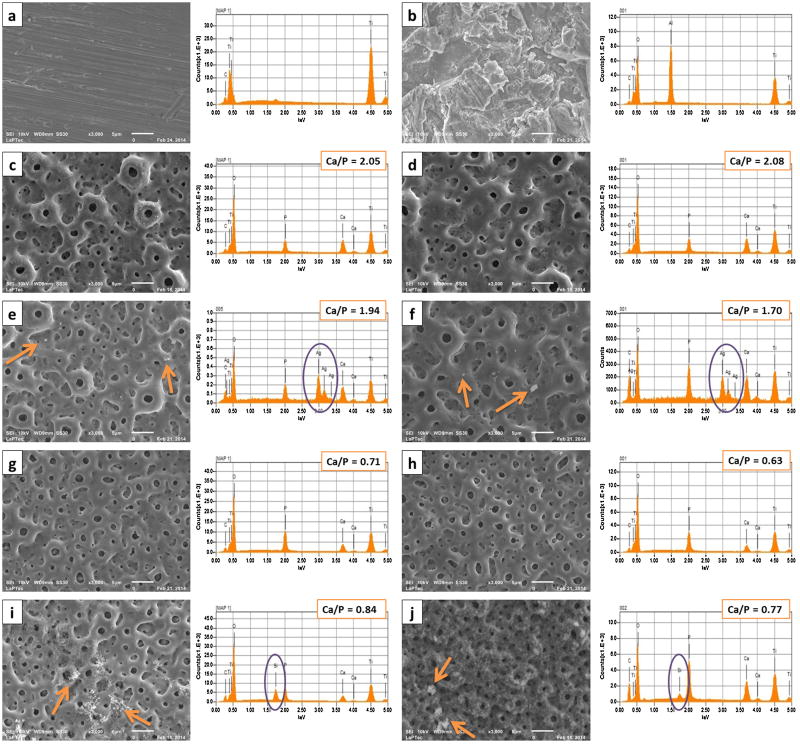
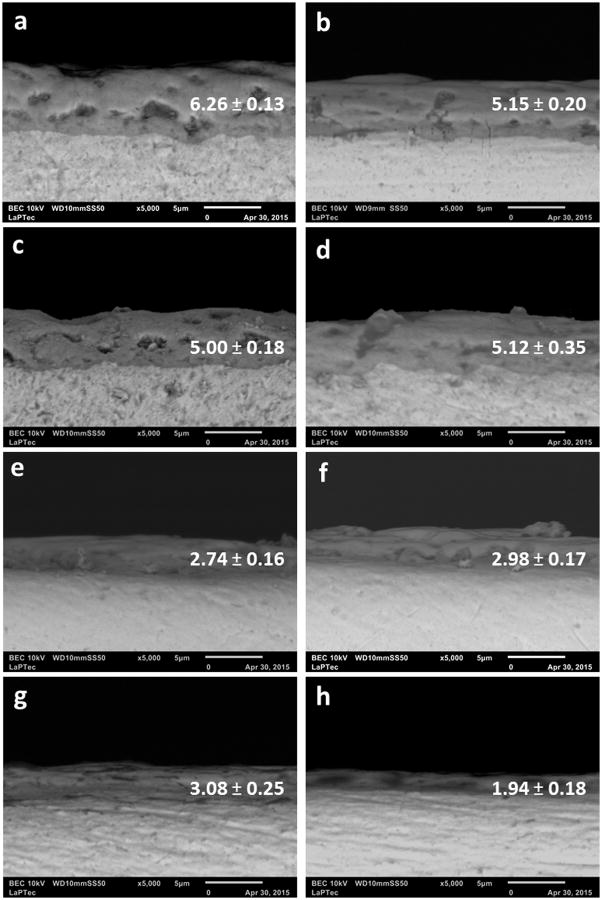
SEM micrographs showed the morphologies of the as-received and modified samples (Figure 2). The presence of porous on the anodized surfaces in contrast with the smooth surface of the untreated control group can be noted. There was a slight difference on the porous size and interpore distances on surfaces with different Ca/P ratios. The 1-PEO treated groups presented an anodic film with larger porous size, similar to craters (volcano appearance) and wide interpore distances. Figure 3 shows the cross-sectional SEM images of all PEO coatings. The oxide layers thicknesses estimated based on the cross-section micrographs range from 5 to 6.26 μm for higher Ca concentration groups (1-PEO) and from 1.94 to 3.08 μm for lower Ca concentration groups (2-PEO). The thickness of the oxide layers was found to be related to the composition of the electrolytic bath, as Ca concentration, and not being related to the treatment duration.
Figure 2.
SEM micrographs and EDS spectra with Ca/P ratios found in the surface of all studies groups. a) Untreated; b) Al Oxide; c) 1-CaP5; d) 1-CaP10; e) 1-CaPAg5; f) 1-CaPAg10; g) 2-CaP5; h) 2-CaP10; i) 2-CaPSi5 and j) 2-CaPSi10.
Figure 3.
Representative SEM micrographs of the oxide layer cross-section of all PEO treated groups: a) 1-CaP5; b) 1-CaP10; c) 1-CaPAg5; d) 1-CaPAg10; e) 2-CaP5; f) 2-CaP10; g) 2-CaPSi5 and h) 2-CaPSi10. Average thickness values (μm) of the films are presented accordingly.
The atomic concentration of each element of the coatings determined by EDS is summarized in Table 2. The following elements were identified in the anodic films: Ti, O, Ca, P, Si, Ag and C, according to each electrolyte composition. According to these results, oxygen was a dominant component of the coatings, in which a higher content was observed in the cross-section region (more than 70%) when compared to the top surface (≈50%). The opposite was noted for Ti distribution, with more concentration in the top area. Regarding Ca and P concentration, it is noticeable that the deeper in the film, the less calcium and more phosphorus can be found. So that, in the bottom the P content is higher than Ca content. A higher Ca/P ratio in the surface was found for higher Ca concentration in the electrolyte (1-PEO), leading to values close to the hydroxyapatite (1.67). Ag nanoparticles were distributed on the surface and were not found in inner layers. White spots were randomly probed to perform a careful EDS analysis on the surfaces (Figure 2 g and h) that revealed the presence of Ag. The two groups containing Si in the electrolyte (2-CaPSi5 and 2-CaPSi10) presented a feature peak of Si in the three regions (Figure 2i and j), indicating that Si was successfully introduced into the coating.
Table 2.
Elemental Composition (in at. %) of the top (surface), middle and bottom (cross-section) region of the oxide layers evaluated from EDS analysis for all groups.
| Groups | Oxide layer depth | Element (at%) | ||||||
|---|---|---|---|---|---|---|---|---|
|
| ||||||||
| Ti | O | Ca | P | Al | Ag | Si | ||
| Untreated | Top | 100 | - | - | - | - | - | |
|
| ||||||||
| Al oxide | Top | 34.48 | 48.33 | - | - | 17.19 | - | - |
|
| ||||||||
| Top | 28.16 | 56.85 | 9.86 | 5.13 | - | - | - | |
| 1-CaP5 | Middle | 22.35 | 72.87 | 2.89 | 1.88 | - | - | - |
| Bottom | 23.47 | 73.03 | 1.05 | 2.45 | - | - | - | |
|
| ||||||||
| Top | 27.9 | 56.48 | 10.21 | 5.41 | - | - | - | |
| 1-CaP10 | Middle | 21.11 | 73.8 | 3.8 | 1.29 | - | - | - |
| Bottom | 21.41 | 74.3 | 1.21 | 3.08 | - | - | - | |
|
| ||||||||
| Top* | 31.08 | 53.63 | 9.84 | 4.83 | - | 0.62 | - | |
| 1-CaPAg5 | Middle | 21.27 | 74.24 | 3.09 | 1.41 | - | - | - |
| Bottom | 20.66 | 76.66 | 0.57 | 2.11 | - | - | - | |
|
| ||||||||
| Top* | 23.69 | 52.5 | 14.1 | 8.64 | - | 1.07 | - | |
| 1-CaPAg10 | Middle | 18.62 | 74.94 | 5.01 | 1.42 | - | - | - |
| Bottom | 19.69 | 77.03 | 0.76 | 2.52 | - | - | - | |
|
| ||||||||
| Top | 26.42 | 58.65 | 6.41 | 8.52 | - | - | - | |
| 2-CaP5 | Middle | 15.74 | 78.41 | 1.76 | 4.1 | - | - | - |
| Bottom | 15.89 | 74.89 | 3.45 | 5.77 | - | - | - | |
|
| ||||||||
| Top | 27.01 | 58.96 | 5.66 | 8.37 | - | - | - | |
| 2-CaP10 | Middle | 16.44 | 74.22 | 3.67 | 5.68 | - | - | - |
| Bottom | 17.2 | 77.24 | 2.3 | 3.26 | - | - | - | |
|
| ||||||||
| Top | 26.76 | 58.21 | 4.92 | 5.74 | - | - | 4.37 | |
| 2-CaPSi5 | Middle | 17.25 | 74.52 | 2.38 | 3.16 | - | - | 2.69 |
| Bottom | 19.77 | 72.94 | 1.94 | 4.25 | - | - | 1.11 | |
|
| ||||||||
| Top | 26.55 | 58.54 | 5.45 | 5.65 | - | - | 3.81 | |
| 2-CaPSi10 | Middle | 15.54 | 74.91 | 1.85 | 3.07 | - | - | 4.63 |
| Bottom | 18.87 | 74.62 | 1.27 | 3.13 | - | - | 2.12 | |
EDS analysis performed at randomly white spots on the Ag containing surfaces.
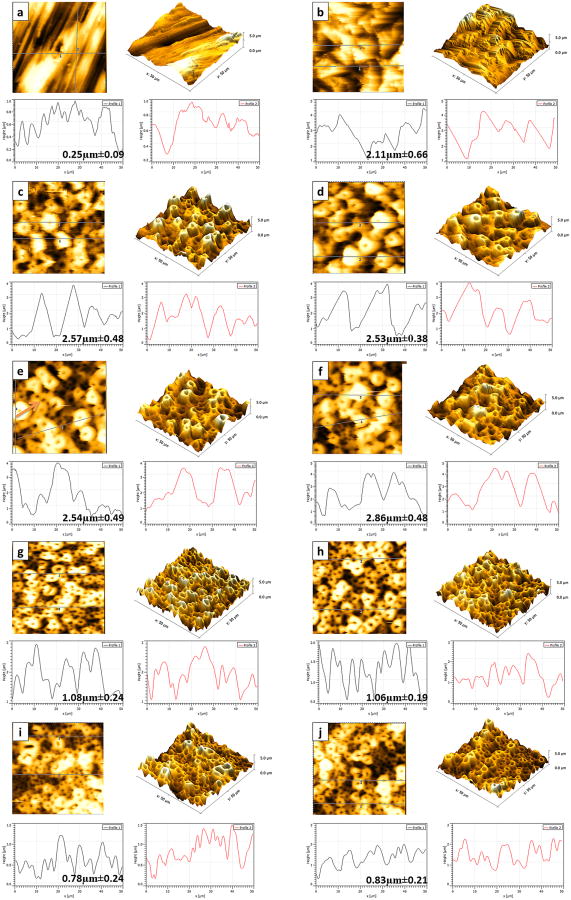
AFM images are presented in Figure 4. Different profiles were noted when different concentrations were considered; the higher the Ca concentration, the deeper the porous valleys were observed. The average Ra roughness of all the groups is presented in Figure 5. All treated surfaces presented rougher surfaces than the untreated group (p<.05), and Al oxide samples presented the roughest surface (p<.001). Furthermore, there is a slight difference between the roughness of 1-PEO and 2-PEO groups, but not statistically significant for all of them.
Figure 4.
AFM 2D and 3D images of topographies and profiles (with mean and stand deviation of porous depth values) of all studied surfaces: a) Untreated; b) Al Oxide; c) 1-CaP5; d) 1-CaP10; e) 1-CaPAg5; f) 1-CaPAg10; g) 2-CaP5; h) 2-CaP10; i) 2-CaPSi5; and j) 2-CaPSi10.
Figure 5.
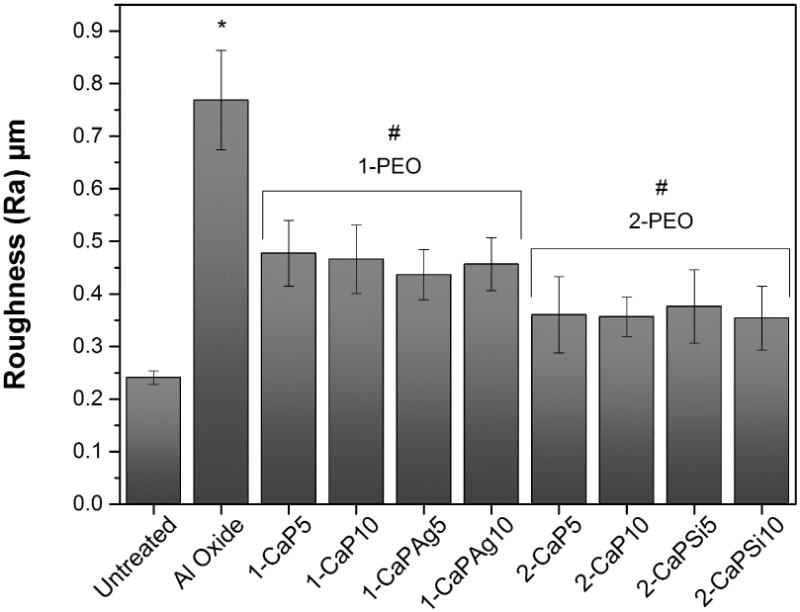
Average roughness (Ra) and standard deviation of control groups and PEO treated surfaces. #Indicates significant difference for 1-PEO and 2-PEO when compared to untreated and Al oxide groups (p<.05). *Indicates a statistically significant difference of p<.001 when compared to all groups.
The phase composition of the oxides formed on cp-Ti surface was analyzed through X-ray diffraction. The analysis revealed that all PEO treated groups presented a crystalline structure on the oxide layer. Anatase phase was obtained in all PEO treated groups (Figure 6), while rutile phase was observed only in the 1-PEO groups.
Figure 6.
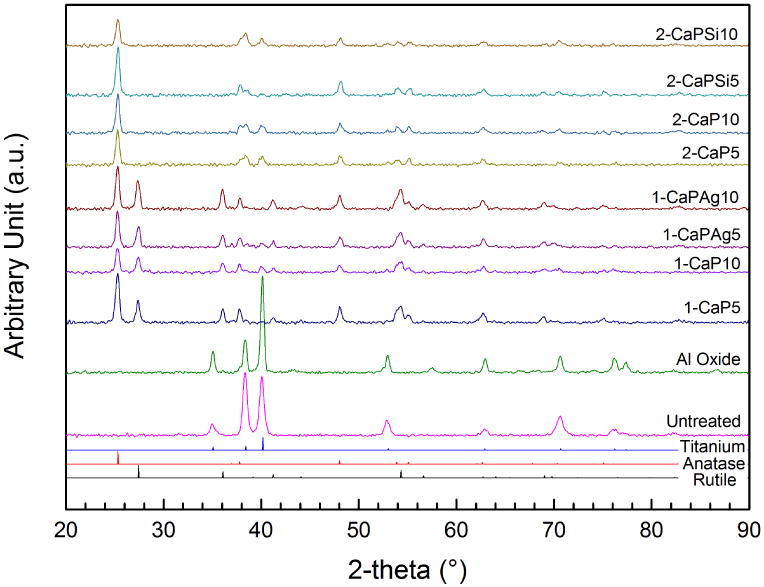
XRD pattern obtained from all studied groups, controls and PEO treated.
The hydrophilicity of the surfaces was assessed by the water contact angle measurements (Figure 7). Based on the results, treated groups yielded lower water contact angles values compared to untreated one (p<.001), wherein Al oxide samples presented the lowest values (p<.001) and there is not any noticeable difference between the samples with both Ca/P ratios.
Figure 7.
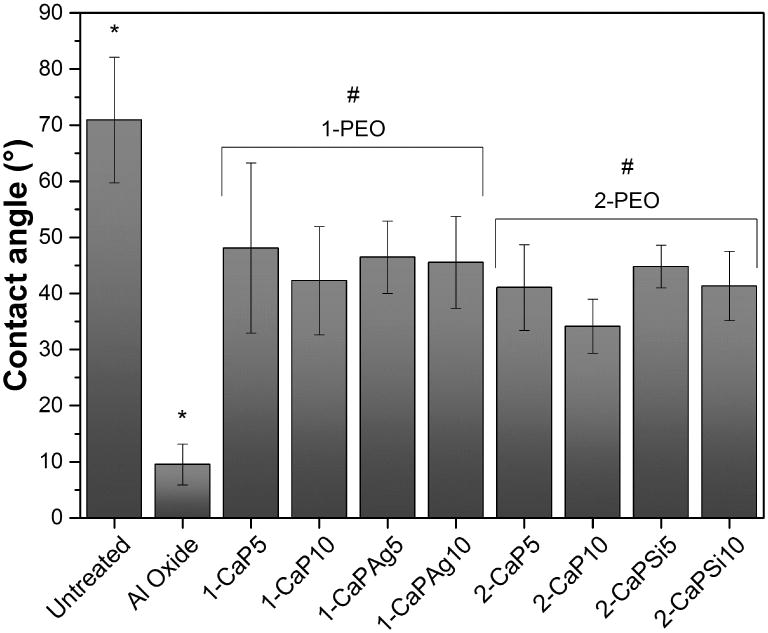
WCA of all groups, controls and PEO treated. #Indicates significant difference for 1-PEO and 2-PEO when compared to untreated and al oxide groups (p<.05). *Indicates a statistically significant difference of p<.001 when compared to all groups.
3.2 Electrochemical data
3.2.1. Open Circuit Potential
Figure 8 shows the evolution in open circuit potentials (OCP) of all groups in artificial saliva at 37°C as a function of time. All PEO groups presented higher OCP values (-160 mV up to 207 mV vs. SCE) than that of untreated group (-263 mV vs. SCE). The 1-PEO groups showed better results, reaching values up to 470 mV (SCE) higher than that measured with untreated samples, which suggests improvement of the corrosion tendency (tending to noble electrochemical potential) due to formation of a protective and stable oxide film on the surface.
Figure 8.
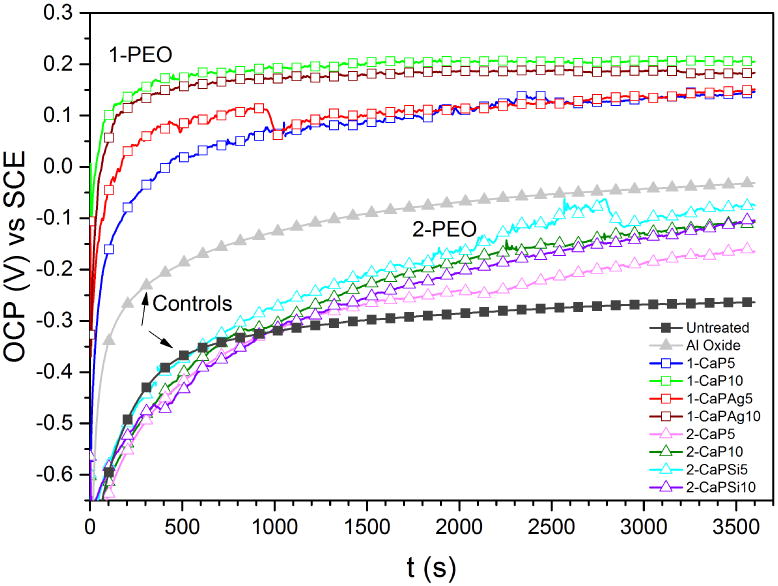
Open circuit potentials (OCP) for all the studied groups immersed in artificial saliva at 37°C for 1 h.
3.2.2. Impedance data
Figure 9 shows equivalent circuits used for simulation of the electrical parameters of the surface. The values of chi-square (χ2) obtained were of the order of 10-3-10-4, which indicates good agreement between the experimental and the simulated data. Rp, CPE (represented as Q), Wdiff (Warburg diffusion element) as corresponding electrical parameters obtained from the EIS data are shown in Table 3. Polarization resistance values were higher for all PEO treated groups (p<.05), with a significant difference of p<.001 for 1-CaP10. Therefore, following similar trend, capacitance values were lower for all PEO treated groups (p<.001).
Figure 9.
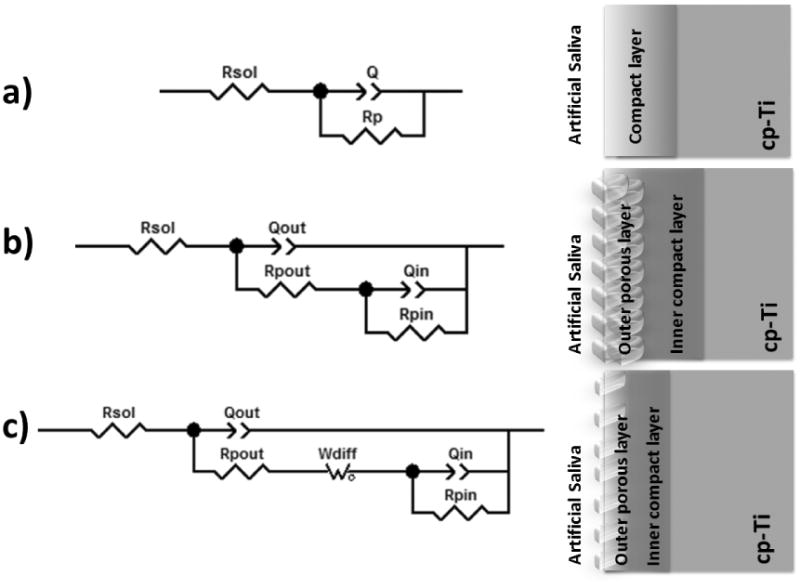
Three equivalent electrical circuits were used to fit EIS data. (a) Untreated group, b) Al oxide and 1-PEO and (c) 2-PEO groups.
Table 3.
Mean and (standard deviation) of electrical parameters obtained from the equivalent circuit models for all groups.
| Rpout (MΩ·cm2) | Rpin (MΩ·cm2) | Rptot (MΩ·cm2) | Qout (nΩ-1 sn.cm-2) | nout | Qin (nΩ-1 sn.cm-2) | nin | Qtot (nΩ-1 sncm-2) | Wdiff (nΩ s-0.5·cm2) |
|---|---|---|---|---|---|---|---|---|
| 8.18 (5.55) | 8.18 (5.55) | 0.93 (0.004) | 18100 (3000) | 18100 (3000) | ||||
| 0.341 (0.09) | 4.67 (3.17) | 5.011 (3.1) | 34900 (3000) | 0.91 (0.01) | 25000 (7370) | 0.86 (0.05) | 59936 (8550) | |
| 2.73 (0.591) | 569 (346) | 571.73 (346) * | 0.091 (0.0161) | 0.94 (0.01) | 1.11 (0.472) | 0.48 (0.03) | 1.201 (0.486) * | |
| 1.93 (1.67) | 781 (191) | 783 (193) * | 0.088 (0.0187) | 0.94 (0.004) | 1.09 (0.823) | 0.39 (0.04) | 1.183 (0.838) * | |
| 2.12 (0.34) | 560 (130) | 562 (130) * | 0.103 (0.0209) | 0.93 (0.01) | 0.884 (0.792) | 0.56 (0.14) | 0.987 (0.81) * | |
| 8.17 (12) | 576 (166) | 584.17 (177) * | 0.088 (0.0088) | 0.94 (0.02) | 0.712 (0.382) | 0.53 (0.04) | 0.800 (0.387) * | |
| 14 (13.1) | 222 (145) | 236 (158) * | 0.157 (0.03) | 0.93 (0.04) | 3.653 (1.388) | 0.50 (0.06) | 3.810 (1.419) * | 77.4 (65) |
| 2.02 (1.68) | 388 (44) | 390.02 (31.5) * | 0.058 (0.029) | 0.95 (0.03) | 0.383 (0.029) | 0.57 (0.14) | 0.441 (0.043) * | 2.38 (0.182) |
| 2.38 (2.27) | 331 (84.4) | 333.38 (82.4) * | 0.048 (0.0152) | 0.93 (0.06) | 0.335 (0.0381) | 0.68 (0.18) | 0.383 (0.053) * | 2.47 (0.297) |
| 5.58 (4.05) | 150 (32.8) | 156 (34.9) * | 0.077 (0.0165) | 0.96 (0.02) | 0.292 (0.157) | 0.80 (0.10) | 0.370 (0.153) * | 2.77 (1.42) |
Denotes statistically significant difference of experimental groups when compared to untreated and al oxide (controls) (p<.05).
Nyquist diagram in Figure 10 shows two different tendencies, one for all 1-PEO groups and other for all 2-PEO groups. The 2-PEO treated groups present diffusion regions at the end of the curve, but not in 1-PEO groups. A part of the graph was magnified in order to visualize the control groups due to the difference of magnitude.
Figure 10.
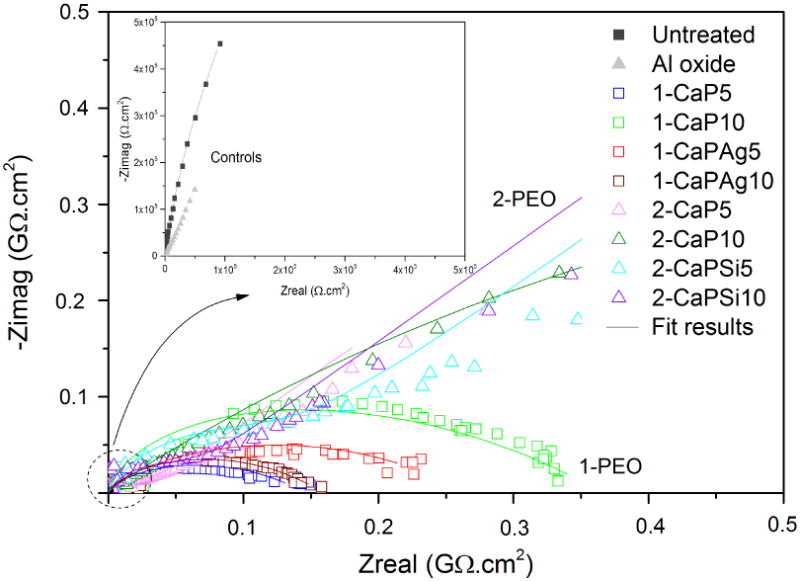
Nyquist diagram of EIS response of PEO coatings and control groups. Symbols represent experimental data and solid lines fitted data.
Phase angle plot (Figures 11c and 11d) reveals two different trends for PEO groups as well. Only one time constant can be noted for 1-PEO groups though the curves of 2-PEO groups suggest the existence of a small second time constant. For PEO treated groups, at high frequencies the angle is higher than that of controls. In Figures 11a and 11b, the higher values of impedance modulus |Z| were observed at low frequencies, indicating the improvement of electrochemical stability for the PEO treated samples.
Figure 11.
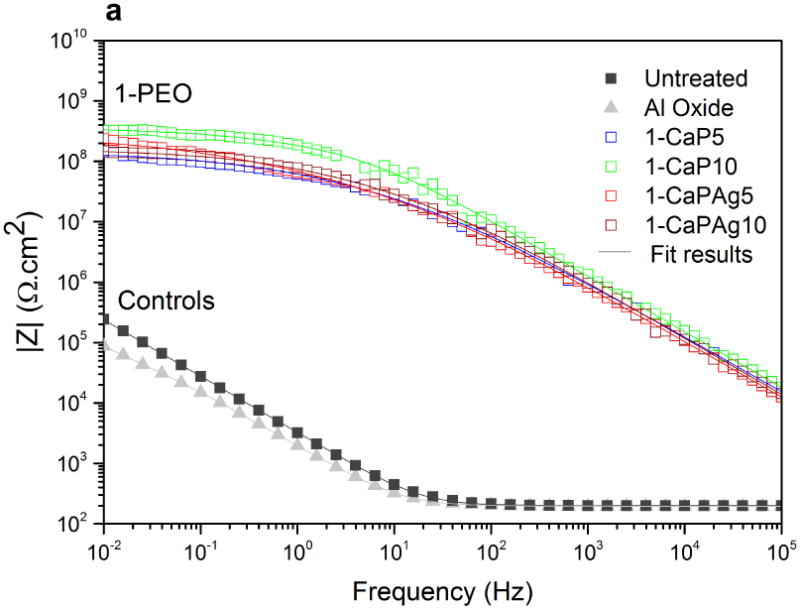
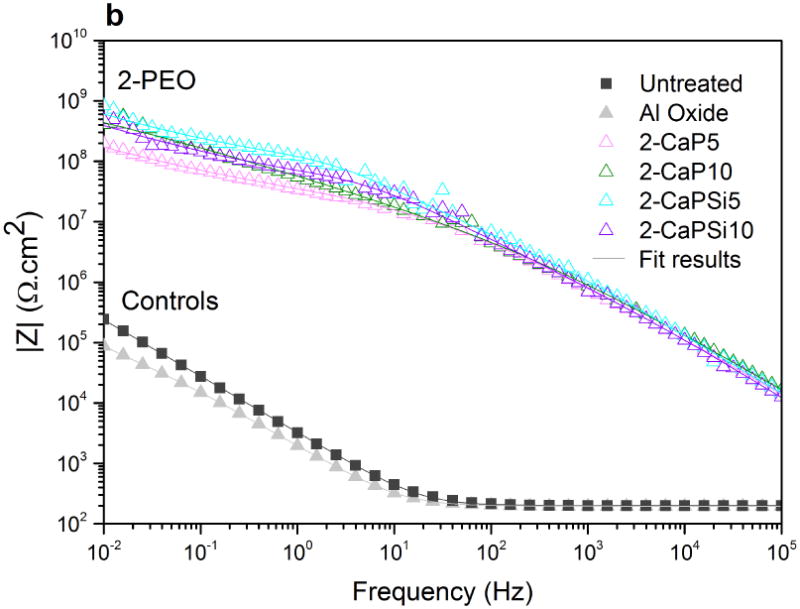
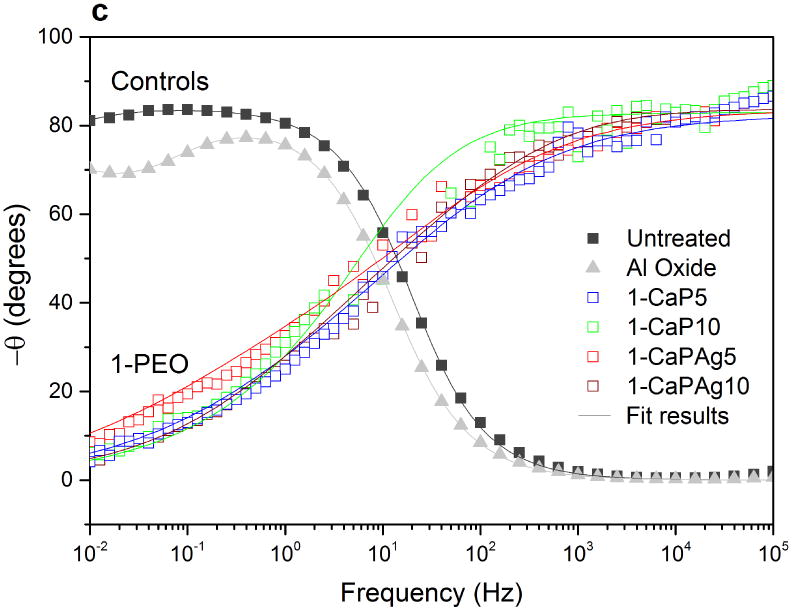
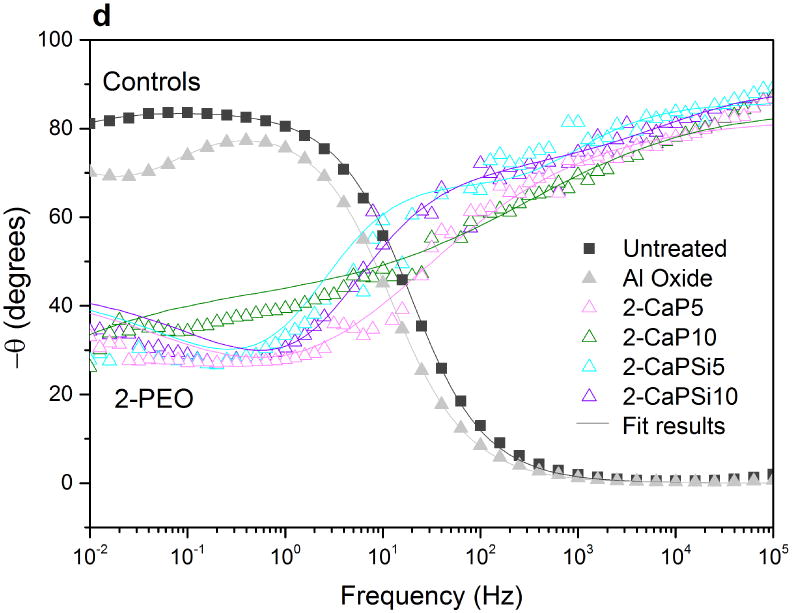
Bode impedance plots of PEO coatings and control groups: impedance modulus (a,b); phase angle (c,d). Symbols represent experimental data and solid lines fitted data.
3.2.3. Potentiodynamic
The polarization curves can be seen in Figure 12 and the electrochemical parameters including Ecorr, Icorr, Ipass, cathodic Tafel slopes (bc) and anodic Tafel slopes (ba) obtained from Tafel curves are shown in Table 4. It can be noted that the Icorr values of all PEO treated groups were similar among them (p<.05) and the values were also lower than control groups (p<.001) but the 1-PEO groups showed higher Ecorr values (p<.001). It also can be observed during the passivation curves that 1-PEO groups provide more electrochemical stability on dynamic nature of corrosion process, when compared with the 2-PEO which presented current fluctuations, as passivation, depassivation and repassivation zones.
Figure 12.
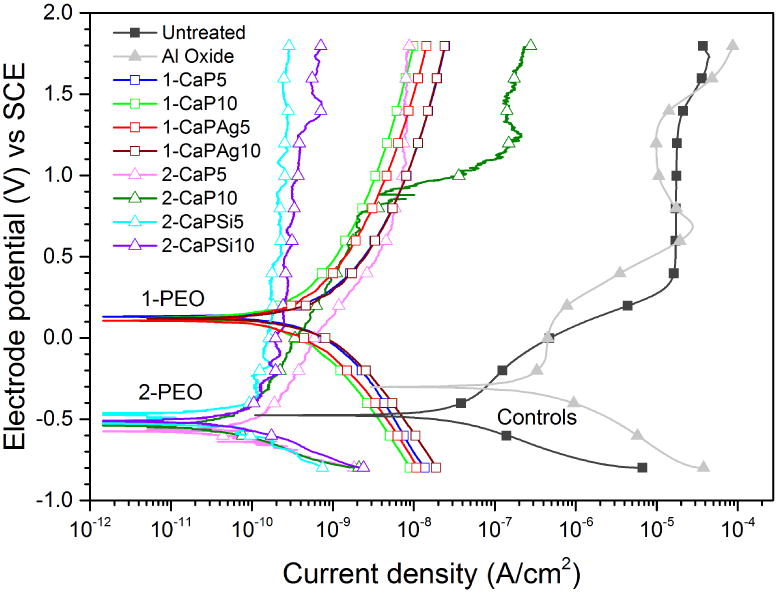
Potentiodynamic curves for all the studied groups. Note the shift of the curves to the left-up area of the graph.
Table 4.
Mean and (standard deviation) values of electrochemical parameters obtained from the potentiodynamic polarization curves.
| Groups | Ecorr (mV) vs. SCE | Icorr (nA cm-2) | ba (mV dec-1) | bc (mV dec-1) | Ipass (nA cm-2) |
|---|---|---|---|---|---|
| Untreated | -404 (109) | 13.023 (7.401) | - | 190 (63) | 17200 (1000) |
| Al Oxide | -277 (28) | 97.833 (6.171) | - | 243 (10) | 22200 (1080) |
| 1-CaP5 | 102 (45) * | 0.497 (0.194) * | 1265 (150) | 992 (38) * | 16.1 (5.3) * |
| 1-CaP10 | 97 (9) * | 0.410 (0.142) * | 1461 (13) | 860 (9) * | 11 (3.5) * |
| 1-CaPAg5 | 103 (10) * | 0.569 (0.209) * | 1487 (157) | 938 (107) * | 14.3 (2.3) * |
| 1-CaPAg10 | 119 (19) * | 0.580 (0.219) * | 1553 (20) | 938 (67) * | 13.8 (5.8) * |
| 2-CaP5 | -594 (18) | 0.043 (0.007) * | - | 194 (53) | 4.2 (3.2) * |
| 2-CaP10 | -591 (13) | 0.036 (0.011) * | - | 210 (60) | 87.7 (124) * |
| 2-CaPSi5 | -328 (262) | 0.059 (0.009) * | - | 502 (186) | 0.519 (0.585) * |
| 2-CaPSi10 | -546 (16) | 0.056 (0.006) * | - | 239 (7) | 0.155 (0.028) * |
Denotes statistically significant difference of experimental groups when compared to untreated and al oxide (controls) (p<.001).
3.3. Biocompatibility assay
Based on the results of corrosion, four groups were selected for biological assays, two controls and two experimental groups (Untreated, Al Oxide, 1-CaP10, 1-CaPAg10) that showed improved corrosion resistance. HMSCs response and morphology cultured on the selected surfaces for 6 days are presented in Figure 13. Under fluorescence analysis, it is clear that after 6 days the cells showed an active proliferation activity, covering the entire surface, indicating that the surfaces of the PEO coatings are as biocompatible as controls. Based on FESEM observation, the hMSCs cultured on the rough samples, as Al oxide and PEO-treated samples showed an elongated morphology, good adhesion and spread out over the surface with defined lamellipodia and stretched filopodia extensions.
Figure 13.
Fluorescence and FESEM images of hMSCs cultured on the surfaces for 6 days. The arrows show the filopodia extensions on treated samples.
3.4. Antibacterial activity
The log10 of colony forming units level of S. sanguinis was affected by the different tested surfaces (p<0.001, ANOVA). Ag nanoparticles in the surface statistically decreased the number of viable cells when compared to the other groups (p<0.001). Ag incorporation was able to reduce about 70%, 62% and 53% of viable cells when compared to Al oxide, Untreated and 1-CaP10, respectively (Figure 14).
Figure 14.
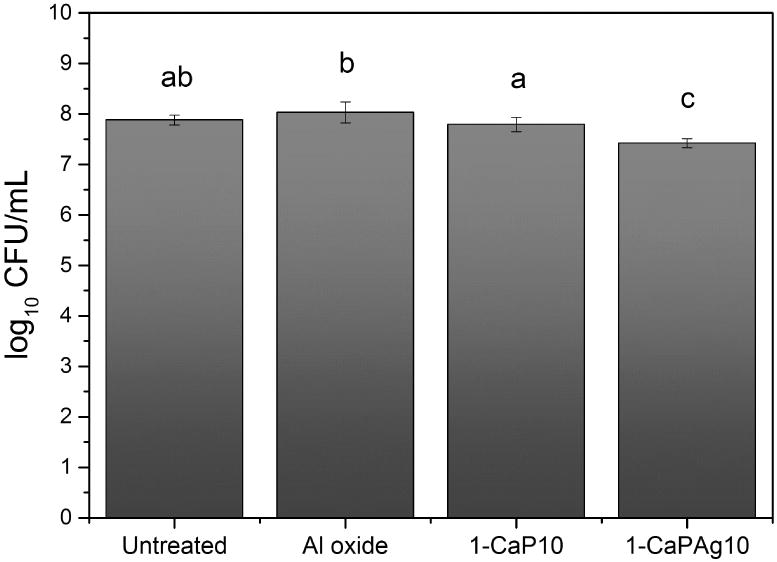
Viable cells. Mean and standard deviation of colony forming units per mL (log10) at 24 hours for Streptococcus sanguinis biofilm exposed to different surfaces (Untreated, Al oxide, 1-CaP10 and 1-CaPAg10) in the culture medium (brain heart infusion – BHI). Different letters indicate significant difference among groups (α =.05).
4. Discussion
Corrosion behavior of modified Ti surfaces through PEO process is addressed in this investigation. The high corrosion resistance property of Ti has been attributed to spontaneous formation of a titanium dioxide passive film of nanoscale thickness, highly stable, and very low electrical conductivity. This mineral oxide layer may provide titanium's effective biological performance due to its similarity with the ceramic properties of hydroxyapatite in bone [25]. However, modifying surface properties as topography and also chemistry still need efforts to enhance the bone response. So that, the surface features optimization such as the formation of a bioactive surface with good mechanical properties, corrosion resistance and also an appropriate biological response is certainly a relevant way to improve the performance of dental implants.
Based on the SEM and AFM analyses, larger pores size and thicker oxide layers were found when higher calcium acetate concentration was added in the electrolyte. These findings are in agreement with other studies [14, 17, 26]. The morphology of the thicker oxide layers formed with higher Ca concentration demonstrated different aspect regarding porous structures from those of lower Ca/P ratio. A larger pore size (volcano craters) observed in 1-PEO groups may be due to interconnections that are formed between one pore and another [27, 28].
AFM images also suggest that the thickness of 1-PEO groups is higher than the other groups as a result of the measurements of the porous depth based on the profile of the surfaces. In addition, rutile crystalline structure peaks appear only for higher Ca concentration (1-PEO) which confers greater corrosion resistance [16, 17]. The roughness was slightly higher for 1-PEO groups, suggesting that higher Ca concentrations produce rougher surface. It has been suggested that surface roughness is correlated with better osteoblastic cellular response in comparison with smooth titanium [12]. Further, all treated PEO groups were able to increase the surface wettability, what is generally favorable in biocompatibility, promoting a better interaction between the implant surface and the biological environment [2].
According to recent studies, cell-material interaction can be influenced by many factors as surface topography, porosity, chemical and elemental composition, dissolution behavior and surface macro and microstructure [29]. Based on surface characterization, it can be noticed that the roughness and the wettability of the treated surfaces were higher than untreated (smooth) titanium, representing a positive factor for cell proliferation, differentiation, and bone matrix deposition [12, 30]. PEO coatings showed good cytocompatibility, demonstrating no cytotoxic effect when Ag nanoparticles were incorporated into the surface [13]. HMSCs presented an elongated morphology and were able to adhere, spread out with numerous filopodia extensions and proliferate on their surface. It indicates that the ability of cell migration on rougher surfaces may be higher than that on the smooth surfaces [31]. In the present study, PEO treated samples are not only topographically improved but also chemically enriched with CaP (close to hydroxyapatite ratio - 1.67), which is beneficial to the stronger adhesion and growth of hMSCs [32, 33]. Many studies suggest that surface chemistry and topography may provide faster and stronger osseointegration of dental implants, allowing best anchorage and a reduced bone healing time to functional loading [31, 32, 34, 35].
Other point that still needs efforts is the antibacterial properties of dental surfaces. Despite of the high success rate of dental implants, infection remains one of the most serious and devastating complication associated with biomaterial devices, which may lead to implant failure [36]. In this study, PEO surface treatment was able to incorporate Ag nanoparticles in the modified surface. Those surfaces showed better antibacterial activity if compared to other surfaces. It may be possible that the Ag nanoparticles in the porous titanium oxide layer might react with water and to release Ag ions [13, 37]. According to Damm et al., 2008, Ag ions binding to proteins can interfere in the membrane permeability and respiration, modifying the metabolism of bacterial cells. These effects may lead to bacterial cells death [38].
After implantation into the body, the electrochemical corrosion of biomaterials may occur in the oral environment and greatly influences the biocompatibility of the implants [33]. In this study, a series of electrochemical experiments were conducted to evaluate the corrosion resistance of the PEO treated coatings in artificial saliva at pH 6.5. The differences on PEO electrolyte composition are likely to influence the corrosion resistance of all groups. Comparing the 1-PEO and 2-PEO groups, two different trends for the corrosion behavior can be noted. Regarding OCP results, better corrosion resistance was found for 1-PEO, in which all 4 groups presented similar values, varying from 0.13 V to 0.21 V (SCE).
From polarization curves, the groups with higher Ca concentration (1-PEO) groups presented a behavior of a ceramic-like surface, showing both zones (anodic and cathodic) very smooth and symmetric one to another, in which cathodic (bc) and anodic Tafel slopes (ba) were obtained. The Tafel curves of controls and 2-PEO showed no Tafel linear region in the anodic slope; thus, the parameters were obtained through Tafel extrapolation by using the cathodic slope [39-42]. Commonly, Ecorr reflects the difficulty of materials corrosion [41]. The higher Ca concentration groups also presented the highest Ecorr values and the lowest Icorr values, which may be due to the thicker layer and more amount of rutile phase [6, 16, 17]. It is clear that the corrosion resistance of the PEO treated surfaces is significantly improved compared to the controls, which can be observed by a shift of polarization curves to the left-up area of the graph exhibiting lower current density and higher potential. It suggests a more passive character of the treated samples in comparison to the control groups. The values of corrosion potential are about 0.1 V (SCE) for the 1-PEO coatings, which are higher than -0.4 V and -0.2 V (SCE) for untreated and Al oxide, respectively, indicating that 1-PEO groups show better corrosion resistance than controls [43]. Moreover, the current density values for all PEO treated groups demonstrate a reduction from approximately 10-7 to 10-10 A/cm2, which represent a very low exchange current density when compared to controls. The superior corrosion resistance of PEO treated groups might be related to the improved surface with ceramic-like coatings produced on titanium. Furthermore, there was a noticeable difference in the passivation behavior, in the case of 2-PEO groups compared to 1-PEO groups, suggesting electrochemical instability by current fluctuations, which leads to higher corrosion rates.
Concerning the EIS fitting, for the untreated group, modified Randles circuit was used including a CPE and Rp. These elements respectively infer the capacitive and resistive behavior of the naturally formed oxide layer on the cp-Ti surface when immersed in artificial saliva. The capacitances were substituted by CPE due to electrode porosity and the surface heterogeneities, such as roughness [43]. It allows the equivalent circuit to be closer to what is obtained in the electrochemical experiments [8]. Capacitive behavior can be associated with the presence of an electrochemical double layer on the material/electrolyte interface, and the dielectric nature of TiO2 [8].
Figure 9 shows the equivalent circuit model applied to analyze the EIS data for 1-PEO groups. This circuit was proposed to represent the two electrochemical interfaces presented in these coatings. A pair of elements of Qout and Rpout (outer porous layer) was used in parallel to replace the dielectric properties of the coating. The other pair of Qin and Rpin (inner compact layer) in parallel was adapted to describe the charge transfer process in the oxide layer-substrate interface. Rpout is the resistance of the electrolyte saturating the outer layer [44], whereas Rsol is the resistance of the electrolyte between the working electrode and the reference electrode, and Rpin is the resistance of the barrier part (resistance to charge transfer process). For the 2-PEO groups, a finite length Wdiff was included in the circuit in series with the resistance of the porous part [8, 20]. The existence of Warburg resistance in equivalent electrical circuit indicates that the electrochemical behavior of the coated specimen in an early stage of immersion was controlled by diffusion phenomena. It can be explained by the net transfer from a region of high concentration to a region of low concentration, which refers to the penetration of the electrolyte into the formed layers. The thinner inner compact layer of 2-PEO coating with narrow interpore distance supplied more paths for the penetration of the electrolyte, which is adverse to the protective effect of the coating. On the other hand, the thicker and dense inner compact layer with wide interpore distance in 1-PEO coating hindered the penetration rate of the electrolyte, what may enhance the corrosion properties of the coating [20]. It suggests that the resistance to corrosion offered by outer layer and inner layer is determined by pore levels which correspond to their surface morphologies [45].
Therefore, it was noted that all 1-PEO treatment groups had the similar EIS profiles. The same was observed for the 2-PEO groups, which presented similar corrosion trend. 1-PEO groups presented only one time constant and the curves of 2-PEO groups suggest the existence of a small second time constant. The phase angle peak appearing at high frequency represents the dielectric property of the porous layer of the coating, while the one at medium frequency corresponds to the barrier layer [41, 46]. The difference can be attributed to the dense passive film with rutile as crystalline structure in 1-PEO groups, which suggests more homogeneous and compact Ti oxide layers, conferring more protection to the metal surface. Assuming this, it can be inferred that the main aspects in terms of topography and corrosion behavior are dictated by the concentration of calcium and phosphorus, showing no major differences when silica and silver are incorporated into the treated surfaces. However, these findings are related to surface analysis and corrosion, and different results can be found when biological tests are applied [13, 33, 34]. Future studies are necessary to have a complete understanding about the optimal parameters to improve materials properties and osseointegration.
Based on this result, PEO is an effective technique to modify titanium surface by creating a bioactive coating that biocompatible, has antibacterial properties and can improve the corrosion resistance of dental implants. Although the current in vitro study provides an overview of the electrochemical behavior of the new coatings, it has some limitations. It is difficult to simulate in vivo conditions since it was conducted in laboratory conditions, using artificial saliva. Therefore, further investigations in tribocorrosion field, regarding the synergistic effect under friction and wear in a corrosive environment are warranted. Further in vivo studies are needed to investigate the bone-cells cellular response to the studied surfaces.
5. Conclusions
Based on the results of this study, the following findings can be drawn:
Ca/P ratios played an important role on surface characteristics (as topography, chemical composition, thickness of the film and structure) and also corrosion properties.
The concentration of 0.3M Calcium Acetate (1-PEO) presented better corrosion behavior.
The incorporation of Si and Ag on the surface had no major influence on the corrosion behavior.
PEO treated surfaces allowed optimal spreading and proliferation of hMSCs. Addition of Ag nanoparticles resulted in antibacterial properties without causing any damages to hMSCs.
The crystalline structures affected the corrosion resistance since rutile containing layers presented better protective barrier properties.
Highlights.
Bioactive coatings were produced by Plasma Electrolytic Oxidation treatment.
Surfaces with higher calcium concentration presented an improved corrosion behavior.
Rutile crystalline structure presented better protective barrier properties.
PEO treated surfaces allowed optimal spreading and proliferation of hMSCs.
Addition of Ag nanoparticles resulted in antibacterial properties.
Acknowledgments
The authors would like to thank Rush University Medical Center for providing the facilities to conduct the study; Rafael Parra for his contribution and support in Plasma Technology Laboratory; the Coordination for the Improvement of Higher Level Personnel (CAPES) for the doctoral fellowship (PDSE Proc. 11838-13-2).
Nomenclature
- 1 PEO
Groups treated with higher Ca/P ratio
- 1 CaP5
5 minutes of PEO treatment with higher Ca/P ratio
- 1 CaP10
10 minutes of PEO treatment with higher Ca/P ratio
- 1 CaPAg5
5 minutes of PEO treatment with higher Ca/P ratio and Ag incorporation
- 1 CaPAg10
10 minutes of PEO treatment with higher Ca/P ratio and Ag incorporation
- 2 PEO
Groups treated with lower Ca/P ratio
- 2 CaP5
5 minutes of PEO treatment with lower Ca/P ratio
- 2 CaP10
10 minutes of PEO treatment with lower Ca/P ratio
- 2 CaPSi5
5 minutes of PEO treatment with lower Ca/P ratio and Si incorporation
- 2 CaPSi10
10 minutes of PEO treatment with lower Ca/P ratio and Si incorporation
- BHI
Brain hearth infusion
- CPE
Constant phase element
- Ecorr
Corrosion potential
- EIS
Electrochemical impedance spectroscopy
- hMSCs
Human Mesenchymal Stem Cells
- Icorr
Corrosion current density
- Ipass
Passivation current density
- OCP
Open circuit potential
- PEO
Plasma electrolytic oxidation
- Qin
Constant phase element of the inner compact layer
- Qout
Constant phase element of the outer porous layer
- Rp
Polarization resistance
- Rpin
Polarization resistance of the inner compact layer
- Rpout
Polarization resistance of the outer porous layer
- Rsol
Polarization resistance of the electrolyte
- SCE
Saturated calomel electrode
- Wdiff
Warburg diffusion element
Footnotes
Publisher's Disclaimer: This is a PDF file of an unedited manuscript that has been accepted for publication. As a service to our customers we are providing this early version of the manuscript. The manuscript will undergo copyediting, typesetting, and review of the resulting proof before it is published in its final citable form. Please note that during the production process errors may be discovered which could affect the content, and all legal disclaimers that apply to the journal pertain.
References
- 1.Rodriguez L, Sundaram PA, Rosim-Fachini E, Padovani AM, Diffoot-Carlo N. Plasma electrolytic oxidation coatings on γTiAl alloy for potential biomedical applications. J Biomed Mater Res Part B Appl Biomater. 2014;102:988–1001. doi: 10.1002/jbm.b.33079. [DOI] [PubMed] [Google Scholar]
- 2.Kim K, Lee BA, Piao XH, Chung HJ, Kim YJ. Surface characteristics and bioactivity of an anodized titanium surface. J Periodontal Implant Sci. 2013;43:198–205. doi: 10.5051/jpis.2013.43.4.198. [DOI] [PMC free article] [PubMed] [Google Scholar]
- 3.Vieira AC, Ribeiro AR, Rocha LA, Celis JP. Influence of pH and corrosion inhibitors on the tribocorrosion of titanium in artificial saliva. Wear. 2006;261:994–1001. [Google Scholar]
- 4.Barao VA, Mathew MT, Assuncao WG, Yuan JC, Wimmer MA, Sukotjo C. Stability of cp-Ti and Ti-6Al-4V alloy for dental implants as a function of saliva pH - an electrochemical study. Clin Oral Implant Res. 2012;23:1055–1062. doi: 10.1111/j.1600-0501.2011.02265.x. [DOI] [PubMed] [Google Scholar]
- 5.Nikolopoulou F. Saliva and dental implants. Implant Dent. 2006;15:372–376. doi: 10.1097/01.id.0000239320.57403.8d. [DOI] [PubMed] [Google Scholar]
- 6.Yerokhin AL, Nie X, Leyland A, Matthews A, Dowey SJ. Plasma electrolysis for surface engineering. Surf Coat Technol. 1999;122:73–93. [Google Scholar]
- 7.Walsh FC, Low CTJ, Wood RJK, Stevens KT, Archer J, Poeton AR, Ryder A. Plasma electrolytic oxidation (PEO) for production of anodised coatings on lightweight metal (Al, Mg, Ti) alloys. Transactions of the IMF. 2009;87:122–135. [Google Scholar]
- 8.Mohedano M, Matykina E, Arrabal R, Pardo A, Merino MC. Metal release from ceramic coatings for dental implants. Dent Mater. 2014;30:28–40. doi: 10.1016/j.dental.2013.12.011. [DOI] [PubMed] [Google Scholar]
- 9.Akatsu T, Yamada Y, Hoshikawa Y, Onoki T, Shinoda Y, Wakai F. Multifunctional porous titanium oxide coating with apatite forming ability and photocatalytic activity on a titanium substrate formed by plasma electrolytic oxidation. Mater Sci Eng C. 2013;33:4871–4875. doi: 10.1016/j.msec.2013.08.003. [DOI] [PubMed] [Google Scholar]
- 10.Sul YT, Jeong Y, Johansson C, Albrektsson T. Oxidized, bioactive implants are rapidly and strongly integrated in bone. Part 1-experimental implants. Clin Oral Implant Res. 2006;17:521–526. doi: 10.1111/j.1600-0501.2005.01230.x. [DOI] [PubMed] [Google Scholar]
- 11.Park JW, Kim YJ, Jang JH, Song H. Osteoblast response to magnesium ion-incorporated nanoporous titanium oxide surfaces. Clin Oral Implant Res. 2010;21:1278–1287. doi: 10.1111/j.1600-0501.2010.01944.x. [DOI] [PubMed] [Google Scholar]
- 12.Zareidoost A, Yousefpour M, Ghaseme B, Amanzadeh A. The relationship of surface roughness and cell response of chemical surface modification of titanium. J Mater Sci Mater Med. 2012;23:1479–1488. doi: 10.1007/s10856-012-4611-9. [DOI] [PMC free article] [PubMed] [Google Scholar]
- 13.Della Valle C, Visai L, Santin M, Cigada A, Candiani G, Pezzoli D, Arciola CR, Imbriani M, Chiesa R. A novel antibacterial modification treatment of titanium capable to improve osseointegration. Int J Artif Organs. 2012;35:864–875. doi: 10.5301/ijao.5000161. [DOI] [PubMed] [Google Scholar]
- 14.Ishizawa H, Ogino M. Formation and characterization of anodic titanium oxide films containing Ca and P. J Biomed Mater Res. 1995;29:65–72. doi: 10.1002/jbm.820290110. [DOI] [PubMed] [Google Scholar]
- 15.Laurindo CA, Torres RD, Mali SA, Gilbert JL, Soares P. Incorporation of Ca and P on anodized titanium surface: Effect of high current density. Mater Sci Eng C. 2014;37:223–231. doi: 10.1016/j.msec.2014.01.006. [DOI] [PubMed] [Google Scholar]
- 16.Shokouhfar M, Dehghanian C, Montazeri M, Baradaran A. Preparation of ceramic coating on Ti substrate by plasma electrolytic oxidation in different electrolytes and evaluation of its corrosion resistance: Part II. Appl Surf Sci. 2012;258:2416–2423. [Google Scholar]
- 17.Alves AC, Oliveira F, Wenger F, Ponthiaux P, Celis JP, Rocha LA. Tribocorrosion behaviour of anodic treated titanium surfaces intended for dental implants. J Phys D: Appl Phys. 2013;46:404001. [Google Scholar]
- 18.Son WW, Zhu X, Shin HI, Ong JL, Kim KH. In vivo histological response to anodized and anodized/hydrothermally treated titanium implants. J Biomed Mater Res Part B Appl Biomater. 2003;66:520–525. doi: 10.1002/jbm.b.10042. [DOI] [PubMed] [Google Scholar]
- 19.Montazeri M, Dehghanian C, Shokouhfar M, Baradaran A. Investigation of the voltage and time effects on the formation of hydroxyapatite-containing titania prepared by plasma electrolytic oxidation on Ti–6Al–4V alloy and its corrosion behavior. Appl Surf Sci. 2011;257:7268–7275. [Google Scholar]
- 20.Cui WF, Jin L, Zhou L. Surface characteristics and electrochemical corrosion behavior of a pre-anodized microarc oxidation coating on titanium alloy. Mater Sci Eng C. 2013;33:3775–3779. doi: 10.1016/j.msec.2013.05.011. [DOI] [PubMed] [Google Scholar]
- 21.Barao VA, Mathew MT, Assuncao WG, Yuan JC, Wimmer MA, Sukotjo C. The role of lipopolysaccharide on the electrochemical behavior of titanium. J Dent Res. 2011;90:613–618. doi: 10.1177/0022034510396880. [DOI] [PubMed] [Google Scholar]
- 22.Li S, Ni J, Liu X, Zhang X, Yin S, Rong M, Guo Z, Zhou L. Surface characteristics and biocompatibility of sandblasted and acid-etched titanium surface modified by ultraviolet irradiation: an in vitro study. J Biomed Mater Res Part B Appl Biomater. 2012;100:1587–1598. doi: 10.1002/jbm.b.32727. [DOI] [PubMed] [Google Scholar]
- 23.Shi GS, Ren LF, Wang LZ, Lin HS, Wang SB, Tong YQ. H2O2/HCl and heat-treated Ti-6Al-4V stimulates pre-osteoblast proliferation and differentiation. Oral Surg Oral Med Oral Pathol. 2009;108:368–375. doi: 10.1016/j.tripleo.2009.05.033. [DOI] [PubMed] [Google Scholar]
- 24.Liu IH, Lee TM, Chang CY, Liu CK. Effect of load deflection on corrosion behavior of NiTi wire. J Dent Res. 2007;86:539–543. doi: 10.1177/154405910708600610. [DOI] [PubMed] [Google Scholar]
- 25.Sul YT, Johansson C, Byon E, Albrektsson T. The bone response of oxidized bioactive and non-bioactive titanium implants. Biomaterials. 2005;26:6720–6730. doi: 10.1016/j.biomaterials.2005.04.058. [DOI] [PubMed] [Google Scholar]
- 26.Krupa D, Baszkiewicz J, Zdunek J, Sobczak JW, Lisowski W, Smolik J, Slomka Z. Effect of plasma electrolytic oxidation in the solutions containing Ca, P, Si, Na on the properties of titanium. J Biomed Mater Res Part B Appl Biomater. 2012;100:2156–2166. doi: 10.1002/jbm.b.32781. [DOI] [PubMed] [Google Scholar]
- 27.Sul YT, Johansson CB, Petronis S, Krozer A, Jeong Y, Wennerberg A, Albrektsson T. Characteristics of the surface oxides on turned and electrochemically oxidized pure titanium implants up to dielectric breakdown∷ the oxide thickness, micropore configurations, surface roughness, crystal structure and chemical composition. Biomaterials. 2002;23:491–501. doi: 10.1016/s0142-9612(01)00131-4. [DOI] [PubMed] [Google Scholar]
- 28.Kuromoto NK, Simão RA, Soares GA. Titanium oxide films produced on commercially pure titanium by anodic oxidation with different voltages. Mater Charact. 2007;58:114–121. [Google Scholar]
- 29.Surmenev RA, Surmeneva MA, Ivanova AA. Significance of calcium phosphate coatings for the enhancement of new bone osteogenesis – A review. Acta Biomater. 2014;10:557–579. doi: 10.1016/j.actbio.2013.10.036. [DOI] [PubMed] [Google Scholar]
- 30.Gittens RA, Scheideler L, Rupp F, Hyzy SL, Geis-Gerstorfer J, Schwartz Z, Boyan BD. A review on the wettability of dental implant surfaces II: Biological and clinical aspects. Acta Biomater. 2014;10:2907–2918. doi: 10.1016/j.actbio.2014.03.032. [DOI] [PMC free article] [PubMed] [Google Scholar]
- 31.Zhu X, Chen J, Scheideler L, Reichl R, Geis-Gerstorfer J. Effects of topography and composition of titanium surface oxides on osteoblast responses. Biomaterials. 2004;25:4087–4103. doi: 10.1016/j.biomaterials.2003.11.011. [DOI] [PubMed] [Google Scholar]
- 32.Pae A, Kim SS, Kim HS, Woo YH. Osteoblast-like cell attachment and proliferation on turned, blasted, and anodized titanium surfaces. Int J Oral Maxillofac Implants. 2011;26:475–481. [PubMed] [Google Scholar]
- 33.Hu H, Liu X, Ding C. Preparation and cytocompatibility of Si-incorporated nanostructured TiO2 coating. Surf Coat Technol. 2010;204:3265–3271. [Google Scholar]
- 34.Zhang Z, Sun J, Hu H, Wang Q, Liu X. Osteoblast-like cell adhesion on porous silicon-incorporated TiO2 coating prepared by micro-arc oxidation. J Biomed Mater Res Part B Appl Biomater. 2011;97:224–234. doi: 10.1002/jbm.b.31804. [DOI] [PubMed] [Google Scholar]
- 35.Gittens RA, Olivares-Navarrete R, Schwartz Z, Boyan BD. Implant osseointegration and the role of microroughness and nanostructures: Lessons for spine implants. Acta Biomater. 2014;10:3363–3371. doi: 10.1016/j.actbio.2014.03.037. [DOI] [PMC free article] [PubMed] [Google Scholar]
- 36.Hendriks JGE, van Horn JR, van der Mei HC, Busscher HJ. Backgrounds of antibiotic-loaded bone cement and prosthesis-related infection. Biomaterials. 2004;25:545–556. doi: 10.1016/s0142-9612(03)00554-4. [DOI] [PubMed] [Google Scholar]
- 37.Necula BS, Apachitei I, Tichelaar FD, Fratila-Apachitei LE, Duszczyk J. An electron microscopical study on the growth of TiO2–Ag antibacterial coatings on Ti6Al7Nb biomedical alloy. Acta Biomater. 2011;7:2751–2757. doi: 10.1016/j.actbio.2011.02.037. [DOI] [PubMed] [Google Scholar]
- 38.Damm C, Münstedt H, Rösch A. The antimicrobial efficacy of polyamide 6/silver-nano- and microcomposites. Mater Chem Phys. 2008;108:61–66. [Google Scholar]
- 39.Zhao M, Schmutz P, Brunner S, Liu M, Song G, Atrens A. An exploratory study of the corrosion of Mg alloys during interrupted salt spray testing. Corrosion Science. 2009;51:1277–1292. [Google Scholar]
- 40.Shi Z, Liu M, Atrens A. Measurement of the corrosion rate of magnesium alloys using Tafel extrapolation. Corros Sci. 2010;52:579–588. [Google Scholar]
- 41.Cui S, Yin X, Yu Q, Liu Y, Wang D, Zhou F. Polypyrrole nanowire/TiO2 nanotube nanocomposites as photoanodes for photocathodic protection of Ti substrate and 304 stainless steel under visible light. Corros Sci. 2015 doi: 10.1016/j.corsci.2015.05.059. [DOI] [Google Scholar]
- 42.Cui X, Lin X, Liu C, Yang R, Zheng X, Gong M. Fabrication and corrosion resistance of a hydrophobic micro-arc oxidation coating on AZ31 Mg alloy. Corros Sci. 2015;90:402–412. [Google Scholar]
- 43.Benea L, Mardare-Danaila E, Mardare M, Celis JP. Preparation of titanium oxide and hydroxyapatite on Ti–6Al–4V alloy surface and electrochemical behaviour in bio-simulated fluid solution. Corros Sci. 2014;80:331–338. [Google Scholar]
- 44.Zhang XL, Jiang ZH, Yao ZP, Wu ZD. Electrochemical study of growth behaviour of plasma electrolytic oxidation coating on Ti6Al4V: Effects of the additive. Corros Sci. 2010;52:3465–3473. [Google Scholar]
- 45.Jia ZJ, Li M, Liu Q, Xu XC, Cheng Y, Zheng YF, Xi TF, Wei SC. Micro-arc oxidization of a novel Mg–1Ca alloy in three alkaline KF electrolytes: Corrosion resistance and cytotoxicity. Appl Surf Sci. 2014;292:1030–1039. [Google Scholar]
- 46.Wen L, Wang Y, Zhou Y, Guo L, Ouyang JH. Microstructure and corrosion resistance of modified 2024 Al alloy using surface mechanical attrition treatment combined with microarc oxidation process. Corros Sci. 2011;53:473–480. [Google Scholar]


