

Abstract
This article investigates late-onset cognitive impairment using neuroimaging and genetics biomarkers for subjects participating in the Alzheimer’s Disease Neuroimaging Initiative (ADNI). Eight hundred and eight ADNI subjects were identified and divided into three groups: those with Alzheimer’s Disease (AD), those with mild cognitive impairment (MCI), and asymptomatic normal control (NC) group. Two hundred of the subjects qualified for AD diagnosis at the baseline; three hundred and eighty-three had MCI; and 225 were included in the NC group. The structural magnetic resonance imaging (MRI) data were parcellated using BrainParser, and the 80 most important neuroimaging biomarkers were extracted using the Global Shape Analysis (GSA) Pipeline workflow. We obtained 80 SNPs using Plink analysis via the Pipeline environment. In the AD cohort, rs2137962 was significantly associated with changes in left and right hippocampi and bilaterally in parahippocampal gyri, and rs1498853, rs288503, and rs288496 were significantly associated with hippocampi bilaterally, the right parahippocampal gyrus, and left inferior temporal gyrus. In the MCI cohort, rs17028008 and rs17027976 were significantly associated with right caudate and right fusiform gyrus, and rs2075650 (TOMM40) was significantly associated with right caudate, rs1334496 and rs4829605 were significantly associated with right inferior temporal gyrus. In the NC cohort, Chromosome 15 [rs734854 (STOML1), rs11072463 (PML), rs4886844 (PML) and rs1052242 (PML)] was significantly associated with the both hippocampi and both insular cortex and rs4899412 (RGS6) was significantly associated with caudate related biomarkers. We observed significant correlations between the SNPs and the neuroimaging phenotypes in the 808 subjects in terms of neuroimaging genetics. These results illustrate some of the neuroimaging-genetics associations between the AD, MCI and NC cohorts.
Keywords: Alzheimer’s Disease, late-onset, ADNI, mild cognitive impairment, GWAS, neuroimaging
I. Introduction
Alzheimer’s Disease (AD)
Alzheimer’s disease (AD), is by far the most common form of dementia among the elderly. Late onset AD (LOAD), defined by the onset of symptoms after age 65, is sporadic, non-familial AD and has annual incidence rates increasing from 1% at age 65–70 years to 6–8% at age 85 and older[1, 2]. Genetic studies have provided significant insights on the molecular basis of AD, but the mechanisms underlying AD onset and progression remain largely unexplained. While the underlying causes of LOAD are still unknown, there is ample evidence from familial aggregation, transmission pattern, and twin studies that AD has a substantial genetic component that has an estimated heritability of 58% to 79%[3, 4], and the lifetime risk of AD among first-degree relatives of patients may be twice that of the general population[5]. The vast majority has complex, genetic determinants because only apolipoprotein E (APOE) has been established unequivocally as a LOAD-susceptible gene.
AD Imaging Studies
Recent and ongoing advances in neuroimaging and genetics, including high-throughput genotyping techniques, have made it possible to scan populations with multimodality neuroimaging, collect genome-wide data [6, 7] and study the influence of genetic variation on the brain structure and function [8–10]. In this paper, neuroimaging genetics refers to the use of brain imaging to evaluate phenotypic variation in the brain morphometry and physiology as a function of genotypic variation, using computationally-derived neuroanatomical, functional or connectivity imaging markers as phenotype assays to evaluate genetic variation[11]. The genes that influence differently volume and shape changes in neuroimaging phenotypes between AD and normal controls (NC) subjects may provide important information regarding the mechanisms of disease-related changes in neuroimaging phenotypes[8].
Alzheimer’s Genetics
Using the Alzheimer’s Disease Neuroimaging Initiative (ADNI) baseline MRI and genetic database, we selected LOAD, mild cognitive impairment (MCI) subjects and NC subjects. In this paper, we present a neuroimaging genetics framework that uses a whole-genome-and-whole-brain strategy to systematically evaluate genetic effects on neuroimaging phenotypes to discover quantitative trait loci (QTLs). Quantitative trait (QT) association studies have been shown to have increased statistical power and thus decreased sample size requirements [12]. In addition, neuroimaging phenotypes may be closer to the underlying biological etiology of the disease, making it easier to identify underlying genes [8]. The methodology proposed in this paper is based on the identification of strong associations between regional neuroimaging phenotypes as QTs and single nucleotide polymorphism (SNP) genotypes as QTLs.
Many recent studies of the genetics of AD have examined familial and hereditary aspects of the disorder as well as sporadic cases of AD. APOE ε4 allele is implicated in AD and associated with AD pathobiology as a risk factor. On the other hand, APOE ε2 allele is well known as a protective factor for AD [13–15]. The genetics of AD are complex because the practical effects may be weak, albeit statistical effects could still be strong, sample-sizes are often unbalanced (number of cases ≪ genomics biomarkers), and considerable difficulties with result replication and validation [16–19]. Large-scale genome-wide association studies (GWAS) show promise in untangling the genetic footprint of this neurodegenerative disease [18, 20–24].
This study focuses on analyzing gene interactions and collective genome effects on the brain structure in ADNI AD, MCI and NC data to broaden our horizon of understanding of late-onset cognitive impairment in terms of neuroimaging genetics. Specifically, the goal is to utilize existent Laboratory of Neuro Imaging (LONI) computational tools and techniques (e.g., the LONI Probabilistic Brain Atlas [25], BrainParser [26], LONI Pipeline environment [27, 28]) to study interrelations between genotypes and biomedical neuroimaging features in the subjects from ADNI. This study of collective multi-gene effects on phenotype and neuroimaging measures is expected to enable, with great probability, the detection of genotype-phenotype associations, which may be marginal for a single SNP or a single gene.
There were several efforts to investigate phenotypic, genetic and imaging markers by combining neuroimaging phenotypes (QT) and genetic variations [8, 29, 30]. However, there are few studies have included shape-based neuroimaging measures. Therefore, in this study, we are attempting to expand the narrow scope, in terms of late-onset cognitive impairment, that has been maintained in the field of neuroimaging genetics using the Pipeline environment.
II. Methods
Study participants
808 ADNI participants were screened, enrolled, and followed up prospectively according to the study protocol described in [31] [Supplementary Table 1]. For each participant, clinical severity of dementia was assessed using an annual semi-structured interview, which yielded an overall Clinical Dementia Rating (CDR) score and the CDR Sum of Boxes [32]. In addition, the Mini-Mental State Examination and a neuropsychological battery were also recorded. Three types of participant cohorts were selected from the ADNI database based on their classification at baseline. The 808 ADNI participants, ages 65 to 85, included: 225 NC’s (Male: 116, Female: 109), 383 MCI’s (Male: 246, Female: 137), and 200 AD’s (Male: 108, Female: 92).
Subject Genotyping
To generate an individual genotype labeling, the ADNI database were downloaded (http://www.loni.usc.edu/ADNI) and merged into a single dataset containing the genome-wide information of all 808 participants. We used PLINK [33] version 1.09 (http://pngu.mgh.harvard.edu/~purcell/plink/) to conduct the genetic analyses of the blood samples obtained from DNA extraction. Both the DNA extraction and genotyping (by TGen using the Illumina Human610-Quad BeadChip) were done blindly to group assignment. Finally, using Illumina BeadStudio 3.2 software, the normalized bead intensity data for each sample were used to generate SNP genotypes from fluorescent intensities using the manufacturer’s default cluster settings. The detailed genotyping process is described in this study protocol [8].
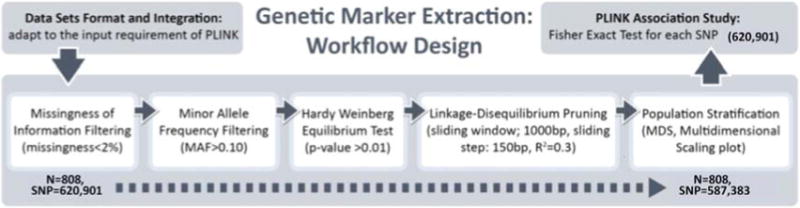
Quality control (QC) protocols on the genome-wide data were performed using the PLINK software package (http://pngu.mgh.harvard.edu/purcell/plink/), release v1.09. The following criteria were used to exclude SNPs from the imaging-genetics analysis: (1) call rate per SNP>90%, (2) minor allele frequency (MAF) > 10%, and (3) Hardy-Weinberg equilibrium test of p>0.01. The final number of SNPs included in the analyses was 587,383, see [8].
We used PLINK [34] for population stratification. PLINK uses genome-wide average proportion of alleles shared between any two individuals to cluster subjects into homogeneous subsets and perform classical multidimensional scaling (MDS) [35] to visualize substructure and provide quantitative indices of population genetic variation.
Structural MRI Data
We downloaded the raw Digital Imaging and Communications in Medicine (DICOM) images ADNI data from this publicly accessible DB (http://www.loni.usc.edu/ADNI). The ADNI MRI scans were acquired at multiple sites using the GE Health Care (Buckinghamshire, England), Siemens Medical Solutions USA (Atlanta, Georgia), or Philips Electronics 1.5 T (Philips Electronics North America; Sunnyvale, California) system [36]. Two high resolution T1-weighted volumetric magnetization-prepared 180° radiofrequency pulses and rapid gradient-echo (MP_RAGE) scans were collected for each study participant, and the raw DICOM images were downloaded from the public ADNI site (http://adni.loni.usc.edu/data-samples). Parameter values can be found at http://adni.loni.usc.edu/about/centers-cores/. The raw neuroimaging scans were corrected for intensity inhomogeneity, scull-stripped, and subcortical white matter and deep gray matter volumetric structures were segmented using previously published methods [37].
The Pipeline Computational Environment
The 808 ADNI subjects (AD, MCI and NC) were chosen from amongst all subjects in the ADNI-1 database (DB) as of September 2010. To manage the raw and derived data, processing protocols and provenance we employed the LONI Pipeline [28, 38]. The Pipeline is a graphical workflow environment facilitating the collaborative design, execution, validation, visualization, modification and sharing of complex heterogeneous computational protocols.
To promote “open-science” development and validation, we designed a Global Shape Analysis1, Pipeline workflow [Supplementary Fig. 1, Supplementary File] [28] that represents an end-to-end computational protocol for high-throughput data preprocessing. The pipeline workflow includes skull-stripping [39], volumetric registration [40], brain anatomical parcellation into 56 ROIs [25, 26], extraction of volume and shape measures (average mean curvature, surface area, volume, shape index and curvedness) and between group statistical analyses of shape regional differences. The output of the pipeline workflow is a collection of 3D scenes illustrating the statistically significant regional anatomical differences between the study cohorts.
Using the complete collection of 280 imaging markers (56 ROIs × 5 shape measures), we chose the 80 most significant neuroimaging biomarkers which provided the highest discrimination between the AD and NC groups. The 80 neuroimaging biomarkers were derived from the structural imaging data using the GSA workflow and are based on the automated ROI extractions generated by BrainParser [25, 26]. Fig. 2 illustrates the LPBA40 atlas, an example of the 3D reconstruction of the BrainParser output for one subject, and the names of the 56 ROIs. Finally, the pipeline workflow, Supplementary Fig. 1, computed the most significant genotypic discriminants among AD, MCI and NC subjects. The 80 neuroimaging biomarkers were then associated with the top 80 SNPs, which were chosen by the PLINK [34].
Fig. 2. Summary of the 56 regions of interest (ROIs).
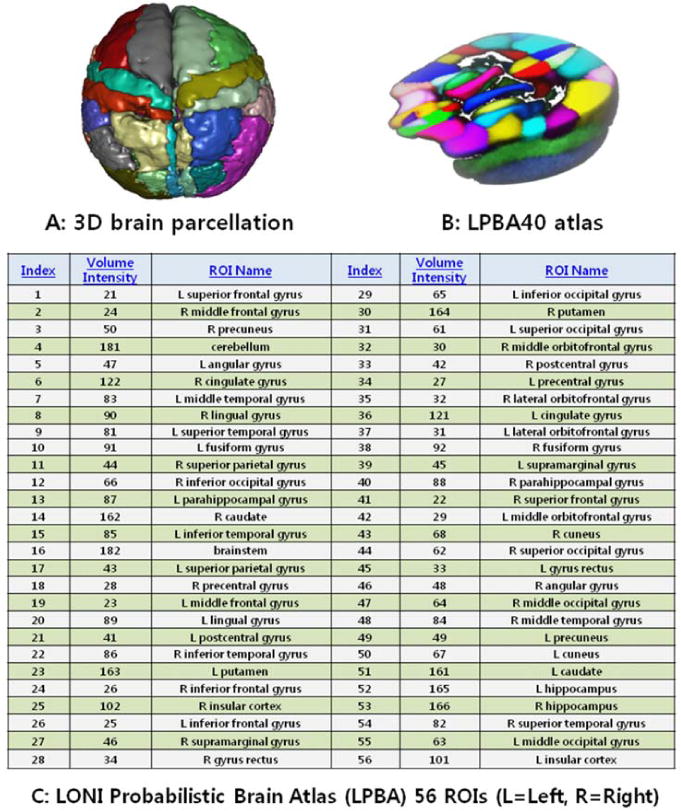
Summary of the 56 regions of interest (ROIs) (A,C) extracted by the BrainParser software using the LPBA40 atlas (B).
AD Gene Networks
To measure how relevant our target genes are to known AD gene networks, we chose 416 SNPs based on an uncorrected p-value threshold of 0.00005. We took 140 of these genes [Supplementary Table 2] that commonly appeared in the RefSeq, UCSC and Ensembl gene annotations. These three resources were used as they are commonly referred to in the SNPnexus Database, http://www.snp-nexus.org. Then, we searched for known pathways/networks associated with LOAD, Supplementary Table 3:
The AD associated pathway (168 genes) from KEGG pathway (http://www.genome.jp/dbgetbin/www_bget?pathway:map05010);
AlzGene (47 genes) (http://www.alzgene.org/); and
The 20 gene modules in a recent study [41].
We next ran gene enrichment analysis using the hypergeometric test [42] between the 140 genes from the current study and the 22 gene sets, which were obtained from these three resources [Supplementary Table 3].
Imaging-Genetic Associations
We used standard GWAS techniques [43–45] to extract 80 SNPs according to their p-values indicating significant differences among MCI, AD and NC subjects. The results of the association between the 80 SNPs phenotypes and the 80 neuroimaging biomarkers are depicted using connectograms [46] and heatmaps [47].
III. Results
Demographic characteristics
The demographics and clinical data of the subjects at the baseline are summarized in Table 1 (using Chi-square and ANOVA). The 808 subjects (aged 65–85 years) were chosen from the ADNI datasets. The AD, MCI and NC subjects had no statistically significant differences in age.
Table 1.
Demographic information.
| Category | NC | MCI | AD | p-value |
|---|---|---|---|---|
| Number of Subjects | 225 | 382 | 200 | |
| Gender (M/F) | 116/109 | 246/137 | 108/92 | 0.004 |
| Age | 75.99±4.93 | 74.77±7.45 | 75.32±7.39 | 0.102 |
| MMSE | 29.11±1.00 | 27.05±1.79 | 23.48±2.15 | <0.0001 |
| ADAS_Cog | 6.15±2.86 | 11.43±4.40 | 18.46±6.28 | <0.0001 |
| Education (years, mean±SD) | 16.01±2.90 | 15.63±3.03 | 14.81±3.17 | <0.0001 |
| Handedness (R/L) | 207/18 | 348/35 | 188/12 | 0.418 |
| APOE (ε2/ε3/ε4) | 37/349/64 | 26/491/249 | 10/221/169 | <0.0001 |
Neuroimaging biomarker and SNP phenotypes selection
The most significant 80 neuroimaging biomarkers were selected from among the 56 ROIs and five different volume- and shape-based metrics, based on how well they discriminated between the AD and NC cohorts (the significance threshold of P <0.05). The quality control (QC) result is shown in Fig. 3 and the QQ normal probability plot is shown in Fig. 4. The 80 SNPs that were chosen according to their p-values (the significance threshold of P <0.0002) are shown in Fig. 5 and Supplementary Table 4. The choice of 80 neuroimaging and 80 SNP biomarkers was driven by balancing the need to expand the number of possible biomarkers with the need of minimizing the number of elements in the heatmap matrices used to generate the connectogram in the results section.
Fig. 3.
QC process.
Fig. 4.
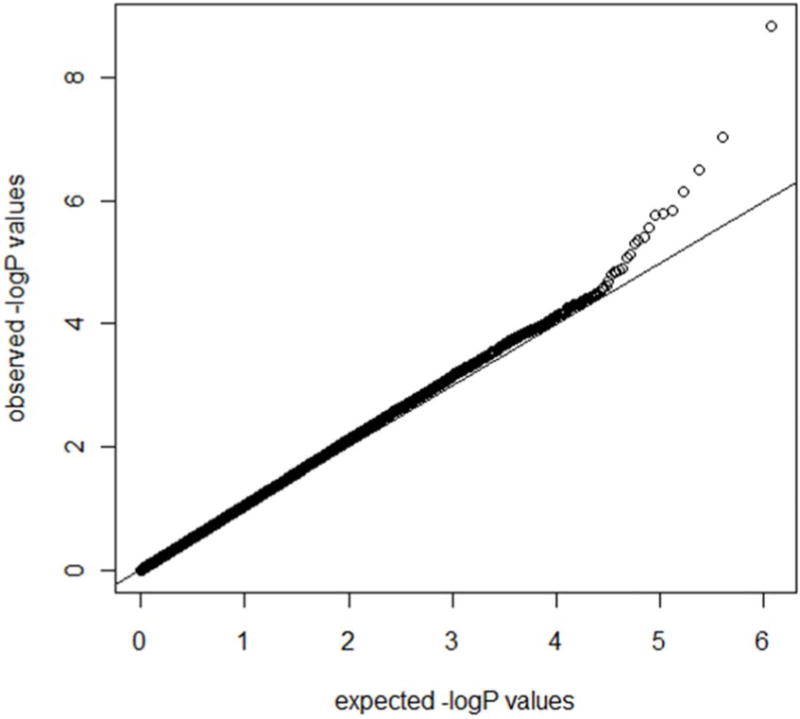
QQ normal probability plot
Fig. 5.
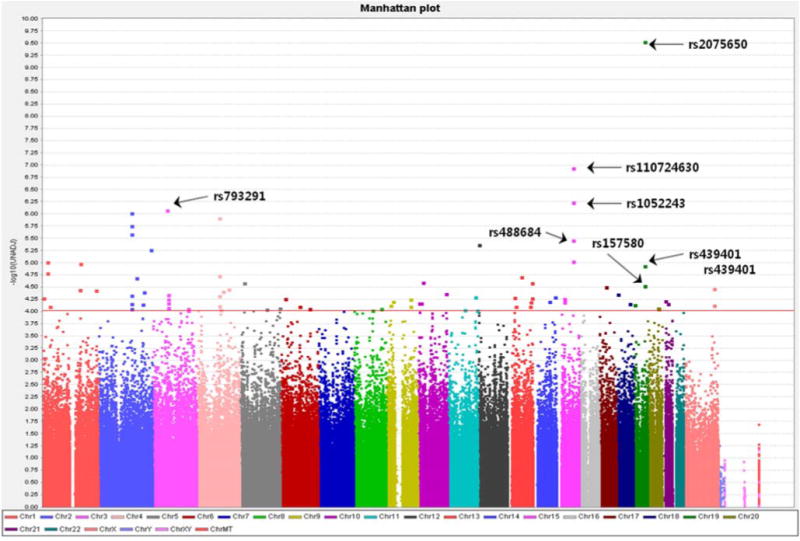
Manhattan plot (80 SNPs)
Nine ROIs for the 20 nueuroimaging biomarkers were included for the volume and shape measures (Fig. 1 and Supplementary Table 4). The 80 most significant SNPs are shown in Supplementary Table 4.
Fig. 1. The global shape analysis (GSA) Pipeline workflow and a 3D scene output.
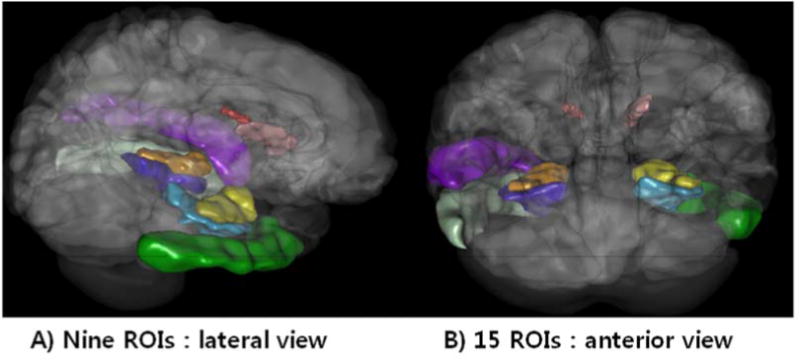
The global shape analysis (GSA) Pipeline workflow and one example of a 3D scene output file indicating statistically significant (p-value < 0.05) volumetric differences between the AD, MCI and NC cohorts. These scene files are generated for each group comparison and each shape or volume metric.
#Nine ROIs in this 3D scene [The volume and shape measures] for the associations of the top 20 most significant biomarkers among 80*80 measures: R_hippocampus, L_hippocampus, R_inferior_temporal_gyrus, L_inferior_temporal_gyrus, R_parahippocampal_gyrus, L_parahippocampal_gyrus, R_caudate, L_caudate, L_superior_temporal_gyrus
AD Gene Networks
The hypergeometric test for enrichment was employed, as the hypergeometric distribution models the situation where random samples are selected from a finite population containing a labelled subset. In functional enrichment studies, the hypergeometric test yields the probability of targeting a specific gene (k = 1) from labelled categories (22 gene sets from the 3 archives) when targeting a total of n = 140 genes from the genome. The null hypothesis is that genes were targeted randomly versus an alternative research hypothesis that genes belong to a given annotation (label) were preferentially targeted. All p-values were significant as shown in Supplementary Table 3.
Genetic association study
The results of the genetic association study between the 80 SNPs and the 80 neuroimaging phenotypes are shown in Supplementary Fig. 2(A,B,C). The Pipeline workflow that was used to compute these SNP-imaging biomarker associations is shown in Supplementary Fig. 3.
Among the results of the association among the 200 AD subjects, shown in Supplementary Fig. 2(A), there were several significant results (P<0.01). Among the results of the association among the 383 MCI subjects, shown in Supplementary Fig. 2(B), there were several significant results (P<0.01). Among the results of the association among the 225 NC subjects, shown in Supplementary Fig. 2(C), there were several significant results (P<0.05). In the heatmaps, if the density curve moves to the left (i.e., the teal color) or right (i.e., the pink color) extremes, then association between the corresponding SNPs (rows) and imaging markers (columns) is significant. The vertical curves in each column illustrate the location where the current cell value (i.e., the color) is relative to the distribution [in the range (−3:+3)] of the ordered and standardized p-values. The association results ranked in terms of their p values are shown in Supplementary Table 5(A,B,C).
In addition, we used dynamic circular connectogram graphs shown in Supplementary Fig. 4(A,B,C) to illustrate the relations between the significant SNPs and the neuroimaging biomarkers in the AD, MCI and NC groups. Each of the SNPs (represented by unique RS sequence ID) and each shape morphometry measure, corresponding to the most important ROIs, are represented in the connectogram graph by circularly arranged ideograms. Appearance models (style and color) indicate the relative impact of the corresponding SNP (right) and ROI measure (left semicircle). Data tracks comprise the two concentric rings in the outer shell of the graph. Translocations between circular segments are shown as chordal curves that connect regions brought into adjacency by magnitude of the p-value representing the strength of the SNP-ROI association according to the results of the statistical tests.
IV. Discussion
Shape measures
Table 2 shows the definitions of the five intrinsic geometric cortical measures used in this study, as well as the formulas used to compute them. The principal curvatures (κ1, κ2) were computed using triangulated surface models that represented the boundaries of different brain areas [48]. ID(x,y,z) represents the indicator function of the region of interest (D) [49]; SΩ: r = r(u, v), (u, v) ∈ Ω, is the parametric surface representation of the region boundary [50].
Table 2.
Intrinsic geometric cortical features and their definitions
| Geometric Measure | Mathematical formulas | |
|---|---|---|
| Volume |
|
|
| Surface Area |
|
|
| Mean Curvature |
|
|
| Shape Index |
|
|
| Curvedness |
|
Global Shape Analysis (GSA)
All the p-values of the 80 neuroimaging biomarkers are shown in Supplementary Table 4. The left and right hippocampal volumes were the most significant neuroimaging biomarkers, as we expected. It was followed by the L_inferior_temporal_gyrus (Volume and SurfaceArea). There are several prior brain-morphometry studies [45, 51–53] that indicate that localized brain change may have subtle signature, preserve regional volumes, and require more sensitive surface or tensor-based analytics to detect. We chose to use shape-based morphometry to avoid some of the potential problems with pure volume-based analytics. For example, Shen et al. used voxel-based morphometry (VBM) for gray matter density estimation and FreeSurfer V4 for measuring volume and cortical thickness in terms of neuroimaging genetics, but didn’t get shape-based morphometry.[29]. Stein et al. used tensor-based morphometry (TBM) to measure individual differences in brain structure at the voxel level in terms of neuroimaging genetics, but didn’t get shape-based morphometry [44]. And, Biffi et al. used FreeSurfer V4 for measuring volume and cortical thickness in terms of neuroimaging genetics, but didn’t get shape-based morphometry [30]. In this study, we found significant differences not only for regional brain volumes but also for their boundary shapes, such as surface area and shape index, in nine specific ROIs (Fig. 1) including both hippocampi between AD and NC.
SNP Selection
The rs2075650 and rs11072463 SNPs survived the False Discovery Rate (FDR) correction for the multiple testing (p=1.719e-04 and p=0.03321, respectively), although the significance of the other SNPs was reduced via the FDR correction. Located on the TOMM40 gene, rs2075650 has been previously researched and identified [8, 54–56]. Our association analysis identified the rs2075650 as a most significant marker, but the finding replicates a previous GWAS wherein the location of the SNP (the TOMM40 gene) was asserted as having played a role in the cause of the AD. The TOMM40 gene influences the mitochondrial function and was recently linked to an earlier onset of AD [54]. Interestingly, the rs2075650 (TOMM40) and rs429358 (APOE) haplotype showed greater genome wide association with AD than rs2075650 alone [8]. Previously only considered in union with APOE, due to linkage disequilibrium (LD) between the two genes, TOMM40 has been found to independently influence age of onset of AD. The mitochondrial import channel (TOM) has been implicated in AD as an important site of amyloid precursor protein (APP) accumulation, which can make increase in reactive oxygen species (H2O2) and mitochondrial dysfunction. APP accumulation within the mitochondrial import channel was more abundant in frontal cortex and the hippocampus [57].
rs11072463, located in the PML (promyelocytic leukemia) gene which codes for PML protein was identified as the second most significant SNP. PML is expressed in the hippocampus, cortex, cerebellum, and brain stem in adult mice [58]. Recent studies have provided evidence that PML is associated with neurogenesis [59] in the central nerve system (CNS) and is related to the protein that regulate the cytoskeleton [60], whose expression in the CNS is induced by specific patterns of synaptic activity, long-term potentiation (LTP) and memory formation and consolidation. Increasing evidence also supports a role for PML in regulating synaptic plasticity in the brain [58]. According to previous reports [59], loss of PML appears to affect neurogenesis – it is possible to hypothesize that PML might regulate plasticity and behavior in normal brain function. PML protein and PML mRNA level are upregulated in human AD brains [61]. Recent findings suggest that γ-secretase activity might be upregulated in human AD brains [62]. Presenilin (PS) is part of the γ-secretase complex that produces the Aß. Although the function of PS is well known as a γ-secretase component, PS also regulates various cellular functions including apoptotic cell death. p53 could be an important mediator of PS function in apoptotic cell death induced by DNA damage. Increased level of PML protein is also detected in neurons of the temporal cortex of AD brains, where γ-secretase activity is essential for pathogenesis [61]. It may be reasonable to hypothesize that PML expression is elevated in dementia patients.
Twenty nine genes including the TOMM40 gene (rs2075650 and rs157580, Chr 19) were related to the 32 SNPs that were chosen based on their p values [Supplementary Table 4]. Considering how varied genetic datasets can vary, it is very important to replicate the findings in different datasets with different methods [8, 54, 55, 63]. These SNPs and the genes in which they are located have a lot of important functions and putative pathways or networks through which they can be related with the processes underlying AD. Supplementary Table 6 represents the summary of the genes.
A large European GWAS study identified variants at CLU (rs11136000, Chr 8) and CR1 (rs6656401, Chr 1) associated with AD, in addition to the previously known APOE locus [64]. Harold et al. added PICALM (rs3851179, Chr 11) as associated with AD and extended the SNPs which are associated with AD, such as SSB (rs11894266, Chr 2), MS4A6A (rs610932, rs662196 and rs583791, Chr 11), CNTN5 (rs10501927, Chr 11), B1N1 (rs7561528 and rs744373, Chr 2), MS4A4E (rs676309, Chr 11), DAB1 (rs1539053 Chr 1), C11orf30 (rs11827375, Chr 11), CR1 (rs1408077, rs6701713 and rs3818361, Chr 1). rs9446432 (Chr 6), rs1157242 (Chr 8), and rs9384428 (Chr 6) [65]. In terms of GWAS, the results in these reports are somewhat different from our findings. We did not detect an association with CLU, CR1 and PICALM genes in the current study. CD2AP, CD33, EPHA1, and ABCA7 genes have also been previously studied [66], but we could not find associations of these genes. Among the significantly associated 80 SNPs, we also found various chromosome locations that vary with diagnosis.
AD Gene Network Analysis
Our findings indicate that the set of 140 genes that we chose (from 416 SNPs with p-value < 0.00005) represents commonly appearing genes in known AD gene networks.
Neuroimaging-Genetics Association
For the AD cohort, SNP rs2137962, Chromosome 8, and SNPs in chromosome 3 (rs1498853, rs288503, rs288496) were significantly related with many neuroimaging biomarkers in temporal lobe. This suggests that compared to other brain regions the temporal area may be more influenced by these SNPs [Supplementary Table 5(A)]. Previously, these SNPs (rs2137962, rs1498853, rs288503, rs288496) have not been reported to be associated with specific brain areas in dementia. Potkin et al. reported that APOE (rs429358, rs7412, Chr 19), TOMM40 (rs2075650, rs11556505, Chr 19) were associated with hippocampal volume reductions in AD subjects. EFNA5, ARSB, MAGI2, PRUNE2, and CAND1 genes were considered as associated with hippocampal reductions for AD patients [8]. Biffi et al. reported that the APOE ε allele was strongly associated with all measures except white matter lesion volume (WML), rs1408077 (CR1), rs3851179 (PICALM), and rs10501927 (CNTN5) were associated with entorhinal cortical thickness (ECT), hippocampal volume with ECT, and WML with parahippocampal gyrus thickness [30].
In MCI cohort, the SNPs (rs1702797, rs17028008, rs1251262), chromosome 4, were significantly associated with R_caudate and R_fugiform_gyrus. Further, rs2075650 (TOMM40), chromosome 19, was significantly associated with R_caudate [Supplementary Table 5(B)]. Shen et al. reported that rs2075650 (TOMM40) was significantly associated with bilateral hippocampal volume and left amygdala volume in terms of neuroimaging genetics in a mixed population of NC, MCI and AD [29]. However, in the current study, TOMM40 was most significantly associated with R_caudate mostly in the MCI group.
It is interesting to note that in the NC cohort, the SNPs [rs734854 (STOML1), rs11072463 (PML), rs4886844 (PML), rs1052242 (PML)] included in chromosome 15 were significantly associated with the neuroimaging biomarkers associated with R_hippocampus, L_hippocampus, R_insular_cortex, and L_insular_cortex [Supplementary Table 5(C)]. Thus, we may conclude that the chromosome 15 is closely associated with hippocampal and insular cortical shape. The STOML1 gene codes for stomatin (EPB72)-like 1. Diseases associated with this gene include tuberculosis and neuronitis. The PML gene was most significantly associated with the neuroimaging phenotypes mentioned above especially in the NC group. Additional neuroimaging genetics on both STOML1 and PML genes appear warranted for future studies. rs4899412 (RGS6) located in chromosome 14 was significantly associated with caudate related biomarkers. The RGS6 gene encodes a member of the RGS (regulator of G protein signaling) family of proteins. The RGS proteins negatively regulate G protein signaling, and may modulate neuronal, cardiovascular, lymphocytic activities, and cancer risk. RGS6 exhibits a uniquely robust expression in heart, especially in sinoatrial and atrioventricular nodal regions [67]. The function is known as doing role in heart related pathological situations, but not well known as a factor that can influence on cognitive function. The RGS6 gene can influence the pathophysiological processes underlying AD similarly to APOE ε4 which plays roles in the pathophysiological AD process and as the factors underlying coronary heart disease or cerebrovascular disease as well [68, 69]. In the MCI group, rs2075650 (TOMM40) was most significantly associated with the R_caudate, it was not significantly associated with any of the neuroimaging biomarkers in the NC group. As Hua et al. reported, for healthy elderly subjects, APOE ε2 (but no ε4) carriers had a smaller ventricular volume than homozygous APOE ε3 carriers, which is the commonest genotype [53]. This may support the hypothesis that this APOE ε2 genotype has a protective effect and genetic influence of the APOE on brain structure can happen even in healthy subjects.
We have generated much information from this study, but further studies are required to replicate and expand the study findings using a larger population in terms of neuroimaging genetics. As the currently available data does not provide sufficient information for a detailed study of SNP-brain structure correlations, we do plan to continue pursuing pathways analytic methods for supporting and further validating these findings in terms of neuroimaging genetics of AD. Future functional studies using information in comprehensive pathway databases, including Biocarta, and gene expression/RNAseq data are likely to provide additional insights for the complex interactions between neuroimaging, genetic, epigenetic and phenotypic covariates.
Limitations and future directions
The crucial limitations of this study arose from its small sample size. Because of our restricted power, we were forced to constrain our analysis to SNPs and loci with high prior probabilities of association with AD and imaging phenotypes. Our restricted power also limited the conclusions we drew on our observed differential genetic effects on neuroimaging traits. The possibility of false positive remains for multiple testing. ADNI has developed and validated an automated white matter hyper intensities (WMH) detection method that aligns the imaging data to an elderly template and identifies WMHs on a per-voxel basis based on image intensities and prior knowledge of the probability of WMH occurrence at each location in the brain [70]. We did not manually double-check the entire brain scans of all participants, to avoid potential subjective bias due to rater introduced locations, sizes, or etiology of MRI-evident infarcts in the quality control protocol. So, there is a potential that minor WMH effects may play role in our analyses. The sample only contained mild AD patients (CDR =1), a relatively narrow range of illness, and is thus not fully representative of the disease. Also, the ADNI sample was not collected under an epidemiological ascertainment strategy and the sample size was relatively small for a GWAS study, which may affect the generalizability of the findings. Currently, ADNI does not collect gene expression/RNAseq data and we could not complete a network analysis in terms of neuroimaging genetics at this point in time due to lack of resources and data. Despite the limitations and challenges of this paper, its encouraging results obtained using the proposed analytic framework appear to have potential for enabling the discovery of imaging genetics and for localizing candidate imaging and genomic regions. It is concluded that imaging genetics holds the possibility of yielding important clues for the formulation of an advanced method of early detection and treatment of AD.
Supplementary Material
Acknowledgments
The study design, data analyses and writing of this manuscript were supported in part by NIA P 50 AG16570, NIBIB EB01651, NLM LM05639, NCRR RR019771, NIMH R01 MH071940, NIBIB 9P41EB015922-15, NCRR 2-P41-RR-013642-15, NCRR U54 RR021813, U24-RR025736, U24-RR021992, P20 NR015331, U54 EB020406, P50 NS091856, P30 DK089503, and NSF grants 1416953, 0716055 and 1023115.
This research was partially supported by Basic Science Research Program through the National Research Foundation of Korea (NRF) funded by the Ministry of Education (NRF-2012R1A1A4A01013120).
Data collection and sharing for this project was funded by the Alzheimer’s Disease Neuroimaging Initiative (ADNI) (National Institutes of Health Grant U01 AG024904). ADNI is funded by the National Institute on Aging, the National Institute of Biomedical Imaging and Bioengineering, and through generous contributions from the following: Abbott; Alzheimer’s Association; Alzheimer’s Drug Discovery Foundation; Amorfix Life Sciences Ltd.; AstraZeneca; Bayer HealthCare; BioClinica, Inc.; Biogen Idec Inc.; Bristol-Myers Squibb Company; Eisai Inc.; Elan Pharmaceuticals Inc.; Eli Lilly and Company; F. Hoffmann-La Roche Ltd and its affiliated company Genentech, Inc.; GE Healthcare; Innogenetics, N.V.; IXICO Ltd.; Janssen Alzheimer Immunotherapy Research & Development, LLC.; Johnson & Johnson Pharmaceutical Research & Development LLC.; Medpace, Inc.; Merck & Co., Inc.; Meso Scale Diagnostics, LLC.; Novartis Pharmaceuticals Corporation; Pfizer Inc.; Servier; Synarc Inc.; and Takeda Pharmaceutical Company. The Canadian Institutes of Health Research is providing funds to support ADNI clinical sites in Canada. Private sector contributions are facilitated by the Foundation for the National Institutes of Health (www.fnih.org). The grantee organization is the Northern California Institute for Research and Education, and the study is Rev March 26, 2012 coordinated by the Alzheimer’s Disease Cooperative Study at the University of California, San Diego. ADNI data are disseminated by the Laboratory for Neuro Imaging at the University of Southern California, Los Angeles. This research was also supported by NIH grants P30 AG010129 and K01 AG030514.
Footnotes
Global Shape Analysis Workflow (http://bit.ly/15tK0Hd)
References
- 1.Mayeux R. Epidemiology of neurodegeneration. Annu Rev Neurosci. 2003;26:81–104. doi: 10.1146/annurev.neuro.26.043002.094919. [DOI] [PubMed] [Google Scholar]
- 2.Mayeux R. Alzheimer’s disease: epidemiology. Handb Clin Neurol. 2008;89:195–205. doi: 10.1016/S0072-9752(07)01218-3. [DOI] [PubMed] [Google Scholar]
- 3.Gatz M, et al. Role of genes and environments for explaining Alzheimer disease. Arch Gen Psychiatry. 2006;63(2):168–74. doi: 10.1001/archpsyc.63.2.168. [DOI] [PubMed] [Google Scholar]
- 4.Ertekin-Taner N. Genetics of Alzheimer’s Disease: A centennial review. Neurologic Clinics. 2007;25(3):611–667. doi: 10.1016/j.ncl.2007.03.009. [DOI] [PMC free article] [PubMed] [Google Scholar]
- 5.Lautenschlager NT, et al. Risk of dementia among relatives of Alzheimer’s disease patients in the MIRAGE study: What is in store for the oldest old? Neurology. 1996;46(3):641–50. doi: 10.1212/wnl.46.3.641. [DOI] [PubMed] [Google Scholar]
- 6.Toga AW. Neuroimage databases: the good, the bad and the ugly. Nature reviews. Neuroscience. 2002;3(4):302–9. doi: 10.1038/nrn782. [DOI] [PubMed] [Google Scholar]
- 7.Stein JL, et al. Voxelwise genome-wide association study (vGWAS) NeuroImage. 2010;53(3):1160–74. doi: 10.1016/j.neuroimage.2010.02.032. [DOI] [PMC free article] [PubMed] [Google Scholar]
- 8.Potkin SG, et al. Hippocampal atrophy as a quantitative trait in a genome-wide association study identifying novel susceptibility genes for Alzheimer’s disease. PLoS One. 2009;4(8):e6501. doi: 10.1371/journal.pone.0006501. [DOI] [PMC free article] [PubMed] [Google Scholar]
- 9.Glahn DC, Paus T, Thompson PM. Imaging genomics: mapping the influence of genetics on brain structure and function. Human brain mapping. 2007;28(6):461–3. doi: 10.1002/hbm.20416. [DOI] [PMC free article] [PubMed] [Google Scholar]
- 10.Cannon TD, et al. Mapping heritability and molecular genetic associations with cortical features using probabilistic brain atlases: methods and applications to schizophrenia. Neuroinformatics. 2006;4(1):5–19. doi: 10.1385/NI:4:1:5. [DOI] [PubMed] [Google Scholar]
- 11.Hariri AR, Drabant EM, Weinberger DR. Imaging genetics: perspectives from studies of genetically driven variation in serotonin function and corticolimbic affective processing. Biol Psychiatry. 2006;59(10):888–97. doi: 10.1016/j.biopsych.2005.11.005. [DOI] [PubMed] [Google Scholar]
- 12.Potkin SG, et al. Genome-wide strategies for discovering genetic influences on cognition and cognitive disorders: methodological considerations. Cognitive neuropsychiatry. 2009;14(4–5):391–418. doi: 10.1080/13546800903059829. [DOI] [PMC free article] [PubMed] [Google Scholar]
- 13.Bettens K, Sleegers K, Van Broeckhoven C. Genetic insights in Alzheimer’s disease. The Lancet Neurology. 2013;12(1):92–104. doi: 10.1016/S1474-4422(12)70259-4. [DOI] [PubMed] [Google Scholar]
- 14.Wetzel-Smith MK, et al. A rare mutation in UNC5C predisposes to late-onset Alzheimer’s disease and increases neuronal cell death. Nature medicine. 2014 doi: 10.1038/nm.3736. [DOI] [PMC free article] [PubMed] [Google Scholar]
- 15.Luckhoff HK, et al. Clinical relevance of apolipoprotein E genotyping based on a family history of Alzheimer’s disease. Curr Alzheimer Res. 2015;12(3):210–7. doi: 10.2174/1567205012666150302154354. [DOI] [PubMed] [Google Scholar]
- 16.Schreiber M, Bird TD, Tsuang DW. Alzheimer’s Disease Genetics. Current Behavioral Neuroscience Reports. 2014;1(4):191–196. [Google Scholar]
- 17.Leduc V, et al. HMGCR is a genetic modifier for risk, age of onset and MCI conversion to Alzheimer’s disease in a three cohorts study. Molecular psychiatry. 2014 doi: 10.1038/mp.2014.81. [DOI] [PMC free article] [PubMed] [Google Scholar]
- 18.Sherva R, et al. Genome-wide association study of the rate of cognitive decline in Alzheimer’s disease. Alzheimer’s & Dementia. 2014;10(1):45–52. doi: 10.1016/j.jalz.2013.01.008. [DOI] [PMC free article] [PubMed] [Google Scholar]
- 19.Colhoun HM, McKeigue PM, Smith GD. Problems of reporting genetic associations with complex outcomes. The Lancet. 2003;361(9360):865–872. doi: 10.1016/s0140-6736(03)12715-8. [DOI] [PubMed] [Google Scholar]
- 20.Robinson MR, Wray NR, Visscher PM. Explaining additional genetic variation in complex traits. Trends in Genetics. 2014;30(4):124–132. doi: 10.1016/j.tig.2014.02.003. [DOI] [PMC free article] [PubMed] [Google Scholar]
- 21.Rosenthal SL, et al. Connecting the Dots: Potential of Data Integration to Identify Regulatory SNPs in Late-Onset Alzheimer’s Disease GWAS Findings. PloS one. 2014;9(4):e95152. doi: 10.1371/journal.pone.0095152. [DOI] [PMC free article] [PubMed] [Google Scholar]
- 22.Karch CM, Cruchaga C, Goate AM. Alzheimer’s disease genetics: from the bench to the clinic. Neuron. 2014;83(1):11–26. doi: 10.1016/j.neuron.2014.05.041. [DOI] [PMC free article] [PubMed] [Google Scholar]
- 23.Guerreiro R, Hardy J. Genetics of Alzheimer’s Disease. Neurotherapeutics. 2014;11(4):732–737. doi: 10.1007/s13311-014-0295-9. [DOI] [PMC free article] [PubMed] [Google Scholar]
- 24.Lord J, Cruchaga C. The epigenetic landscape of Alzheimer’s disease. Nature neuroscience. 2014;17(9):1138–1140. doi: 10.1038/nn.3792. [DOI] [PMC free article] [PubMed] [Google Scholar]
- 25.Shattuck DW, et al. Construction of a 3D probabilistic atlas of human cortical structures. Neuroimage. 2008;39(3):1064–1080. doi: 10.1016/j.neuroimage.2007.09.031. [DOI] [PMC free article] [PubMed] [Google Scholar]
- 26.Tu Z, et al. Brain Anatomical Structure Segmentation by Hybrid Discriminative/Generative Models. IEEE Transactions on Medical Imaging. 2008;27(4):495–508. doi: 10.1109/TMI.2007.908121. [DOI] [PMC free article] [PubMed] [Google Scholar]
- 27.Dinov ID, et al. Efficient, Distributed and Interactive Neuroimaging Data Analysis Using the LONI Pipeline. Frontiers in neuroinformatics. 2009;3:22. doi: 10.3389/neuro.11.022.2009. [DOI] [PMC free article] [PubMed] [Google Scholar]
- 28.Dinov I, et al. Neuroimaging study designs, computational analyses and data provenance using the LONI pipeline. PLoS One. 2010;5(9) doi: 10.1371/journal.pone.0013070. [DOI] [PMC free article] [PubMed] [Google Scholar]
- 29.Shen L, et al. Whole genome association study of brain-wide imaging phenotypes for identifying quantitative trait loci in MCI and AD: A study of the ADNI cohort. Neuroimage. 2010;53(3):1051–63. doi: 10.1016/j.neuroimage.2010.01.042. [DOI] [PMC free article] [PubMed] [Google Scholar]
- 30.Biffi A, et al. Genetic variation and neuroimaging measures in Alzheimer disease. Arch Neurol. 2010;67(6):677–85. doi: 10.1001/archneurol.2010.108. [DOI] [PMC free article] [PubMed] [Google Scholar]
- 31.Petersen RC, et al. Alzheimer’s Disease Neuroimaging Initiative (ADNI): clinical characterization. Neurology. 2010;74(3):201–9. doi: 10.1212/WNL.0b013e3181cb3e25. [DOI] [PMC free article] [PubMed] [Google Scholar]
- 32.Morris JC. The Clinical Dementia Rating (CDR): current version and scoring rules. Neurology. 1993;43(11):2412–4. doi: 10.1212/wnl.43.11.2412-a. [DOI] [PubMed] [Google Scholar]
- 33.Purcell S, et al. PLINK: a tool set for whole-genome association and population-based linkage analyses. The American Journal of Human Genetics. 2007;81(3):559–575. doi: 10.1086/519795. [DOI] [PMC free article] [PubMed] [Google Scholar]
- 34.Purcell S, et al. PLINK: A Tool Set for Whole-Genome Association and Population-Based Linkage Analyses. American Journal of Human Genetics. 2007;81(3):559–575. doi: 10.1086/519795. [DOI] [PMC free article] [PubMed] [Google Scholar]
- 35.Price AL, et al. New approaches to population stratification in genome-wide association studies. Nature reviews Genetics. 2010;11(7):459–463. doi: 10.1038/nrg2813. [DOI] [PMC free article] [PubMed] [Google Scholar]
- 36.Jack CR, Jr, et al. The Alzheimer’s Disease Neuroimaging Initiative (ADNI): MRI methods. Journal of magnetic resonance imaging: JMRI. 2008;27(4):685–91. doi: 10.1002/jmri.21049. [DOI] [PMC free article] [PubMed] [Google Scholar]
- 37.Desikan RS, et al. Temporoparietal MR imaging measures of atrophy in subjects with mild cognitive impairment that predict subsequent diagnosis of Alzheimer disease. AJNR American journal of neuroradiology. 2009;30(3):532–8. doi: 10.3174/ajnr.A1397. [DOI] [PMC free article] [PubMed] [Google Scholar]
- 38.Dinov I, et al. Applications of the Pipeline Environment for Visual Informatics and Genomics Computations. BMC Bioinformatics. 2011;12(1):304. doi: 10.1186/1471-2105-12-304. [DOI] [PMC free article] [PubMed] [Google Scholar]
- 39.Smith SM. Fast robust automated brain extraction. Human Brain Mapping. 2002;17(3):143–155. doi: 10.1002/hbm.10062. [DOI] [PMC free article] [PubMed] [Google Scholar]
- 40.Pieper S, et al. The NA-MIC Kit: ITK, VTK, pipelines, grids and 3D slicer as an open platform for the medical image computing community. Biomedical Imaging: Nano to Macro, 2006. 3rd IEEE International Symposium on. 2006 [Google Scholar]
- 41.Zhang B, et al. Integrated systems approach identifies genetic nodes and networks in late-onset Alzheimer’s disease. Cell. 2013;153(3):707–720. doi: 10.1016/j.cell.2013.03.030. [DOI] [PMC free article] [PubMed] [Google Scholar]
- 42.Bleazard T, Lamb JA, Griffiths-Jones S. Bias in microRNA functional enrichment analysis. Bioinformatics. 2015;31(10):1592–1598. doi: 10.1093/bioinformatics/btv023. [DOI] [PMC free article] [PubMed] [Google Scholar]
- 43.Hunter DJ, et al. A genome-wide association study identifies alleles in FGFR2 associated with risk of sporadic postmenopausal breast cancer. Nature Genetics. 2007;39(7):870–874. doi: 10.1038/ng2075. [DOI] [PMC free article] [PubMed] [Google Scholar]
- 44.Stein JL, et al. Voxelwise genome-wide association study (vGWAS) Neuroimage. 2010 doi: 10.1016/j.neuroimage.2010.02.032. [DOI] [PMC free article] [PubMed] [Google Scholar]
- 45.Hibar DP, et al. Voxelwise gene-wide association study (vGeneWAS): multivariate gene-based association testing in 731 elderly subjects. Neuroimage. 2011;56(4):1875–91. doi: 10.1016/j.neuroimage.2011.03.077. [DOI] [PMC free article] [PubMed] [Google Scholar]
- 46.Krzywinski MI, et al. Circos: An information aesthetic for comparative genomics. Genome Research. 2009 doi: 10.1101/gr.092759.109. [DOI] [PMC free article] [PubMed] [Google Scholar]
- 47.Al-Aziz J, Christou N, Dinov I. SOCR Motion Charts: An Efficient, Open-Source, Interactive and Dynamic Applet for Visualizing Longitudinal Multivariate Data. JSE. 2010;18(3):1–29. doi: 10.1080/10691898.2010.11889581. [DOI] [PMC free article] [PubMed] [Google Scholar]
- 48.Terzopoulos D. The computation of visible-surface representations. IEEE Transactions on Pattern Analysis and Machine Intelligence. 1988:417–438. [Google Scholar]
- 49.Larson R, Edwards BH. Calculus. Brooks/Cole Pub Co; 2009. [Google Scholar]
- 50.Santaló LA. Integral geometry and geometric probability. Cambridge Univ Pr; 2004. [Google Scholar]
- 51.Frisoni GB, et al. Structural correlates of early and late onset Alzheimer’s disease: voxel based morphometric study. J Neurol Neurosurg Psychiatry. 2005;76(1):112–4. doi: 10.1136/jnnp.2003.029876. [DOI] [PMC free article] [PubMed] [Google Scholar]
- 52.Karas G, et al. Precuneus atrophy in early-onset Alzheimer’s disease: a morphometric structural MRI study. Neuroradiology. 2007;49(12):967–76. doi: 10.1007/s00234-007-0269-2. [DOI] [PubMed] [Google Scholar]
- 53.Hua X, et al. Tensor-based morphometry as a neuroimaging biomarker for Alzheimer’s disease: an MRI study of 676 AD, MCI, and normal subjects. Neuroimage. 2008;43(3):458–69. doi: 10.1016/j.neuroimage.2008.07.013. [DOI] [PMC free article] [PubMed] [Google Scholar]
- 54.Roses AD, et al. A TOMM40 variable-length polymorphism predicts the age of late-onset Alzheimer’s disease. Pharmacogenomics J. 2010;10(5):375–84. doi: 10.1038/tpj.2009.69. [DOI] [PMC free article] [PubMed] [Google Scholar]
- 55.Shi H, et al. Genetic variants influencing human aging from late-onset Alzheimer’s disease (LOAD) genome-wide association studies (GWAS) Neurobiol Aging. 2012;33(8):1849 e5–18. doi: 10.1016/j.neurobiolaging.2012.02.014. [DOI] [PMC free article] [PubMed] [Google Scholar]
- 56.Guerreiro RJ, Hardy J. TOMM40 association with Alzheimer disease: tales of APOE and linkage disequilibrium. Arch Neurol. 2012;69(10):1243–4. doi: 10.1001/archneurol.2012.1935. [DOI] [PubMed] [Google Scholar]
- 57.Devi L, et al. Accumulation of amyloid precursor protein in the mitochondrial import channels of human Alzheimer’s disease brain is associated with mitochondrial dysfunction. Journal of Neuroscience. 2006;26(35):9057–9068. doi: 10.1523/JNEUROSCI.1469-06.2006. [DOI] [PMC free article] [PubMed] [Google Scholar]
- 58.Butler K, Martinez LA, Tejada-Simon MV. Impaired cognitive function and reduced anxiety-related behavior in a promyelocytic leukemia (PML) tumor suppressor protein-deficient mouse. Genes Brain and Behavior. 2013;12(2):189–202. doi: 10.1111/gbb.12014. [DOI] [PubMed] [Google Scholar]
- 59.Regad T, et al. The tumor suppressor Pml regulates cell fate in the developing neocortex. Nat Neurosci. 2009;12(2):132–40. doi: 10.1038/nn.2251. [DOI] [PubMed] [Google Scholar]
- 60.Bloomer WA, VanDongen HM, VanDongen AM. Activity-regulated cytoskeleton-associated protein Arc/Arg3.1 binds to spectrin and associates with nuclear promyelocytic leukemia (PML) bodies. Brain Res. 2007;1153:20–33. doi: 10.1016/j.brainres.2007.03.079. [DOI] [PubMed] [Google Scholar]
- 61.Song H, et al. Critical role of presenilin-dependent gamma-secretase activity in DNA damage-induced promyelocytic leukemia protein expression and apoptosis. Cell Death and Differentiation. 2013;20(4):639–648. doi: 10.1038/cdd.2012.162. [DOI] [PMC free article] [PubMed] [Google Scholar]
- 62.Rothhaar TL, et al. Plasmalogens Inhibit APP Processing by Directly Affecting gamma-Secretase Activity in Alzheimer’s Disease. Scientific World Journal. 2012 doi: 10.1100/2012/141240. [DOI] [PMC free article] [PubMed] [Google Scholar]
- 63.Ferencz B, et al. The influence of APOE and TOMM40 polymorphisms on hippocampal volume and episodic memory in old age. Front Hum Neurosci. 2013;7:198. doi: 10.3389/fnhum.2013.00198. [DOI] [PMC free article] [PubMed] [Google Scholar]
- 64.Lambert JC, et al. Genome-wide association study identifies variants at CLU and CR1 associated with Alzheimer’s disease. Nature Genetics. 2009;41(10):1094–U68. doi: 10.1038/ng.439. [DOI] [PubMed] [Google Scholar]
- 65.Harold D, et al. Genome-wide association study identifies variants at CLU and PICALM associated with Alzheimer’s disease. Nat Genet. 2009;41(10):1088–93. doi: 10.1038/ng.440. [DOI] [PMC free article] [PubMed] [Google Scholar]
- 66.Hollingworth P, et al. Common variants at ABCA7, MS4A6A/MS4A4E, EPHA1, CD33 and CD2AP are associated with Alzheimer’s disease. Nat Genet. 2011;43(5):429–35. doi: 10.1038/ng.803. [DOI] [PMC free article] [PubMed] [Google Scholar]
- 67.Stewart A, Huang J, Fisher RA. RGS Proteins in Heart: Brakes on the Vagus. Front Physiol. 2012;3:95. doi: 10.3389/fphys.2012.00095. [DOI] [PMC free article] [PubMed] [Google Scholar]
- 68.Kuusisto J, et al. Apolipoprotein E4 phenotype is not an important risk factor for coronary heart disease or stroke in elderly subjects. Arterioscler Thromb Vasc Biol. 1995;15(9):1280–6. doi: 10.1161/01.atv.15.9.1280. [DOI] [PubMed] [Google Scholar]
- 69.Verghese PB, Castellano JM, Holtzman DM. Apolipoprotein E in Alzheimer’s disease and other neurological disorders. Lancet Neurol. 2011;10(3):241–52. doi: 10.1016/S1474-4422(10)70325-2. [DOI] [PMC free article] [PubMed] [Google Scholar]
- 70.Schwarz C, Fletcher E, DeCarli C, Carmichael O. Fully-automated white matter hyperintensity detection with anatomical prior knowledge and without FLAIR. Information processing in medical imaging. 2009;5636:239–251. doi: 10.1007/978-3-642-02498-6_20. [DOI] [PMC free article] [PubMed] [Google Scholar]
Associated Data
This section collects any data citations, data availability statements, or supplementary materials included in this article.