Abstract
Retinoic acid (RA) has been used therapeutically to reduce injury and fibrosis in models of AKI, but little is known about the regulation of this pathway and what role it has in regulating injury and repair after AKI. In these studies, we show that RA signaling is activated in mouse and zebrafish models of AKI, and that these responses limit the extent of injury and promote normal repair. These effects were mediated through a novel mechanism by which RA signaling coordinated the dynamic equilibrium of inflammatory M1 spectrum versus alternatively activated M2 spectrum macrophages. Our data suggest that locally synthesized RA represses proinflammatory macrophages, thereby reducing macrophage-dependent injury post-AKI, and activates RA signaling in injured tubular epithelium, which in turn promotes alternatively activated M2 spectrum macrophages. Because RA signaling has an essential role in kidney development but is repressed in the adult, these findings provide evidence of an embryonic signaling pathway that is reactivated after AKI and involved in reducing injury and enhancing repair.
Keywords: acute renal failure, signaling, macrophages, tubular epithelium, renal injury, renal proximal tubule cell
Retinoic acid (RA) plays an essential role in kidney development,1,2 and reactivation of RA signaling in adults plays an important role in limb,3,4 fin, and heart regeneration in amphibians and fish.5,6 RA agonists reduce injury, inflammation, and fibrosis in models of renal injury, including toxin and ischemia-reperfusion–AKI (IR-AKI).7–13 Despite this, the role and regulation of RA signaling after AKI are largely unknown.
Inflammatory M1 macrophages are recruited to the kidney where they amplify inflammatory responses and promote tissue damage. Over a period of days, these macrophages are replaced by alternatively activated M2 macrophages that promote repair.14,15 The mechanisms regulating macrophage phenotypes are poorly understood. Colony stimulating factors 1 and 2 are secreted by tubular epithelium, and promote the expansion of M2 macrophages post-AKI.15–17 However, macrophage responses represent a spectrum of phenotypes that are likely to be dependent on multiple convergent signals after injury.18–20 Therefore, a number of additional signaling pathways are likely to converge to define macrophage phenotypes after AKI.
We show that RA signaling is activated in tubular epithelial cells and macrophages within hours of injury, and that RA reduces macrophage-dependent injury and fibrosis after AKI. Utilizing loss and gain of function as well as in vivo genetic approaches in zebrafish and mice, we demonstrate that RA regulates macrophage activation by suppressing inflammatory M1 spectrum macrophages, and indirect induction of alternatively activated M2 spectrum macrophages via RA signaling in tubular epithelial cells.
Results
RA Signaling Increases in the Kidney of Zebrafish Larvae after AKI
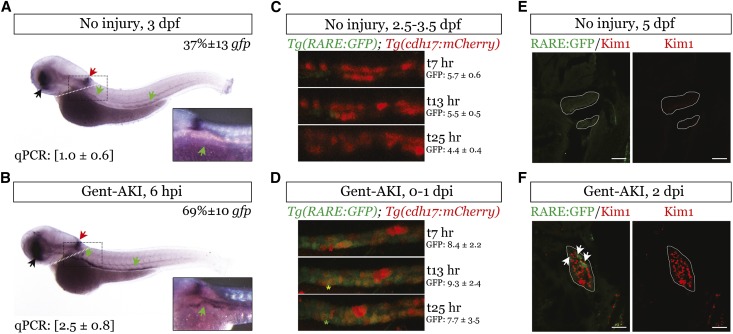
We evaluated RA signaling after gentamicin-induced AKI in zebrafish larvae,21–23 using the transgenic RA reporter, Tg(12XRARE:EGFP).24,25 A proportion of larvae retain gfp expression in the kidney through 4 days postfertilization (dpf) (21±8%, n=9 experiments, 12–16 larvae/group). However, there were increased numbers of fish with strong gfp mRNA expression throughout the kidney 6 hours after injury (Figure 1, A and B, Supplemental Table 1). Trunk gfp mRNA was increased at 6 hours after injury (Figure 1, A and B insets). Time-lapse imaging in Tg(12XRARE:EGFP); Tg(cdh17:mCherry) fish was used to visualize RA signaling in tubular epithelial cells, using loss of cdh17:mCherry expression as a marker of tubular cell dedifferentiation after injury.26 Green fluorescent protein (GFP) fluorescence decreased over time in uninjured controls, and increased post-AKI (Figure 1, C and D, Supplemental Movies, 1 and 2). We observed red cells (mCherry) that turned yellow (overlay GFP) and eventually green (GFP and loss of mCherry) (Figure 1, C and D, Supplemental Movie 2). We also evaluated whether retinoic acid response element-GFP expression occurred in injured cells using Kim1, a marker of injured proximal tubular epithelial cells (PTECs).27 Trunk Kim1 mRNA increased 1–2 days after gentamicin (days postinjection, dpi) (Supplemental Figure 1, A and B, Supplemental Table 1). Kim1 was expressed in PTECs at 1 and 2 dpi (Supplemental Figure 1C), and Kim1 co-localized with RARE-GFP–expressing tubular epithelial cells after injury (Figure 1, E and F). These data indicate that RA signaling is rapidly activated in tubular epithelial cells that subsequently dedifferentiate and express the tubular injury marker Kim1 after gentamicin injection.
Figure 1.
RA signaling is increased in zebrafish larval kidneys after AKI. We injected Tg(12XRARE:EGFP) zebrafish larvae with 8 ng of gentamicin at 2.5 or 3 dpf to induce renal injury. (A and B) Whole-mount in situ hybridization comparing gfp mRNA expression in larvae injected with gentamicin (gent-AKI) and uninjured controls 6 hpi. Colored arrows show domains of expression: retina (black), anterior spinal cord (red), and kidney (green). Original magnification, ×2.5. Inset: Higher magnification of the proximal tubule in the boxed region. Percent gfp quantifies the number of fish with strong, pan-renal expression (n=3 experiments at 3 dpf, ≥12 larvae/group, mean±SEM). qRT-PCR gfp mRNA expression for dissected trunk tissue posterior to the white dotted line are in brackets below the in situ image, mean fold change±SEM (n=3 experiments, 15 larvae/group). Normalized to β-actin and SDHA. (C and D) Single images from live time-lapse multi-photon imaging showing a region of the proximal tubule of Tg(12XRARE:GFP); Tg(cdh17:mCherry) double transgenic fish. Imaging was performed for 21 hours beginning at 4 hours after gentamicin injection. Red indicates Cdh17-positive, differentiated renal epithelial cells (example, red asterisk), green indicates RA reporter–positive cells (example, green asterisk), and yellow indicates double-positive cells (example, yellow asterisk). Original magnification, ×25. GFP values indicate average fluorescence intensity±SEM for the image stack at the indicated time point (n=10 uninjured and 6 gent-AKI nephrons). (E and F) Immunofluorescence staining for Kim1 (red) and GFP (green) in the kidney of Tg(12XRARE:GFP) fish at 2 dpi. Examples of co-localization are indicated by white arrows. Tubules are outlined in white. Scale bars, 20 µm. hpi, hours after injury.
Inhibition of RA Signaling in Zebrafish Larvae Exacerbates Renal Tubular Injury after AKI
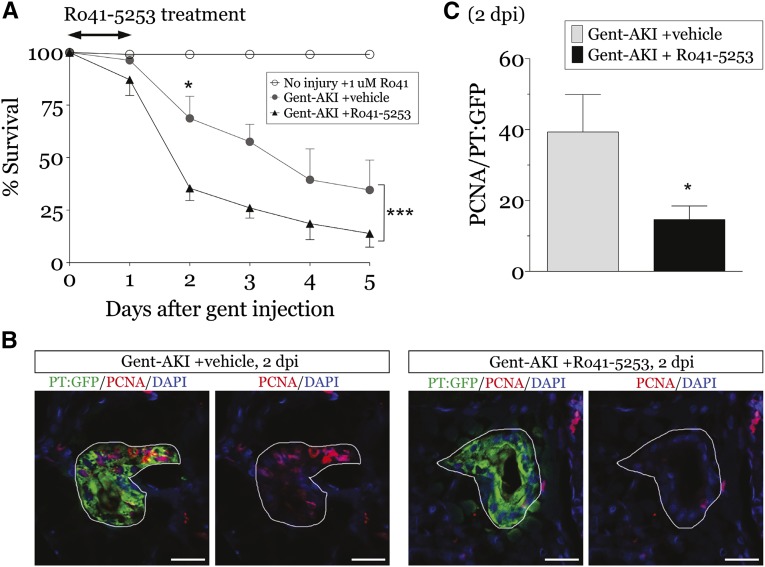
To examine the role of RA signaling post-AKI, larvae were treated with the retinoic acid receptor (RAR) antagonist, Ro41–5253.25,28,29 One micromole of Ro41–5253 blocked all domains of gfp expression in Tg(12XRARE:GFP) larvae without negative effects on health (Supplemental Figure 2). Larvae treated with Ro41–5253 immediately after gentamicin injection had decreased survival (Figure 2A), indicating impaired functional recovery.22,23 Ro41–5253-treated larvae also had decreased proliferating cell nuclear antigen (PCNA) plus PTECs at 2 dpi (Figure 2, B and C). These data indicate that RA signaling is critical for recovery and promotes PTEC proliferation in larval zebrafish post-AKI.
Figure 2.
Blocking RA pathway activation exacerbates AKI in zebrafish larvae. Zebrafish larvae were injected with 8 ng gentamicin at 3 dpf to induce renal injury, followed by treatment with vehicle (1% DMSO) or 1 µM Ro41–5253 for 24 hours. (A) Uninjured or gent-AKI larvae were treated with Ro41–5253 and their survival assessed daily through 5 dpi (n=4 experiments, ≥25 larvae/group). Two-way ANOVA, ***P<0.001. Bonferroni’s correction for multiple comparisons between vehicle and Ro41–5253-treated larvae at the same time points: *P<0.05. (B and C) Immunofluorescence for PCNA (red) and GFP (green) in the proximal tubule of Tg(PT:EGFP) fish at 2 dpi. PCNA-positive cells were quantified in the proximal tubule by examining serial sections (n=5 larvae/group). Data expressed as mean+SEM. Two-tailed t test, *P<0.05. Tubules are outlined in white. Scale bars, 20 µm.
RA Signaling is Rapidly and Transiently Activated in the Mouse Kidney after AKI
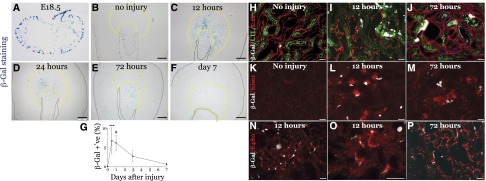
We evaluated RA signaling using RARE-hsp68-lacZ reporter mice.30 β-Galactosidase (β-Gal) was restricted to occasional cells in the papilla in uninjured adult kidneys (Figure 3, A and B),1,31 but was widely expressed in RARE-hsp68-lacZ mice, but not wild-type mice, 24 hours post-AKI (Supplemental Figure 3). β-Gal was maximal 12–24 hours after injury, persisted at 72 hours, and returned to baseline by day 7 (Figure 3, B–G). β-Gal was expressed throughout the medulla with patchy cortical expression. RARE-hsp68-LacZ was activated in collecting duct epithelium (dolichos biflorus lectin) in uninjured and injured kidneys 72 hours post-AKI (Supplemental Figure 4, A and B). No PTEC β-Gal expression was detected in uninjured kidneys, but β-Gal–positive Lotus tetraglonolobus lectin and Kim1-positive PTECs were detected after injury (Figure 3, H–M, Supplemental Figure 4, C and D). β-Gal was not expressed in thick limb (Tamm–Horsfall Protein), or thin limb (lotus tetraglonolobus lectin–negative, Aquaporin 1, AQP1-positive) (Supplemental Figure 4, C and D), but was detected in macrophages post-AKI (Figure 3, N–P).
Figure 3.
RA signaling is activated in the kidney after IR-AKI in mice. Unilateral IR-AKI was performed in male RARE-hsp68-lacZ reporter mice. (A–F) RARE-dependent β-Gal activity in (A) E18.5 embryonic kidney, (B) uninjured kidneys, and injured kidneys at (C) 12, (D) 24, (E) 72 hours, and (F) day 7 after injury, as indicated. Yellow dotted lines demarcate limits of the OM. (G) Quantification of RARE-hsp68-lacZ reporter activity time course after injury. Percent β-Gal–positive area in the OM: uninjured mice (n=12), 12 hours (n=9), 24 hours (n=13), 72 hours (n=8) and day 7 (n=11) after injury. Kruskal–Wallis one-way ANOVA (P<0.001) using Dunn’s test for multiple comparisons with uninjured controls: ***P<0.001, #P<0.001. (H–P) Cellular localization of β-Gal activity in RARE-hsp68-lacZ reporter kidneys after IR-AKI. β-Gal is pseudocolored in white, other markers as indicated. Timing after injury, as indicated. (H and J) Proximal tubular cell marker, lotus tetraglonolobus lectin (green) and Collagen IV (red). (K–M) Proximal tubular cell injury marker, Kim1 (red). (N and P) Macrophage/dendritic cell marker F4/80 (red). Black scale bars, 500 µm; white bars, 50 µm.
Peritubular Macrophages Express RA-Synthesizing Enzymes after IR-AKI
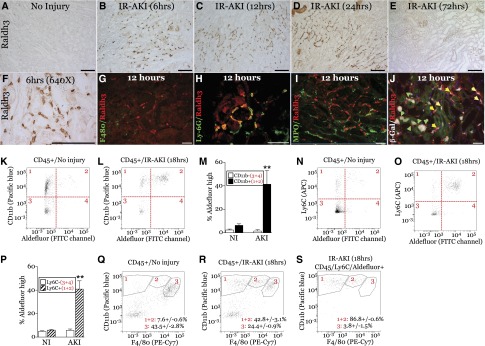
We examined the expression of RA-synthesizing enzymes, the retinaldehyde dehydrogenases, Raldh1–4.32,33 Raldh3 mRNA paralleled the kinetics of the RARE-hsp68-LacZ activity, and the RAR target gene, Cyp26B1,34 after AKI (Supplemental Figure 5, A and B). Raldh3 was restricted to the papilla in uninjured mice (Supplemental Figure 6, A and B), but was expressed by peritubular cells in the outer medulla (OM) 6–24 hours post-AKI (Figure 4, A–F). Raldh3 was also expressed in the inner medulla with patchy expression in the cortex (Supplemental Figure 6, C and D). Raldh3+ cells were F4/80-negative, but 98.2%±0.63% (mean±SEM, n=4) expressed the neutrophil/macrophage marker Lys6G 12 hours after injury (Figure 4, G and H). Raldh3+ cells did not express the neutrophil marker myeloperoxidase (Figure 4I).35 To establish whether Raldh3+ cells activate RA signaling, we evaluated Raldh3 and β-Gal in RARE-hsp68-LacZ reporter mice. Raldh3+ cells surrounded β-Gal+ tubular cells 12 hours post-AKI (Figure 4J). A number of β-Gal+ cells also co-labeled with Raldh3 (Figure 4J), suggesting paracrine Raldh3-dependent RA signaling in tubular epithelium, and autocrine RA signaling in macrophages. Because Raldh3 is an aldehyde dehydrogenase (ALDH),33 we used ALDEFLUOR to identify cells with ALDH activity in the kidney by FACS.36 There were increased ALDEFLUOR high CD45/CD11b+ and CD45/Ly6C+ cells 18 hours after injury (Figure 4, K–P). Of ALDEFUOR high cells, 95.9%±2.0% were CD11b+, and 86.7%±3.7% Ly6C+. To characterize CD45/Ly6C+ ALDEFLOR high cells, we first evaluated F4/80 and CD11b in CD45+ cells after injury. As previously reported,37 the majority of F4/80+ cells are F4/80 high/CD11b low in uninjured kidneys (Figure 4Q). Increased numbers of CD11b high cells express low or no F4/80 after injury (Figure 4R). These markers are typical of inflammatory macrophages recruited to the kidney at early time points after injury.37,38 Using the same CD11b and F4/80 gates, 86.8%±0.6% ALDEFLUOR high, CD45/Ly6C+ cells are F4/80 low or negative in the injured kidney (Figure 4S). These data are consistent with Raldh3 localization studies, suggesting the majority of Raldh3/ALDH high cells are infiltrating macrophages early after injury.
Figure 4.
Raldh3 is expressed at sites of RA signaling at early time points after IR-AKI. Unilateral IR-AKI was performed in wild-type BALB/c or RARE-hsp68-LacZ mice, and kidneys harvested at the indicated times after injury. (A–F) Localization of Raldh3 expression in the OM at 0, 6, 12, 24, and 72 hours in the OM after IR-AKI. Kidney sections stained with anti-Raldh3 antibody, detected using horse radish peroxidase/3,3ʹ-diaminobenzidine substrate, counterstained with hematoxylin. (A–E) Original magnification, ×200. (F) Original magnification, ×640. (G–J) Cellular localization of Raldh3 in the OM after IR-AKI. Co-staining Raldh3 (red) with (G) macrophage/dendritic cells marker, F4/80 (green), (H) neutrophil and early infiltrating macrophage marker, Ly-6G (green), and (I) neutrophil marker, myeloperoxidase (green). (J) Co-localization of Raldh3 expression and RA signaling 12 hours after IR-AKI. β-Gal activity was detected in RARE-hsp68-LacZ reporter mice, and sections stained with Raldh3 antibodies (red). β-Gal pseudocolored in white, green autofluorescence shows renal tubular structures. Green arrows indicate Raldh3-positive cells surrounding β-Gal–positive renal tubular cells; yellow arrows indicate Raldh3-expressing cells that are also β-Gal–positive. White scale bars, 50 mm, black bars, 100 mm. (K–S) FACS analysis of ALDH activity in CD45+ renal leukocytes using the ALDEFLUOR reagent. (K–M) CD11b and ALDEFLUOR fluorescence in uninjured and injured kidney. (K and L) Representative dot plots indicating CD11b and ALDEFLUOR high and low quadrant gates. (M) Quantification of ALDEFLUOR high CD11b + and – cells. (N–P) Ly6C and ALDEFLUOR fluorescence in uninjured and injured kidney. (N and O) Representative dot plots indicating Ly6C and ALDEFLUOR high and low quadrant gates. (P) Quantification of ALDEFLUOR high Ly6C + and – cells. (Q and R) Representative dot plots of F4/80 and CD11b fluorescence in uninjured and injured kidneys. Gating for F4/80- (1), F4/80 low (2) and F4/80 high (3) indicated and quantified. (S) Representative dot plots of F4/80 and CD11b fluorescence in Ly6C/ALDEFLUOR high cells (gate 2 in O) in injured kidneys. Results expressed as mean±SEM % of total gated cells (CD45+ or CD45/Ly6C/ALDEFLUOR high cells, as indicated). n=3 mice per condition. (N and Q) t Test comparing CD11b+ or Ly6C+ cells from uninjured versus injured kidneys, **P<0.01.
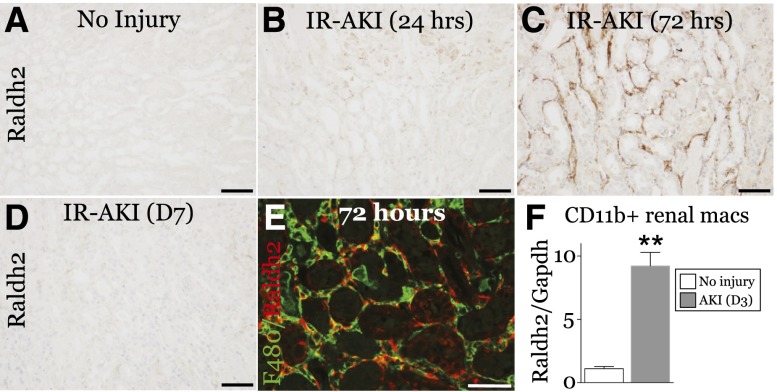
We also evaluated the expression of Raldh1, -2 and -4 mRNAs. Raldh4 decreased, and Raldh1 mRNA increased 24 hours after injury, but levels were unchanged thereafter. Raldh2 mRNA progressively increased 1–7 days after injury (Supplemental Figure 5, C–E). Raldh2 protein was widely distributed in peritubular cells throughout the kidney at 72 hours, but was undetectable 7 days after injury (Figure 5, A–D, Supplemental Figure 7). Of Raldh2 cells, 87.5±1.5% express F4/80 (Figure 5E), and CD11b+ renal macrophages and dendritic cells express high levels of Raldh2 3 days post-AKI (Figure 5F). These data suggest that Raldh3+ macrophages recruited to injured tubules synthesize RA for the first 24 hours after AKI, and that Raldh2+ macrophages might also drive RA synthesis at later time points.
Figure 5.
Raldh2 is expressed at sites of RA-signaling activity 72 hours after IR-AKI. Unilateral IR-AKI was performed in wild-type BALB/c mice, and kidneys harvested at the indicated times after injury. (A–D) Localization of Raldh2 expression at 0, 24, 72 hours, and 7 days after IR-AKI, as indicated. Kidney sections stained with anti-Raldh2 antibody, detected using horse radish peroxidase/3,3ʹ-diaminobenzidine substrate, counterstained with hematoxylin. (E) Co-localization of Raldh2 (red) with F4/80-positive macrophages (green) in the OM 72 hours after IR-AKI. White scale bar, 50 µm; black bars, 100 µm. (F) Expression of Raldh2 mRNA in renal macrophages 72 hours after IR-AKI. qRT-PCR for Raldh2 mRNA relative to Gapdh control mRNA was performed on RNA extracted from renal macrophages isolated using magnetic beads coated with anti-CD11b antibodies: uninjured mice (n=3), and mice 3 days after injury (n=8). Results expressed as mean±SEM fold change relative to uninjured controls. Two-tailed t test, **P<0.01 versus uninjured controls.
Inhibition of RA Signaling Early after IR-AKI Exacerbates Postinjury Renal Fibrosis
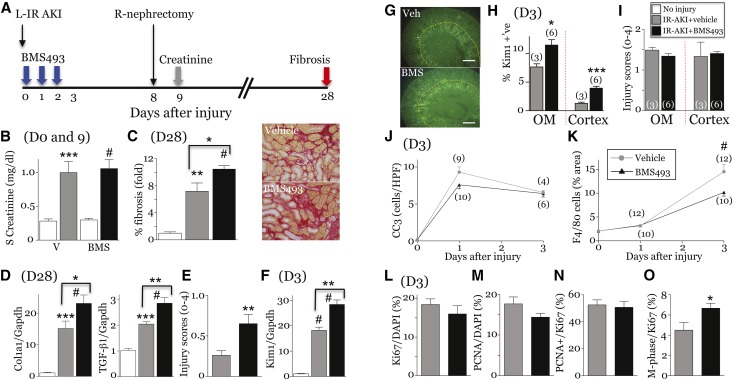
To evaluate the role of RA post-AKI, we used the pan-RAR inverse agonist, BMS493.39,40 BMS493 was initiated at the time of injury and continued for 72 hours (Figure 6A). Mice were treated with 20 mg/kg per day BMS493, the minimum dose inhibiting AKI-induced RARE-hsp68-LacZ activity (Supplemental Figure 8, A and B) and upregulation of RAR target genes, Cyp26B1, RARb and Rbp1 (Supplemental Figure 8, C–E).34,41 BMS493 had no effect on serum creatinine (Figure 6B), but increased interstitial fibrosis (Sirius red (SR) staining), expression of fibrosis markers, and chronic tubular injury scores 28 days post-AKI (Figure 6, C–E). BMS493 increased renal Kim1 mRNA, and Kim1 protein in the cortex and OM 3 days after injury (Figure 6, F–H), but had no effect on tubular apoptosis or injury by histologic scoring at this time point (Figure 6, I and J). To determine whether BMS493 has an early effect on injury, we evaluated mice undergoing unilateral IR-AKI and simultaneous contralateral nephrectomy. There was a minor increase in cortical tubular injury in BMS493-treated mice 24 hours after injury, but no differences in serum creatinine (Supplemental Figure 9). Paradoxically, this minor increase in tubular injury was associated with approximately 30% reduction in renal macrophages in BMS493-treated mice 3 days post-AKI (Figure 6K). This was not mediated by changes in the expression of macrophage growth factors or chemokines because CSF1 mRNA was increased, and the expression of chemokines implicated in macrophage recruitment after IR-AKI37,42 were unchanged (CCL2 and CCL3) or increased (CX3CL1and CCL5) after BMS493 treatment (Supplemental Figure 10). There was no change in tubular proliferation in BMS493-treated mice (Figure 6, L–N), but there was an increase in the proportion of Ki67 and phospho-histone H3 double-positive tubular cells in M-phase post-AKI (Figure 6O). This may be a consequence of the increased severity of renal injury in BMS493-treated mice.43
Figure 6.
Early inhibition of RA signaling exacerbates postinjury fibrosis after IR-AKI. (A) Schematic of the experiment. Studies performed in uninjured controls (n=3–6), vehicle- (n=4–8) and BMS493-treated (n=6–10) mice at day 3, and vehicle- (n=7–12) and BMS493-treated (n=7–10) mice day 28 post-AKI unless indicated in the figure. (B) Serum creatinines days 0 and 9 post-AKI. (C) Renal fibrosis day 28 after injury. Percent fibrosis in the OM. Images showing SR staining. (D) Expression of fibrosis markers. qRT-PCR for collagen 1a1 chain (Col1a1) and TGF-β1 mRNAs relative to Gapdh day 28 post-AKI. (E) Chronic tubular injury scores (OM). Injury scores at day 28. t Test: **P<0.01. (F–I) Early tubular injury after IR-AKI. (F) Tubular injury marker, Kim1 mRNA, at day 3. (G and H) Kim1 localization 3 days after IR-AKI. (G) Representative images showing Kim1 expression. Yellow dotted lines demarcate the OM. (H) Quantification of Kim1 in the OM and cortex. t Test, *P<0.05; ***P<0.001. (I) Acute tubular injury scores. Injury scores in the OM and cortex at day 3. t Test: NS. (J) Tubular apoptosis. Cleaved caspase-3–positive cells/HPF. Two-way ANOVA: NS treatment effect. (K) Renal macrophages. Surface area of F4/80 macrophages. Two-way ANOVA: P<0.01, vehicle versus BMS493: #P<0.001. (L–O) Tubular proliferation at day 3 (OM). t Test, *P<0.05. Results expressed as mean±SEM. (C, D, and F) Fold change relative to uninjured controls. One-way ANOVA for B–D, and F, results indicated if one-way ANOVA: P≤0.05; *P<0.05; **P<0.01; ***P<0.001; #P<0.001. Comparison with uninjured controls (no brackets), or vehicle- and BMS493-treated mice (brackets).
Increased Injury after Inhibiting RA Signaling is Dependent on Renal Macrophages Post-AKI
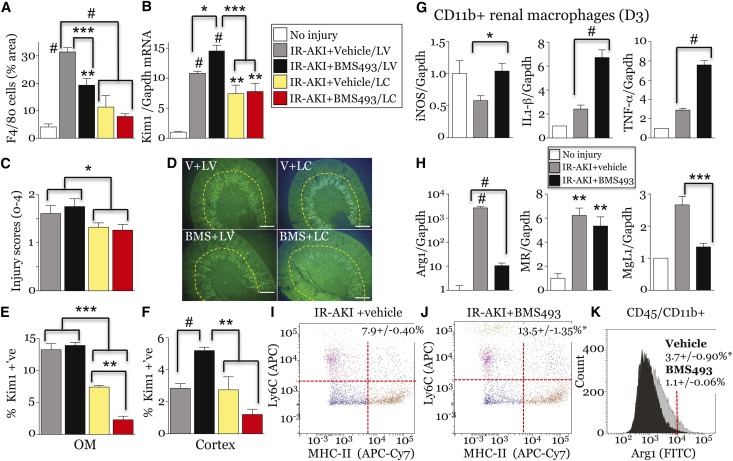
To determine whether BMS493 effects are dependent on macrophages, we used liposomal clodronate (LC) to deplete macrophages before renal injury.44 LC reduced F4/80+ renal macrophages/dendritic cells by approximately 70% (Figure 7A), and reduced renal Kim1 mRNA and tubular injury scores by approximately 25% 3 days post-AKI (Figure 7, B and C). This indicates that macrophages mediate a subset of renal tubular injury responses after IR-AKI. BMS493 increased Kim1 mRNA, and Kim1 protein was increased in the cortex 3 days post-AKI, effects that were lost after treatment with LC (Figure 7, B–F). Thus, renal macrophages are required to mediate BMS493-dependent effects on renal injury. To determine how BMS493 regulates macrophage-dependent injury, we examined renal macrophage markers. There was increased expression of M1 spectrum markers, iNOS, IL1β and TNFα, and decreased M2 markers Arg1 and Mgl1, in renal macrophages from BMS493-treated mice (Figure 7, G and H). FACS analysis demonstrated an increased proportion of Ly6C and MHC Class II antigen high renal macrophages (both markers of M1 macrophages19,45) in BMS493-treated mice 3 days after IR-AKI (Figure 7, I and J). Conversely there was reduced expression of intracellular Arg1 protein in renal macrophages from BMS493-treated mice (Figure 7K). Because M1 macrophages increase injury and M2 spectrum macrophages promote repair,15 these data suggest RA signaling regulates post-AKI injury and repair by regulating the activation of renal macrophages.
Figure 7.
BMS493 increases macrophage-dependent tubular injury and deregulates macrophage polarization after IR-AKI. (A–E) Macrophage depletion prevents BMS493-dependent renal injury after IR-AKI. Unilateral IR-AKI was performed in mice pretreated with LC, or LV, and randomized to receive BMS493 (BMS+LV, n=9; BMS+LC, n=6), or vehicle (V+LV, n=10; V+LC, n=4), 1 hour after injury. Kidneys harvested on day 3. (A) LC depletes renal macrophages after IR-AKI. Surface area of F4/80 macrophages. (B) Tubular injury marker, Kim1 mRNA. qRT-PCR for Kim1/Gapdh control mRNAs. (C) Acute tubular injury scores at day 3. t Test was used to compare IR-AKI with LV and LC data: *P<0.05. (D–F) Kim 1 localization. (D) Representative image showing Kim1 expression. (E,F) Quantification of Kim1 in the OM and cortex. (G and H) BMS493 increases M1 and decreases M2 macrophage marker expression at day 3. qRT-PCR for M1 (G) and M2 marker (H) relative to Gapdh control mRNA in renal macrophages from uninjured (n=1 for IL-1β, TNF-α and MgL1, n=3 for iNOS, Arg1 and MR mRNAs) and vehicle- (n=7–8) and BMS493-treated (n=8) kidneys 3 days after injury. All results are expressed as mean±SEM. (B, G and H) Fold change relative to controls. For analysis of I–K, IL-1β, TNF-α and MgL1 mRNAs we used a t test to compare vehicle versus BMS493: *P<0.05; ***P<0.001; #P<0.001. One-way ANOVA was used for all other studies and results only indicated if ANOVA P≤0.05: *P<0.05; **P<0.01; ***P<0.001; #P<0.001 versus uninjured control mice (no brackets), or vehicle versus BMS493 mice (brackets). (I–K) FACS analysis of CD45+/CD11b+ renal macrophages isolated 3 days after injury from vehicle- or BMS493-treated mice, n=3/group. (I and J) Ly6C and MHC-II antigen expression. Percent Ly6C/MHC-II high indicated. (K) Intracellular Arg1 expression. percent Arg1-FITC high indicated (>104 FU). t Test comparing vehicle versus BMS493 treatment groups (I versus J, and K): *P<0.05. LV, liposome vehicle.
All-Trans-Retinoic Acid Ameliorates Injury and Reduces Inflammatory M1 Macrophage Marker Expression after IR-AKI
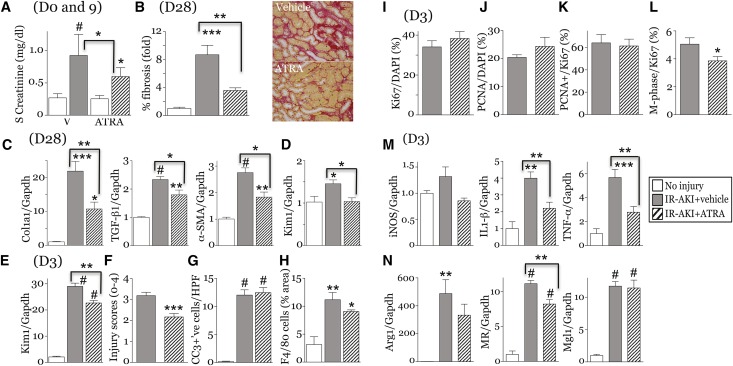
To activate RA signaling, we treated mice with all-trans-retinoic acid (ATRA).46 At low doses, ATRA reduces postinjury fibrosis, but at high doses may exacerbate fibrosis.47 In uninjured mice, 10 mg/kg ATRA upregulated RAR target genes in the kidney, but 1 mg/kg ATRA did not increase the expression of the RAR target genes Rarb, Cy26B1, or Stra6 mRNAs34,41 (Supplemental Figure 11A). However, 1 mg/kg ATRA increased injury-induced expression of Rarb and Stra6 mRNAs 3 days after IR-AKI (Supplemental Figure 11B). ATRA 1 mg/kg had no effect on RARE-LacZ reporter activation in uninjured kidneys or 24 hours after IR-AKI (Supplemental Figure 12). This indicates that low-dose ATRA does not activate RA signaling in the absence of injury, and does not increase the numbers of cells with activated RA signaling after injury. At 1 mg/kg per day, ATRA reduced serum creatinine (Figure 8A). By day 28, there was reduced interstitial fibrosis, expression of fibrosis markers and Kim1 mRNA in the kidneys of ATRA-treated mice (Figure 8, B–D). Kim1 and tubular injury scores were reduced 3 days post-AKI (Figure 8, E and F). ATRA had no effect on apoptosis or renal macrophage numbers (Figure 8, G and H). There were no changes in tubular proliferation (Figure 8, I–K), but M-phase arrest was reduced with ATRA (Figure 8L). ATRA reduced the expression of IL1β and TNFα mRNAs (Figure 8M), but had minimal effect on renal M2 spectrum marker expression 3 days post-AKI (Figure 8N). This suggests that while ATRA represses M1 spectrum macrophages, M2 macrophages are not activated after treatment with ATRA.
Figure 8.
ATRA attenuates injury and fibrosis after IR-AKI. Unilateral IR-AKI performed on male BALB/c mice with contralateral nephrectomy at day 8. Daily treatment with vehicle or ATRA started 24 hpi for 7 days. Kidneys harvested at days 3 and 28. Uninjured controls (n=3–4), vehicle- (n=7–9) and ATRA-treated (n=7–8) at day 3, and vehicle- (n=6–7) and ATRA-treated (n=7) kidneys day 28. (A) Serum creatinine 0 and 9 days post-AKI. (B and C) Renal fibrosis at day 28. (B) Percent fibrosis in the OM. Images showing SR staining. (C) Expression of fibrosis markers. qRT-PCR for Col1a1, TGF-β1 and α-smooth muscle actin (α-SMA) relative to Gapdh mRNA at day 28. (D) Tubular injury marker, Kim1 mRNA 28 days post-AKI. qRT-PCR for Kim1/Gapdh control mRNAs. (E–G) Early tubular injury after IR-AKI. (E) Kim1 mRNA at day 3. (F) Tubular injury scores (OM) at day 3. (G) Tubular apoptosis. Cleaved caspase-3–positive cells/HPF at day 3. (H) Renal macrophages. Surface area of F4/80 macrophages. (I–L) Tubular proliferation at day 3 (OM). t Test, *P<0.05. (M,N) ATRA decreases M1 macrophage marker expression at day 3. qRT-PCR for (M) M1 and (N) M2 markers relative to Gapdh control mRNAs. Results expressed as mean±SEM. qRT-PCR and fibrosis data (B) expressed as fold change relative to controls. Unless otherwise indicated, one-way ANOVA performed. Results only indicated if ANOVA P<0.05: *P<0.05; **P<0.01; ***P<0.001; #P<0.001. Comparison with uninjured controls (no brackets), or vehicle- and ATRA-treated mice (brackets). hpi, hours after injury.
Inhibition of RA Signaling in PTECs Inhibits Expression of M2 Spectrum Renal Macrophage Markers after AKI
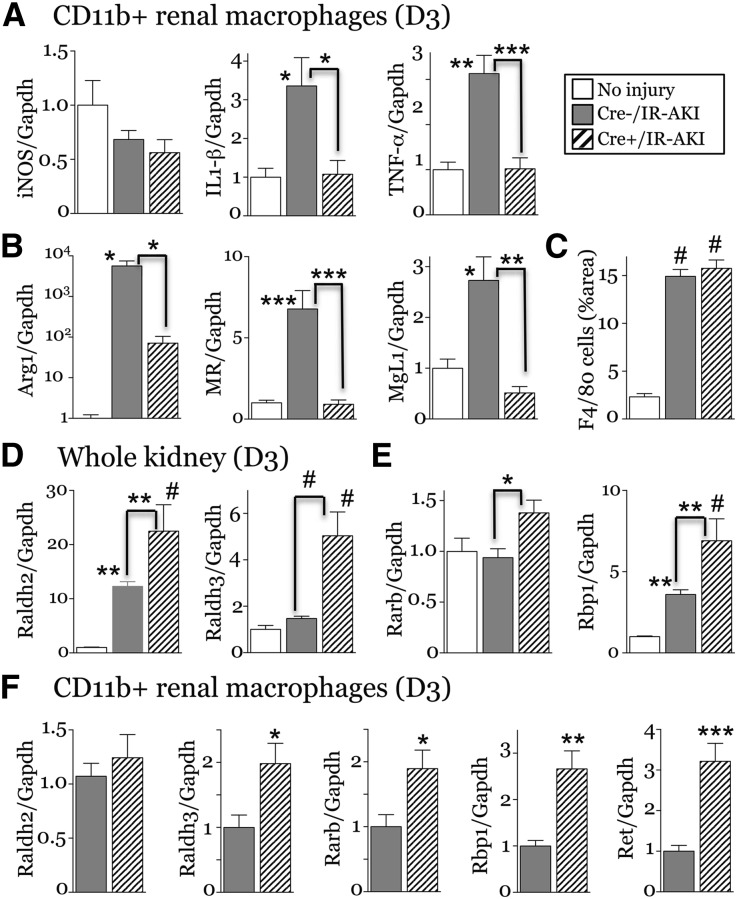
To determine whether RA signaling in PTECs mediates RA-dependent modification of M2 spectrum macrophages, we crossed Rosa26-LSL-RaraT403×(R26R-DNRAR) mice, which express a Cre-activated, dominant negative RAR,1,48 with PEPCK-Cre mice,49 to generate PTEC-DNRAR mice. PEPCK-Cre induces efficient recombination in cortical and medullary PTECs (Supplemental Figure 13).49 We used mice homozygous for R26R-DNRAR for efficient RAR inhibition, as described.1 PTEC-DNRAR mice have normal kidneys (Supplemental Figure 14), but increased renal Kim1 mRNA as well as Kim1 staining in the cortex compared with Cre– controls 3 days post-AKI (Supplemental Figure 15, A–C). There was no change in proliferation, but there were increased tubular cells arrested in M phase in PTEC-DNRAR mice post-AKI (Supplemental Figure 15D). Unlike BMS493-treated mice, there was reduced expression of M1 spectrum marker mRNAs for IL1β and TNFα but no change iNOS mRNA expression in Rhoεναλ μαχ Rhoοπηαγεσ from R26R-DNRAR mice post-AKI (Figure 9A). As iNOS is repressed in renal macrophages 3 days after injury (Figure 7G, 9A), it may not be a good marker of inflammatory macrophages in this model. There was increased expression of Raldh2 and -3 and the RAR target genes Rarb and Rbp1 in PTEC-DNRAR kidneys post-AKI (Figure 9, D and E), and Raldh3, Rarb, Rbp1, and the developmentally regulated RA target Ret mRNAs41 were also increased in renal macrophages from PTEC-DNRAR mice 3 days post-AKI (Figure 9F). This suggests there may be a compensatory increase in RA synthesis in PTEC-DNRAR kidneys associated with increased RA signaling in renal macrophages. Because RA treatment suppresses inflammatory macrophages, this compensatory increase in RA synthesis may account for the suppression of inflammatory macrophages in PTEC-DNRAR mice post-AKI. However, in addition to effects on inflammatory macrophages, there was also a marked reduction in the expression of M2 spectrum markers Arg1, MR, and Mgl1 mRNAs 3 days post-AKI (Figure 9B). This was not associated with reduced macrophage numbers (Figure 9C). These data indicate that activation of RA signaling in PTECs promotes alternative activation of macrophages after AKI.
Figure 9.
Genetic inhibition of RA signaling in PTECs inhibits M2 macrophage switching after IR-AKI. Male PEPCK-Cre/+;R26R-RaraDN+/+ (Cre+ PTEC DN RAR) and PEPCK-Cre/–; R26R-RaraDN+/+ (Cre– PTEC DN RAR) mice underwent left renal pedicle clamping and kidneys harvested 3 days after injury. Studies were performed in Cre– (n=8–10) and Cre+ (n=4–5) mice post-AKI, and uninjured controls (itemized below). (A, B) M1 and M2 markers in renal macrophages. qRT-PCR for (A) M1 and (B) M2 macrophage markers relative to Gapdh mRNA control was performed on renal macrophages isolated using CD11b antibody–coated magnetic beads. We saw no differences between uninjured Cre– and Cre+ controls, so both control groups were combined for these studies (n=2+3). (C) Renal macrophage numbers, surface area of F4/80-stained macrophages day 3 after injury. Cre– uninjured controls (n=3). (D, E) PTEC-DN-RAR mice have increased expression of RA-synthesizing enzymes and RA-responsive genes after IR-AKI. qRT-PCR for (D) the RA-synthesizing enzymes Raldh2 and Raldh3, and (E) RA target genes Rarb and Rbp1 performed on kidneys 3 dpi. Cre– uninjured controls (n=5). One-way ANOVA with Tukey’s correction for multiple between-group comparisons. Results only indicated if one-way ANOVA P<0.05: *P<0.05; **P<0.01; #P<0.001. Comparison with uninjured controls (no brackets), or between Cre+ uninjured, Cre– and Cre+ injured mice (indicated by brackets). (F) Expression of RA-synthesizing enzymes and RA-responsive genes in renal macrophages from PTEC-DN-RAR mice after IR-AKI (n=6/group). t Test: *P<0.05; **P<0.01. All results expressed as mean±SEM, (A, B, D, and E) fold change versus uninjured controls, (F) fold change relative to Cre– injured mouse kidneys.
Discussion
RA signaling is activated and regulates macrophage-dependent injury and repair in the kidney after AKI. In zebrafish larvae, RA signaling is activated in PTECs within hours of injury. This response may limit injury and promotes proliferative repair of PTECs. Loss and gain of function studies indicate that reactivation of RA signaling does not promote proliferative repair of damaged tubular epithelium in the mouse kidney, but reduces the severity of tubular injury and postinjury fibrosis after AKI. These findings indicate that reactivation of RA signaling is a conserved response to renal injury that limits injury and improves repair in both organisms. However, the lack of a growth inhibitory response to blocking RA signaling in mice suggests that mouse kidneys may have a reduced regenerative response to RA compared with zebrafish larvae.
Inhibition of RA signaling with BMS493 increases late, postinjury fibrosis, but has only limited effects on tubular injury and no effect on renal function after IR-AKI. This contrasts with ATRA, which not only reduces postinjury fibrosis, but also accelerates recovery and inhibits tubular injury after IR-AKI. This suggests either that exogenous RA is acting through a distinct mechanism to the intrinsically activated RA signaling pathway in the post-AKI kidney, or that the pharmacological doses of ATRA that we used have more profound effects in suppressing tubular injury than activation of the intrinsic RA signaling pathway.
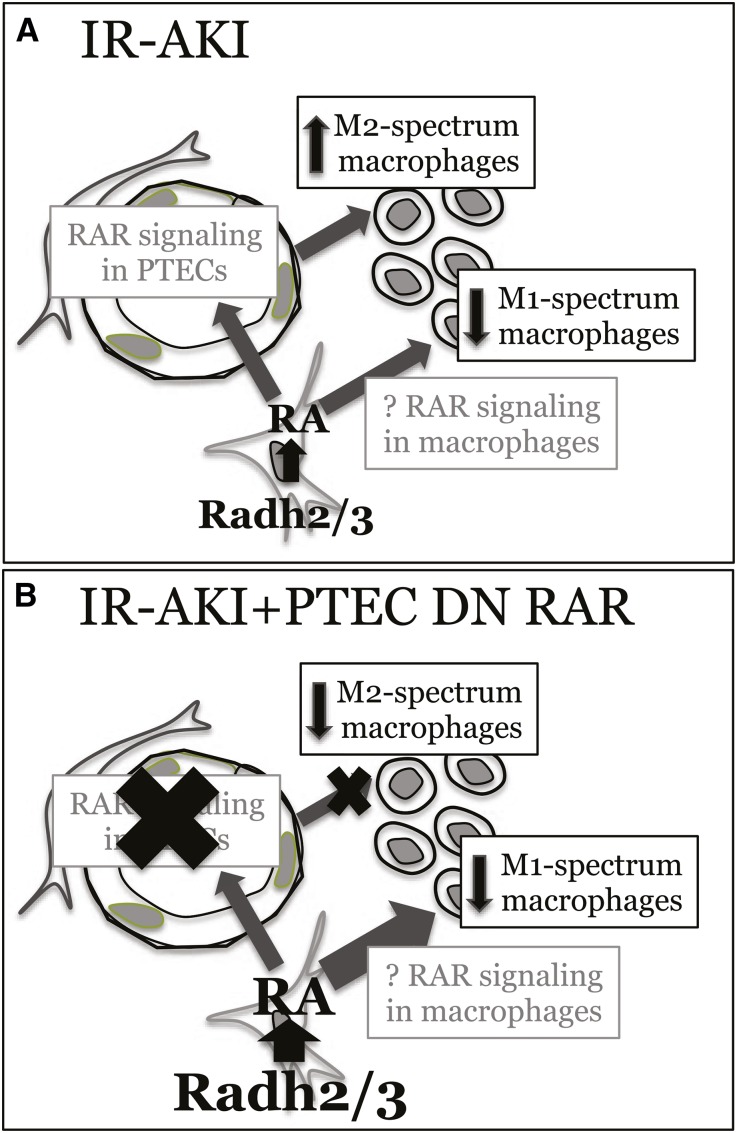
Macrophage depletion studies show that renal macrophages are required to mediate RA-dependent effects on renal injury. LC efficiently depletes inflammatory macrophages while alternatively activated macrophages tend to be preserved.50 On this basis, our data support the hypothesis that BMS493 increases inflammatory macrophage-dependent injury after IR-AKI. Our studies suggest a model in which RA synthesis represses inflammatory macrophages, while activation of RA signaling in PTECs increases alternatively activated macrophages post-AKI (Figure 10A). The kinetics of RA signaling is consistent with the transition of macrophage phenotypes after IR-AKI.16,51 Our model is also consistent with data indicating that ATRA represses inflammatory cytokine production by cultured macrophages,52–55 and PTECs secrete factors that induce expression of alternatively activated markers in cultured macrophages.15–17 Our data indicate that RA signaling provides another layer of temporally and spatially controlled signaling that regulates dynamic changes macrophage phenotypes after AKI.
Figure 10.
Proposed model by which (A) RA signaling regulates renal macrophage phenotypes after IR-AKI, and (B) how manipulation of RA signaling in PTEC-DNRAR mice regulates the balance of M1 and M2 spectrum macrophages in these studies.
Inhibition of RA signaling in PTECs inhibits expression of M2 spectrum macrophage markers post-AKI, indicating that there is an RA- and PTEC-dependent mechanism regulating activation of macrophages. However, there was also reduced expression of inflammatory macrophage markers in PTEC-DNRAR mice. This may result from a compensatory increase in RA synthesis that in turn suppresses M1 spectrum macrophages in PTEC-DNRAR mice. Depletion of RARα variants in zebrafish embryos also initiates a compensatory increase in RA synthesis,56 suggesting that inhibiting RAR signaling activates a similar positive feedback mechanism. On this basis, we propose that inhibition of PTEC RA signaling decreases M2 spectrum macrophage markers, but at the same time a compensatory increase in local RA synthesis acts through a different mechanism to repress inflammatory renal macrophages after IR-AKI. Because in vitro studies indicate that RA has direct suppressive effects on inflammatory macrophages,52–55 it is likely this is a direct effect of RA on renal macrophages (Figure 10B).
The origin of RA synthesis in the kidney post-AKI remains uncertain. Infiltrating macrophages express Raldh3 and have high levels of ALDH activity at early time points after injury. These cells closely associate with cells with RA-signaling activity. However, Raldh2 is also expressed by macrophages, so it is possible that RA synthesis by infiltrating macrophages is replaced by mature macrophages expressing Raldh2 at later time points. Alternatively, persistent RARE-LacZ activity at later time points may be an artifact resulting from stabilized expression of β-Gal protein induced by the early activation of the RARE, so it is possible that RA signaling is only activated early, and that Raldh2 does not play a role in activating RA-signaling after AKI. Furthermore, Raldh1 mRNA increases in the kidney post-AKI, so other Raldh family members may contribute to RA synthesis. Definitive evidence as to which cells and Raldhs are synthesizing RA will require the analysis of cell-specific Raldh1–3 loss of function on RARE activity.
In summary, our results show that RA signaling is activated in mouse and zebrafish kidneys after AKI, and this response limits the extent of injury in both models. These effects are mediated through a previously unrecognized mechanism by which RA coordinates the equilibrium of macrophage activation after AKI. According to this model, the repression of inflammatory macrophages by locally synthesized RA reduces macrophage-dependent injury, while locally synthesized RA activates RA signaling in PTECs, which in turn promotes alternative activation of macrophages, enhancing post-AKI repair.
Concise Methods
Zebrafish Studies
Zebrafish Husbandry
In addition to Pitt AB wild-type, embryos were used from the following published transgenic lines: Tg(12XRARE-ef1a: EGFP)s72,28 and Tg(PT:EGFP).22 In addition, the Tg(cdh17:mCherry) line was used, which was generated in conjunction with and displays pronephric mCherry expression analogous to Tg(cdh17:EGFP).26
Gentamicin-Induced AKI
Zebrafish larvae were injected with a single dose of gentamicin at 2.5–3 dpf, as previously described.22,23 Briefly, larvae were anesthetized in tricaine/E3 medium and injected with 1 nl (8 ng) gentamicin diluted in saline, delivered into the common cardinal vein. After injection, larvae were incubated in 50 µg/ml penicillin/streptomycin diluted in E3 medium. For RA inhibition studies, zebrafish larvae were treated with 1 µM Ro41–5253 (Enzo Life Sciences) in 1% DMSO diluted in E3 for 24 hours from 3 to 4 dpf, and then the compound was washed out with several changes of E3. For survival assays, individual larvae were placed in wells of a 48-well plate after gentamicin microinjection and covered with E3 medium±Ro41–5253. Larvae viability was scored once per day on days 1–5 postinjection. All studies were approved by the University of Pittsburgh Institutional Animal Care and Use Committee.
Histologic Analyses
For in situ hybridization studies, zebrafish larvae were fixed in 4% paraformaldehyde for 24 hours and processed for whole-mount in situ hybridization as described previously, using an antisense RNA probe for egfp.57 After staining, larvae were examined and scored based on renal expression. Images are shown from one representative experiment. Immunofluorescence was performed on cryosections of zebrafish larvae as described previously.22 Briefly, larvae were fixed in 4% paraformaldehyde and treated with a sucrose gradient before embedding in tissue-freezing medium. Transverse sections were generated at a thickness of 14 µm. Slides were blocked with 10% goat serum in PBS-Tween, followed by primary and secondary antibody incubations. Primary and secondary antibodies, dilutions, biotin amplification, and respective antigen retrieval methods are summarized in Supplemental Tables 2 and 3. To quantify PTEC proliferation, we counted PCNA-positive cells per proximal tubule (marked by PT:GFP).
RNA Isolation and Quantitative RT-PCR
Samples for RNA isolation were generated by cutting zebrafish larvae at the hindbrain to isolate trunk tissue. Larvae (10–15) were pooled and homogenized per sample. RNA was isolated using the RNeasy Micro kit (Qiagen, Boston, MA), and cDNA was generated using the SuperScript First Strand kit (Life Technologies, Grand Island, NY). qRT-PCR was performed as described previously.57 Exon-spanning primers were designed using Beacon Designer version 8.13 to detect kim1 and gfp mRNAs. Expression was normalized to β-actin and sdha mRNAs, as described.57 Primer sequences are listed in Supplemental Table 5. qRT-PCR was repeated using cDNA samples from three to seven different experiments. The data shown in the graphs are from one representative experiment with three technical replicates.
Live Confocal Zebrafish Imaging
Immediately after gentamicin injection, zebrafish larvae were anesthetized in 160 µg/ml tricaine (Sigma-Aldrich, St. Louis, MO) and embedded in a thin layer of 0.5% low-melt Sea Plaque agarose (Cambrex, East Rutherford, NJ), and covered with 0.003% 1-phenyl-2-thiourea in E3 medium to prevent pigment development. Image stacks were acquired using a Leica TCS SP5 multiphoton microscope (Leica Microsystems, Wetzlar, Germany) with an HCX IRAPO L 25×/0.95 water immersion objective, non-descanned detectors and a custom-built motorized stage (Scientifica, East Sussex, UK). Sequential stack scanning was performed bidirectionally with a resonant scanner (16,000 Hz, phase set to 1.69) with 32× line averaging and a zoom of 1.7×GFP and mCherry were excited with a Mai Tai DeepSee Ti:Sapphire laser (Newport/Spectra Physics, Santa Clara, CA) at 900 and 800 nm, respectively. Using the “Mark and Find” function, (x, y) coordinates and z-series parameters (step size 1.48 µm) were defined for individual embryos. Images were captured every 90 minutes for 21 hours. Maximal projections were compiled in series to generate time-lapse movies using LAS AF Version: 3.0.0 build 8134 and Metamorph software.
Analysis of GFP Fluorescence Intensity
Enhanced green fluorescence protein (EGFP) fluorescence intensity activated by RA signaling in Tg(12XRARE:EGFP); Tg(cdh17:mCherry) larvae during live imaging experiments was quantified using the Intensity function in LAS AF Version 3.0.0 build 8134. First, a region of interest in the proximal tubule was created using mCherry expression as a guide (3350±160 µm2, mean±SEM). The average EGFP intensity was then calculated in this region across an entire image stack in each nephron per larvae (n=10 uninjured and 6 gent-AKI nephrons).
Mouse Studies
Mouse Strains and Genotyping
Wild-type BALB/c mice were purchased from Charles River Laboratories; RARE-hsp68-lacZ mice (CD-1)30 and Rosa26-Stop-eYFP (R26R-eYFP, C57Bl/6)58 mice were purchased from The Jackson Laboratories. PEPCK-Cre mice (129svj/C57Bl/6) were kindly provided by Volker Haase,49 and Rosa26-LSL-RaraT403× (R26R-DN RAR, 129svj/C57Bl/6) by Cathy Mendelsohn.1 Genotyping was performed by PCR on the ear-punch biopsies using both published and unpublished allele-specific primers (Supplemental Table 4).
IR-AKI
Surgeries were performed in male mice on a water bath-heated platform (Gaymar, Forest Hills, NY) at 38°C. We used 10–12-week wild-type BALB/c mice, 8–10-week PEPCK-CreY/+; RARaDNfl/fl and PEPCK-CreY/+; R26R-eYFP+/+ mice (mixed background), 16–20-week RARE-hsp68-lacZ mice (CD-1). Mice underwent left renal pedicle clamping (800 g pressure clamp; Roboz RS-5459) for 26 minutes for RARE-hsp68-lacZ mice (CD-1), 30 minutes for all other mouse strains, and tissue reperfusion confirmed before completing the surgery. Contralateral nephrectomy was performed at the same time, or 8 days after renal pedicle clamping for long-term studies, as previously described.59 Serum creatinine was evaluated using an enzymatic cascade assay (requires only approximately 7 µl of serum; Pointe Scientific, Canton MI). Depending on the experiment, mice were treated with daily intraperitoneal injection of 1.0 mg/kg ATRA (Sigma-Aldrich) or 10% DMSO/90% corn oil vehicle control starting 24 hours after injury, or 20 mg/kg BMS493 (R&D Systems) or 10% DMSO/90% corn oil vehicle starting 1 hour after renal pedicle clamping. For macrophage depletion studies, mice were treated with 40 mg/kg and 20 mg/kg of intraperitoneal LC, or liposome vehicle alone (Encapsula Nanosciences, Brentwood, TN) 3 days and 1 day before injury, respectively, as described.16 BMS493 (20 mg/kg) or vehicle was then administered 1 hour after clamping and the kidneys harvested after 3 days. Experimental protocols were approved by Vanderbilt Institutional Animal Care and Use Committee.
Histologic Analyses
Kidneys were harvested, 2-3 mm blocks cut transversely through the cortex and medulla, and fixed in 0.2% glutaraldehyde and frozen in optimal cutting temperature (OCT) for X-Gal staining, or in 10% formalin and either frozen in OCT for X-Gal and antibody co-labeling, or mounted in paraffin for all other studies, as described.22,60 Renal tubular injury scores and fibrosis/collagen deposition were determined from periodic acid–Schiff- and SR-stained sections, respectively, by blinded observers. Acute and chronic tubular injury scores were evaluated directly (P.P. evaluated ATRA treatment studies, and H.Y. evaluated all other studies). To quantify SR staining, we used an Olympus BX-41 microscope equipped with a polarized light filter, using ImageJ to quantify birefringent SR-stained collagen fibrils surface areas/total surface areas from digitally captured polarized light images, as described.22,61 β-Gal staining was performed on 0.2% glutaraldehyde (for hematoxylin and eosin counterstain), or formalin (for antibody co-labeling) fixed frozen sections, as described.60,62 For co-labeling studies, after incubation with X-Gal substrate, sections were fixed in methanol, before antigen retrieval, blocking steps and incubation with primary and secondary antibodies, and/or biotinylated lectins, as outlined below. Immunohistochemical studies were performed on formalin-fixed frozen or paraffin-embedded tissue sections as described previously.60,62 Blocking and antibody incubation steps were performed using the universal blocking reagent (Biogenex, Tremont, CA), and autofluorescence reduced by incubating sections in 100 mM glycine after the antigen retrieval step. Lectins, primary and secondary antibodies, dilutions, biotin amplification, and respective antigen retrieval methods are summarized in Supplemental Tables 3 and 4. Color overlays were generated using Adobe Photoshop. For β-Gal/immunofluorescence staining overlays, the blue X-Gal color change acquired using the light microscope was pseudocolored in white and overlaid onto simultaneously digitally acquired fluorescence images using ImageJ. For quantification, five to six 400× high power field (HPF) images were captured in the outer cortex (cortex) or OM, and quantified by a blinded observer (T.C., or N.S.). Tubular structures were identified from green channel autofluorescence signal. Results were expressed as cells/HPF, or as the ratio of stained cells, as indicated in the figure legends. ImageJ was used to define and quantify the average percent F4/80-positive surface areas based on data from five to six digitally captured HPF images.
RNA Isolation and Quantitative RT-PCR
RNA was isolated from snap-frozen whole kidneys and cDNA synthesis performed, as described previously.22 For renal macrophages, after perfusing the kidney with PBS to remove blood, kidneys were macerated and dispersed into a single-cell suspension after digestions with 2 mg/ml collagenase D and 100 µg/ml DNAse 1 at 37°C for 1 hour, as described.16 Macrophages were then isolated in bulk using anti-CD11b antibody–conjugated magnetic microbeads (CD11b-MACS; Miltenyi Biotec, San Diego, CA), and RNA extracted with RNA-Bee reagent (TEL-TEST, Inc., Friendswood, TX). RNA quantification and integrity was determined using a NanoDrop 2000c instrument (Thermo Fisher Scientific, Waltham, MA). cDNA was amplified and labeled using SYBR Green Supermix PCR (Bio-Rad, Hercules, CA). Gene expression is expressed as relative gene expression calculated using the 2^-ddCT method, as described.64 Gapdh mRNA was used as a loading control, because we see no changes in Gapdh mRNA expression in the kidney after injury in the IR-AKI model.22 Primer sequences along with their PrimerBank identification numbers,64–66 or previous literature citations, are listed in Supplemental Table 5.
Flow Cytometry
After perfusion of the kidneys with normal saline, the injured kidney was removed, minced into 1–2-mm fragments using fine surgical scissors, and digested in PBS containing 480 units/ml collagenase type I (Life Technologies) and 30 units/ml Dispase (BD Biosciences) for 35 min at 37°C, with intermittent agitation. After adding FBS at a 20% final concentration to neutralize collagenase and Dispase, kidney fragments were filtered through a 40-µm mesh (BD Biosciences, San Jose, CA). Cells were centrifuged (800×g, 4 minutes, 8°C) and washed once in FACS Buffer (1% FBS, 1 mM EDTA in PBS) and resuspended in FACS buffer. Cell counts were performed and 106 cells used for each assay. Cells were incubated for 25 minutes on ice with antibodies, then washed once and resuspended in FACS buffer. Fluorescent conjugated antibodies and the dilutions used in the FACS analyses are listed in Supplemental Table 6. Only viable cells were analyzed by gating only 7-AAD–negative cells. To analyze Raldh enzymatic activity by FACS, we used the ALDEFLUOR Assay kit (STEMCELL Technologies, Vancouver, BC, Canada) and followed the manufacturer’s protocol. To analyze Arginase-1 expression by FACS, after dispersing the kidney the cell pellet was treated with RBC Lysis/Fixation Solution (Biolegend, San Diego, CA), an alcohol-based cell permeabilization and fixation solution, according to the manufacturer’s protocol. After staining, cells were analyzed using a FACS Canto II cytometer (Becton Dickinson, Franklin Lakes, NJ), and offline list mode data analysis using Winlist from Verity Software House.
Statistical Analyses
Statistical analyses performed included by Student’s two-tailed t test for paired group comparisons, one-way ANOVA for multiple between-group comparisons using Tukey correction for post-hoc, pair-wise between group comparisons, and two-way ANOVA for comparisons between treatment groups over time, using Sidak’s or Bonferroni’s correction for multiple between-group comparisons at the same time. The minimal level of significance was set at P≤0.05 and statistical analyses performed using GraphPad Prism.
Disclosure
Mark de Caestecker is a consultant and recipient of a research grant from Nephrogenix. This work was not supported by and is unrelated to the work supported by the Nephrogenix grant.
Supplementary Material
Acknowledgments
We are grateful for help from Suwan Wang, Bing Yao, Xiaofeng Fan, and Aolei Niu for assistance performing macrophage isolation studies; for Peter McCaffery’s advice about Raldh2 antibodies; and for Sara Monts’ assistance with Ro41-5253 studies.
Volker Haase kindly provided PEPCK-Cre mice, Cathy Mendelsohn provided Rosa26-LSL-RaraT403X (R26R-DN RAR) mice, and Josh Waxman provided the Tg(12XRARE:GFP) zebrafish line.
The laboratory of Mark de Caestecker was supported by National Institutes of Health (NIH) Grants 1R01-HL093057, 1RC-4DK090770, and P30-DK079307. The laboratory of Neil Hukriede was supported by the NIH Grants 2R01-DK069403, 1RC4-DK090770, and 1P30-DK079307, and Eunice Kennedy Shriver National Institute of Child Health and Human Development Grant 2R01-HD053287. The laboratory of Raymond Harris was supported by funds from the Department of Veterans Affairs and NIH Grant DK38226, DK51265, DK62794, and DK95785.
Findings from these studies were published as oral and poster abstracts at the 2014 ASN annual scientific meeting.
Footnotes
Published online ahead of print. Publication date available at www.jasn.org.
This article contains supplemental material online at http://jasn.asnjournals.org/lookup/suppl/doi:10.1681/ASN.2014111108/-/DCSupplemental
References
- 1.Rosselot C, Spraggon L, Chia I, Batourina E, Riccio P, Lu B, Niederreither K, Dolle P, Duester G, Chambon P, Costantini F, Gilbert T, Molotkov A, Mendelsohn C: Non-cell-autonomous retinoid signaling is crucial for renal development. Development 137: 283–292, 2010 [DOI] [PMC free article] [PubMed] [Google Scholar]
- 2.Batourina E, Gim S, Bello N, Shy M, Clagett-Dame M, Srinivas S, Costantini F, Mendelsohn C: Vitamin A controls epithelial/mesenchymal interactions through Ret expression. Nat Genet 27: 74–78, 2001 [DOI] [PubMed] [Google Scholar]
- 3.Maden M: Retinoic acid and limb regeneration—a personal view. Int J Dev Biol 46: 883–886, 2002 [PubMed] [Google Scholar]
- 4.Maden M: The effect of vitamin A on the regenerating axolotl limb. J Embryol Exp Morphol 77: 273–295, 1983 [PubMed] [Google Scholar]
- 5.Kikuchi K, Holdway JE, Major RJ, Blum N, Dahn RD, Begemann G, Poss KD: Retinoic acid production by endocardium and epicardium is an injury response essential for zebrafish heart regeneration. Dev Cell 20: 397–404, 2011 [DOI] [PMC free article] [PubMed] [Google Scholar]
- 6.Blum N, Begemann G: Retinoic acid signaling controls the formation, proliferation and survival of the blastema during adult zebrafish fin regeneration. Development 139: 107–116, 2012 [DOI] [PubMed] [Google Scholar]
- 7.Perez A, Ramirez-Ramos M, Calleja C, Martin D, Namorado MC, Sierra G, Ramirez-Ramos ME, Paniagua R, Sánchez Y, Arreola L, Reyes JL: Beneficial effect of retinoic acid on the outcome of experimental acute renal failure. Nephrol Dial Transplant 19: 2464–2471, 2004 [DOI] [PubMed] [Google Scholar]
- 8.Balasubramanian S, Jansen M, Valerius MT, Humphreys BD, Strom TB: Orphan nuclear receptor Nur77 promotes acute kidney injury and renal epithelial apoptosis. J Am Soc Nephrol 23: 674–686, 2012 [DOI] [PMC free article] [PubMed] [Google Scholar]
- 9.Ratnam KK, Feng X, Chuang PY, Verma V, Lu TC, Wang J, Jin Y, Farias EF, Napoli JL, Chen N, Kaufman L, Takano T, D’Agati VD, Klotman PE, He JC: Role of the retinoic acid receptor-α in HIV-associated nephropathy. Kidney Int 79: 624–634, 2011 [DOI] [PMC free article] [PubMed] [Google Scholar]
- 10.Kishimoto K, Kinoshita K, Hino S, Yano T, Nagare Y, Shimazu H, Nozaki Y, Sugiyama M, Ikoma S, Funauchi M: Therapeutic effect of retinoic acid on unilateral ureteral obstruction model. Nephron, Exp Nephrol 118: e69–e78, 2011 [DOI] [PubMed] [Google Scholar]
- 11.Schaier M, Jocks T, Grone HJ, Ritz E, Wagner J: Retinoid agonist isotretinoin ameliorates obstructive renal injury. J Urol 170: 1398–1402, 2003 [DOI] [PubMed] [Google Scholar]
- 12.Wagner J, Dechow C, Morath C, Lehrke I, Amann K, Waldherr R, Floege J, Ritz E: Retinoic acid reduces glomerular injury in a rat model of glomerular damage. J Am Soc Nephrol 11: 1479–1487, 2000 [DOI] [PubMed] [Google Scholar]
- 13.Lehrke I, Schaier M, Schade K, Morath C, Waldherr R, Ritz E, Wagner J: Retinoid receptor-specific agonists alleviate experimental glomerulonephritis. Am J Physiol Renal Physiol 282: F741–F751, 2002 [DOI] [PubMed] [Google Scholar]
- 14.Duffield JS: Macrophages and immunologic inflammation of the kidney. Semin Nephrol 30: 234–254, 2010 [DOI] [PMC free article] [PubMed] [Google Scholar]
- 15.Huen SC, Huynh L, Marlier A, Lee Y, Moeckel GW, Cantley LG: GM-CSF Promotes Macrophage Alternative Activation after Renal Ischemia/Reperfusion Injury. J Am Soc Nephrol, 2014 [DOI] [PMC free article] [PubMed]
- 16.Zhang MZ, Yao B, Yang S, Jiang L, Wang S, Fan X, Yin H, Wong K, Miyazawa T, Chen J, Chang I, Singh A, Harris RC: CSF-1 signaling mediates recovery from acute kidney injury. J Clin Invest 122: 4519–4532, 2012 [DOI] [PMC free article] [PubMed] [Google Scholar]
- 17.Alikhan MA, Jones CV, Williams TM, Beckhouse AG, Fletcher AL, Kett MM, Sakkal S, Samuel CS, Ramsay RG, Deane JA, Wells CA, Little MH, Hume DA, Ricardo SD: Colony-stimulating factor-1 promotes kidney growth and repair via alteration of macrophage responses. Am J Pathol 179: 1243–1256, 2011 [DOI] [PMC free article] [PubMed] [Google Scholar]
- 18.Mantovani A, Biswas SK, Galdiero MR, Sica A, Locati M: Macrophage plasticity and polarization in tissue repair and remodelling. J Pathol 229: 176–185, 2013 [DOI] [PubMed] [Google Scholar]
- 19.Sica A, Mantovani A: Macrophage plasticity and polarization: in vivo veritas. J Clin Invest 122: 787–795, 2012 [DOI] [PMC free article] [PubMed] [Google Scholar]
- 20.Murray PJ, Allen JE, Biswas SK, Fisher EA, Gilroy DW, Goerdt S, Gordon S, Hamilton JA, Ivashkiv LB, Lawrence T, Locati M, Mantovani A, Martinez FO, Mege JL, Mosser DM, Natoli G, Saeij JP, Schultze JL, Shirey KA, Sica A, Suttles J, Udalova I, van Ginderachter JA, Vogel SN, Wynn TA: Macrophage activation and polarization: nomenclature and experimental guidelines. Immunity 41: 14–20, 2014 [DOI] [PMC free article] [PubMed] [Google Scholar]
- 21.Hentschel DM, Park KM, Cilenti L, Zervos AS, Drummond I, Bonventre JV: Acute renal failure in zebrafish: a novel system to study a complex disease. Am J Physiol Renal Physiol 288: F923–F929, 2005 [DOI] [PubMed] [Google Scholar]
- 22.Cianciolo Cosentino C, Skrypnyk NI, Brilli LL, Chiba T, Novitskaya T, Woods C, West J, Korotchenko VN, McDermott L, Day BW, Davidson AJ, Harris RC, de Caestecker MP, Hukriede NA: Histone deacetylase inhibitor enhances recovery after AKI. J Am Soc Nephrol 24: 943–953, 2013 [DOI] [PMC free article] [PubMed] [Google Scholar]
- 23.Cianciolo Cosentino C, Roman BL, Drummond IA, Hukriede NA: Intravenous microinjections of zebrafish larvae to study acute kidney injury. J Vis Exp (42): 2079, 2010 [DOI] [PMC free article] [PubMed] [Google Scholar]
- 24.Mandal A, Rydeen A, Anderson J, Sorrell MR, Zygmunt T, Torres-Vazquez J, Waxman JS: Transgenic retinoic acid sensor lines in zebrafish indicate regions of available embryonic retinoic acid. Devel Dyn, 2013 [DOI] [PMC free article] [PubMed]
- 25.Waxman JS, Yelon D: Zebrafish retinoic acid receptors function as context-dependent transcriptional activators. Dev Biol 352(1): 128–140, 2011 [DOI] [PMC free article] [PubMed] [Google Scholar]
- 26.Sanker S, Cirio MC, Vollmer LL, Goldberg ND, McDermott LA, Hukriede NA, Vogt A: Development of high-content assays for kidney progenitor cell expansion in transgenic zebrafish. J Biomol Screen 18: 1193–1202, 2013 [DOI] [PMC free article] [PubMed] [Google Scholar]
- 27.Ichimura T, Bonventre JV, Bailly V, Wei H, Hession CA, Cate RL, Sanicola M: Kidney injury molecule-1 (KIM-1), a putative epithelial cell adhesion molecule containing a novel immunoglobulin domain, is up-regulated in renal cells after injury. J Biol Chem 273: 4135–4142, 1998 [DOI] [PubMed] [Google Scholar]
- 28.Bohnsack BL, Kasprick DS, Kish PE, Goldman D, Kahana A: A zebrafish model of axenfeld-rieger syndrome reveals that pitx2 regulation by retinoic acid is essential for ocular and craniofacial development. Invest Ophthalmol Vis Sci 53: 7–22, 2012 [DOI] [PMC free article] [PubMed] [Google Scholar]
- 29.Lengerke C, Wingert R, Beeretz M, Grauer M, Schmidt AG, Konantz M, Daley GQ, Davidson AJ: Interactions between Cdx genes and retinoic acid modulate early cardiogenesis. Dev Biol 354: 134–142, 2011 [DOI] [PMC free article] [PubMed] [Google Scholar]
- 30.Rossant J, Zirngibl R, Cado D, Shago M, Giguère V: Expression of a retinoic acid response element-hsplacZ transgene defines specific domains of transcriptional activity during mouse embryogenesis. Genes Dev 5: 1333–1344, 1991 [DOI] [PubMed] [Google Scholar]
- 31.Wong YF, Kopp JB, Roberts C, Scambler PJ, Abe Y, Rankin AC, Dutt N, Hendry BM, Xu Q: Endogenous retinoic acid activity in principal cells and intercalated cells of mouse collecting duct system. PLoS ONE 6: e16770, 2011 [DOI] [PMC free article] [PubMed] [Google Scholar]
- 32.Kumar S, Sandell LL, Trainor PA, Koentgen F, Duester G: Alcohol and aldehyde dehydrogenases: retinoid metabolic effects in mouse knockout models. Biochim Biophys Acta 1821: 198–205, 2012 [DOI] [PMC free article] [PubMed] [Google Scholar]
- 33.Marchitti SA, Brocker C, Stagos D, Vasiliou V: Non-P450 aldehyde oxidizing enzymes: the aldehyde dehydrogenase superfamily. Expert Opin Drug Metab Toxicol 4: 697–720, 2008 [DOI] [PMC free article] [PubMed] [Google Scholar]
- 34.Ross AC, Zolfaghari R: Cytochrome P450s in the regulation of cellular retinoic acid metabolism. Annu Rev Nutr 31: 65–87, 2011 [DOI] [PMC free article] [PubMed] [Google Scholar]
- 35.van Leeuwen M, Gijbels MJ, Duijvestijn A, Smook M, van de Gaar MJ, Heeringa P, de Winther MP, Tervaert JW: Accumulation of myeloperoxidase-positive neutrophils in atherosclerotic lesions in LDLR-/- mice. Arterioscler Thromb Vasc Biol 28: 84–89, 2008 [DOI] [PubMed] [Google Scholar]
- 36.Greve B, Kelsch R, Spaniol K, Eich HT, Gotte M: Flow cytometry in cancer stem cell analysis and separation. Cytometry Part A, 81: 284–293, 2012 [DOI] [PubMed] [Google Scholar]
- 37.Li L, Huang L, Sung SS, Vergis AL, Rosin DL, Rose CE, Jr, Lobo PI, Okusa MD: The chemokine receptors CCR2 and CX3CR1 mediate monocyte/macrophage trafficking in kidney ischemia-reperfusion injury. Kidney Int 74: 1526–1537, 2008 [DOI] [PMC free article] [PubMed] [Google Scholar]
- 38.Li L, Okusa MD: Macrophages, dendritic cells, and kidney ischemia-reperfusion injury. Semin Nephrol 30: 268–277, 2010 [DOI] [PMC free article] [PubMed] [Google Scholar]
- 39.Germain P, Gaudon C, Pogenberg V, Sanglier S, Van Dorsselaer A, Royer CA, Lazar MA, Bourguet W, Gronemeyer H: Differential action on coregulator interaction defines inverse retinoid agonists and neutral antagonists. Chem Biol 16: 479–489, 2009 [DOI] [PubMed] [Google Scholar]
- 40.Bourguet W, de Lera AR, Gronemeyer H: Inverse agonists and antagonists of retinoid receptors. Methods Enzymol 485: 161–195, 2010 [DOI] [PubMed] [Google Scholar]
- 41.Balmer JE, Blomhoff R: Gene expression regulation by retinoic acid. J Lipid Res 43: 1773–1808, 2002 [DOI] [PubMed] [Google Scholar]
- 42.Furuichi K, Gao JL, Murphy PM: Chemokine receptor CX3CR1 regulates renal interstitial fibrosis after ischemia-reperfusion injury. Am J Pathol 169: 372–387, 2006 [DOI] [PMC free article] [PubMed] [Google Scholar]
- 43.Yang, L, Besschetnova, TY, Brooks, CR, Shah, JV, Bonventre, JV: Epithelial cell cycle arrest in G2/M mediates kidney fibrosis after injury. Nature Med, 16: 535–543, 531p following 143, 2010 [DOI] [PMC free article] [PubMed]
- 44.van Rooijen N, Hendrikx E: Liposomes for specific depletion of macrophages from organs and tissues. Methods Mol Biol 605: 189–203, 2010 [DOI] [PubMed] [Google Scholar]
- 45.Rogers NM, Ferenbach DA, Isenberg JS, Thomson AW, Hughes J: Dendritic cells and macrophages in the kidney: a spectrum of good and evil. Nat Rev Nephrol 10: 625–643, 2014 [DOI] [PMC free article] [PubMed] [Google Scholar]
- 46.Theodosiou M, Laudet V, Schubert M: From carrot to clinic: an overview of the retinoic acid signaling pathway. Cell Mol Life Sci 67: 1423–1445, 2010 [DOI] [PMC free article] [PubMed] [Google Scholar]
- 47.Zhou TB, Drummen GP, Qin YH: The controversial role of retinoic Acid in fibrotic diseases: analysis of involved signaling pathways. Int J Mol Sci 14: 226–243, 2012 [DOI] [PMC free article] [PubMed] [Google Scholar]
- 48.Damm K, Heyman RA, Umesono K, Evans RM: Functional inhibition of retinoic acid response by dominant negative retinoic acid receptor mutants. Proc Natl Acad Sci U S A 90: 2989–2993, 1993 [DOI] [PMC free article] [PubMed] [Google Scholar]
- 49.Rankin EB, Tomaszewski JE, Haase VH: Renal cyst development in mice with conditional inactivation of the von Hippel-Lindau tumor suppressor. Cancer Res 66: 2576–2583, 2006 [DOI] [PMC free article] [PubMed] [Google Scholar]
- 50.Ferenbach DA, Sheldrake TA, Dhaliwal K, Kipari TM, Marson LP, Kluth DC, Hughes J: Macrophage/monocyte depletion by clodronate, but not diphtheria toxin, improves renal ischemia/reperfusion injury in mice. Kidney Int 82: 928–933, 2012 [DOI] [PubMed] [Google Scholar]
- 51.Lee S, Huen S, Nishio H, Nishio S, Lee HK, Choi BS, Ruhrberg C, Cantley LG: Distinct macrophage phenotypes contribute to kidney injury and repair. J Am Soc Nephrol 22: 317–326, 2011 [DOI] [PMC free article] [PubMed] [Google Scholar]
- 52.Aggarwal BB, Mehta K: Determination and regulation of nitric oxide production from macrophages by lipopolysaccharides, cytokines, and retinoids. Methods Enzymol 269: 166–171, 1996 [DOI] [PubMed] [Google Scholar]
- 53.Mehta K, McQueen T, Tucker S, Pandita R, Aggarwal BB: Inhibition by all-trans-retinoic acid of tumor necrosis factor and nitric oxide production by peritoneal macrophages. J Leukoc Biol 55: 336–342, 1994 [DOI] [PubMed] [Google Scholar]
- 54.Wang X, Allen C, Ballow M: Retinoic acid enhances the production of IL-10 while reducing the synthesis of IL-12 and TNF-alpha from LPS-stimulated monocytes/macrophages. J Clin Immunol 27: 193–200, 2007 [DOI] [PubMed] [Google Scholar]
- 55.Dzhagalov I, Chambon P, He YW: Regulation of CD8+ T lymphocyte effector function and macrophage inflammatory cytokine production by retinoic acid receptor gamma. J Immunol 178: 2113–2121, 2007 [DOI] [PubMed] [Google Scholar]
- 56.D’Aniello E, Rydeen AB, Anderson JL, Mandal A, Waxman JS: Depletion of retinoic acid receptors initiates a novel positive feedback mechanism that promotes teratogenic increases in retinoic acid. PLoS Genet 9: e1003689, 2013 [DOI] [PMC free article] [PubMed] [Google Scholar]
- 57.de Groh ED, Swanhart LM, Cosentino CC, Jackson RL, Dai W, Kitchens CA, Day BW, Smithgall TE, Hukriede NA: Inhibition of histone deacetylase expands the renal progenitor cell population. J Am Soc Nephrol 21: 794–802, 2010 [DOI] [PMC free article] [PubMed] [Google Scholar]
- 58.Srinivas S, Watanabe T, Lin CS, William CM, Tanabe Y, Jessell TM, Costantini F: Cre reporter strains produced by targeted insertion of EYFP and ECFP into the ROSA26 locus. BMC Dev Biol 1: 4, 2001 [DOI] [PMC free article] [PubMed] [Google Scholar]
- 59.Skrypnyk NI, Harris RC, de Caestecker MP: Ischemia-reperfusion model of acute kidney injury and post injury fibrosis in mice [Abstract]. J Vis Exp 78: 2013 [DOI] [PMC free article] [PubMed] [Google Scholar]
- 60.Boyle S, Shioda T, Perantoni AO, de Caestecker M: Cited1 and Cited2 are differentially expressed in the developing kidney but are not required for nephrogenesis. Devel Dynam, 236: 2321–2330, 2007 [DOI] [PubMed] [Google Scholar]
- 61.He W, Wang Y, Zhang MZ, You L, Davis LS, Fan H, Yang HC, Fogo AB, Zent R, Harris RC, Breyer MD, Hao CM: Sirt1 activation protects the mouse renal medulla from oxidative injury. J Clin Invest 120: 1056–1068, 2010 [DOI] [PMC free article] [PubMed] [Google Scholar]
- 62.Boyle S, Misfeldt A, Chandler KJ, Deal KK, Southard-Smith EM, Mortlock DP, Baldwin HS, de Caestecker M: Fate mapping using Cited1-CreERT2 mice demonstrates that the cap mesenchyme contains self-renewing progenitor cells and gives rise exclusively to nephronic epithelia. Dev Biol 313: 234–245, 2008 [DOI] [PMC free article] [PubMed] [Google Scholar]
- 63.Schmittgen TD, Livak KJ: Analyzing real-time PCR data by the comparative C(T) method. Nat Protoc 3: 1101–1108, 2008 [DOI] [PubMed] [Google Scholar]
- 64.Spandidos A, Wang X, Wang H, Dragnev S, Thurber T, Seed B: A comprehensive collection of experimentally validated primers for Polymerase Chain Reaction quantitation of murine transcript abundance. BMC Genomics 9: 633, 2008 [DOI] [PMC free article] [PubMed] [Google Scholar]
- 65.Spandidos A, Wang X, Wang H, Seed B: PrimerBank: a resource of human and mouse PCR primer pairs for gene expression detection and quantification. Nucleic Acids Res 38: D792–D799, 2010 [DOI] [PMC free article] [PubMed] [Google Scholar]
- 66.Wang X, Seed B: A PCR primer bank for quantitative gene expression analysis. Nucleic Acids Res 31: e154, 2003 [DOI] [PMC free article] [PubMed] [Google Scholar]
Associated Data
This section collects any data citations, data availability statements, or supplementary materials included in this article.


