

Abstract
The immunoregulatory cytokine macrophage migration inhibitory factor (MIF) is encoded in a functionally polymorphic locus that is linked to the susceptibility of autoimmune and infectious diseases. The MIF promoter contains a 4-nucleotide microsatellite polymorphism (–794 CATT) that repeats 5 to 8 times in the locus, with greater numbers of repeats associated with higher mRNA levels. Because there is no information about the transcriptional regulation of these common alleles, we used oligonucleotide affinity chromatography and liquid chromatography–mass spectrometry to identify nuclear proteins that interact with the –794 CATT5–8 site. An analysis of monocyte nuclear lysates revealed that the transcription factor ICBP90 (also known as UHRF1) is the major protein interacting with the MIF microsatellite. We found that ICBP90 is essential for MIF transcription from monocytes/macrophages, B and T lymphocytes, and synovial fibroblasts, and TLR-induced MIF transcription is regulated in an ICBP90- and –794 CATT5–8 length–dependent manner. Whole-genome transcription analysis of ICBP90 shRNA–treated rheumatoid synoviocytes uncovered a subset of proinflammatory and immune response genes that overlapped with those regulated by MIF shRNA. In addition, the expression levels of ICBP90 and MIF were correlated in joint synovia from patients with rheumatoid arthritis. These findings identify ICBP90 as a key regulator of MIF transcription and provide functional insight into the regulation of the polymorphic MIF locus.
Introduction
Macrophage migration inhibitory factor (MIF) is an upstream immunoregulatory cytokine that contributes to the pathogenesis of autoimmunity, infectious diseases, and cancer (1, 2). MIF counterregulates the immunosuppressive action of glucocorticoids and promotes the survival of different cell types by inhibiting activation-induced apoptosis (3, 4). In the case of macrophages, autocrine/paracrine MIF release sustains high expression levels of microbial pattern recognition receptors, innate cytokines, and prostaglandins (4, 5). MIF signal transduction is initiated by its engagement of CD74, which is the ligand-binding component of the MIF receptor complex, leading to phosphorylation of the CD74 intracellular domain, recruitment of the CD44 signal-transducing protein, and activation of Src family kinases (6, 7). In addition, MIF interacts with CXCR2/4, which accounts for its eponymic “arrest” function on mononuclear cells (8).
Human genetic studies have identified a 4-nucleotide microsatellite (CATT) in the MIF promoter that is present in 5 to 8 copies (–794 CATT5–8, rs5844572) (Figure 1A). Functional studies indicate that CATT repeat number is associated with inducible MIF expression such that the CATT5 repeat is a low expression allele and the CATT6, CATT7, and CATT8 repeats are progressively higher expression alleles (9). These promoter variants occur commonly in the population (minor allele frequency >5%), and higher CATT number is linked to the susceptibility or the clinical severity of autoimmune inflammatory disease (10–12). Infectious, oncogenic, and neurodevelopmental disorders with an inflammatory pathogenesis also have been associated with the MIF microsatellite, with odds ratios as high as 2.7 for meningococcal sepsis and 9.7 for metastatic prostate cancer (13–15). MIF’s upstream role in the host response is supported by studies of Mif-deficient mice, which are protected from the inflammatory sequelae of different infections or autoimmunity and show reduced tumorigenesis (16–18). These human genetic and experimental findings have prompted the recent clinical testing of anti-MIF, with the objective that therapeutic intervention may be guided by an individual’s MIF genotype (19).
Figure 1. The human MIF gene and the strategy for the identification of MIF –794 CATT5–8–interacting proteins.

(A) Diagram illustrating the 3 MIF exons, predicted transcription factor–binding sites, and the –794 CATT5–8 microsatellite repeat (rs5844572). The numerical prefixes refer to nucleotide distance (in bp) upstream from the transcription start site. (B) Diagram of synthetic 5′ biotin-labeled oligonucleotides spanning nucleotides –865/–833 to –752 of the MIF promoter used for differential affinity chromatography of human THP-1 monocyte nuclear proteins. The corresponding double-stranded oligos were used experimentally. (C) Verification of retention of the nuclear transcription factor Pit-1 by the 5′CATT8 but not 5′CATT0 oligonucleotide. Recombinant Pit-1 (10 ng) incubated with 100 nM MIF promoter 5′CATT0 or 5′CATT8 oligos prior to the addition of streptavidin beads, NaCl elution, and SDS-PAGE (4%–12%) of eluates, followed by Western blotting with anti–Pit-1 (lanes 1 and 2). Positive control Western blot showing recombinant Pit-1 alone (no oligonucleotide addition) (lane 3). The blot is representative of 3 experiments.
There is ample evidence that the MIF –794 CATT5–8 promoter microsatellite regulates transcription based on gene expression studies and on plasma MIF levels in genotyped individuals with rheumatoid arthritis (10), systemic lupus erythematosus (12), and sepsis (13). To date, however, there is scant information about the molecular regulation of this site under either physiologic or pathologic circumstances. Promoter analysis software predicts the MIF –794 CATT5–8 sequence to interact with the transcription factor, Pit-1, which activates pituitary hormone genes (20). Evidence that Pit-1 may regulate MIF expression is suggested by the initial cloning of murine MIF from pituitary cells (21), which secrete it in response to corticotropin-releasing factor (22), and by the diurnal variation in circulating MIF levels, which are influenced by neuroendocrine stress (23). Among the transcriptional elements that have been studied experimentally are promotor sites for the transcription factors Sp1 and AP-1 and those responsive to cAMP and hypoxia-inducible factor-1α (24, 25). The permissive effect of glucocorticoids on MIF transcription in human T cells also has been mapped to the GRE and ATF/CRE transcription factor–binding sites (26).
To obtain the first insight into the functional regulation of the MIF promoter microsatellite and its role in disease susceptibility to our knowledge, we used a proteomic approach to identify candidate nuclear transcription factors that interact with the MIF –794 CATT5–8 site. This analysis revealed inverted CCAAT box-binding protein of 90 kDa (ICBP90, also known as ubiquitin-like containing PHD ring finger 1 [UHRF1]) to be essential for the CATT5–8 length–dependent regulation of MIF transcription in several immune cell types. Whole-genome transcriptional analysis revealed a number of ICBP90-dependent immune response genes that overlap with immune response genes that are MIF dependent, suggesting that ICBP90 exerts a central upstream influence on inducible MIF expression.
Results
Identification of ICBP90 as a MIF –794 CATT5–8–interacting protein.
To identify candidate proteins that interact with the MIF –794 CATT5–8 microsatellite, we synthesized 5′ biotin-labeled oligonucleotides spanning this region of the MIF promoter (–865/–833 to –752) but differing in CATT repetition (with CATT0 as control) and incubated them with human monocyte nuclear lysates, followed by streptavidin absorption and graded NaCl elution (Figure 1B). We verified the utility of this approach by testing for the CATT-specific interaction of the transcription factor Pit-1, which may bind CATT motifs (20), by Western blotting. As shown in Figure 1C, this analysis revealed the retention of recombinant Pit-1 by the MIF 5′CATT8 oligo but not the control 5′CATT0 oligo. We next analyzed the monocyte nuclear proteins absorbed by the 5′CATT8-containing oligonucleotides versus the 5′CATT0-containing oligonucleotides by 2D gel electrophoresis (Figure 2A). The overall complexity of retained proteins was low, and additional and more abundant proteins were evident after electrophoresis of the MIF 5′CATT8 oligo-bound complexes versus the 5′CATT5 oligo-bound complexes. MALDI-TOF analysis of the 3 most abundant proteins present in the 5′CATT8 oligo-bound complexes identified these to be nucleolar transcription factor-1 (expectation value 1.90 × 10⁻³⁰), the transcription factor ICBP90 (expectation value 2.70 × 10⁻²⁰), and Pit-1 itself (expectation value 6.80 × 10⁻⁶) (Tables 1 and 2). As nucleolar transcription factor-1 is an abundantly expressed regulator of RNA polymerase that also appeared in the presence of the 5′CATT0 oligo, we focused attention on ICBP90 (27). Western blot analysis of monocyte nuclear proteins incubated with 5′CATT5–8 oligonucleotides revealed a CATTX length–dependent retention of ICBP90 (Figure 2B). Further evidence for the specific interaction between the MIF promoter CATTX site and ICBP90 was provided by EMSA. The addition of nuclear proteins from human monocytes shifted the mobility of a biotin-labeled, CATT8-containing MIF promoter oligonucleotide (Figure 2C, lane 1 vs. 6), and this effect was eliminated by excess unlabeled 5′CATT8 oligonucleotide (Figure 2C, lane 3) but not 5′CATT0 oligonucleotide (Figure 2C, lane 2) and inhibited by pretreating nuclear proteins with anti-ICBP90 (Figure 2C, lane 4). ChIP followed by subcloning and DNA sequencing of the PCR amplicon confirmed ICBP90 occupancy of the MIF promoter (Figure 2D and data not shown).
Figure 2. Proteomic identification of the transcription factor ICBP90.

(A) 2D gel electrophoresis and silver staining of human THP-1 monocyte nuclear proteins eluted from the MIF promoter 5′CATT0- (control), 5′CATT5-, and 5′CATT8-containing oligonucleotides, respectively. (B) MIF promoter 5′CATTX length–dependent retention of ICBP90 detected by Western blotting of eluted nuclear proteins with an anti-ICBP90 antibody. Anti–β-actin served as a protein loading control. (C) EMSA verification of the interaction of ICBP90 with the 5′CATT8 site in the MIF promoter. Nuclear lysate decreases the mobility of a biotin-labeled, CATT8-containing MIF promoter oligonucleotide (lanes 1 and 6). This effect is eliminated by the addition of a 200-fold excess of unlabeled 5′CATT8 oligonucleotide (lane 3) but not 5′CATT0 oligonucleotide (lane 2) and inhibited by anti-ICBP90 (lane 4) but not control IgG (lane 5). (D) Amplification of MIF promoter DNA by ChIP of human PBMC DNA with anti-ICBP90 but not control IgG. RU, fluorescence relative units of amplified DNA. Similar results were obtained with PBMC DNA from healthy control and subjects with rheumatoid arthritis (data not shown). (E) ICBP90 mRNA expression analyzed by qPCR in 1 × 10⁶ HEK293 cells transfected 16 hours previously with pCMV-ICBP90 or an empty vector (pCMVcon). (F) Intracellular ICBP90 protein analyzed by Western blotting of cell lysates together with a β-actin loading control. (G) Corresponding changes in intracellular MIF mRNA (qPCR), (H) intracellular MIF protein content (Western blotting), and (I) MIF secretion into 24-hour conditioned medium (ELISA). Data are mean+SD of 3 measurements, with all experiments replicated twice (n = 3 measurements per experiment). **P < 0.01 by 2-tailed Student’s t test. Displayed blots are representative of 3 independent experiments.
Table 1. MS/MS identification of proteins retained by the MIF promoter 5′CATT8 oligonucleotides.
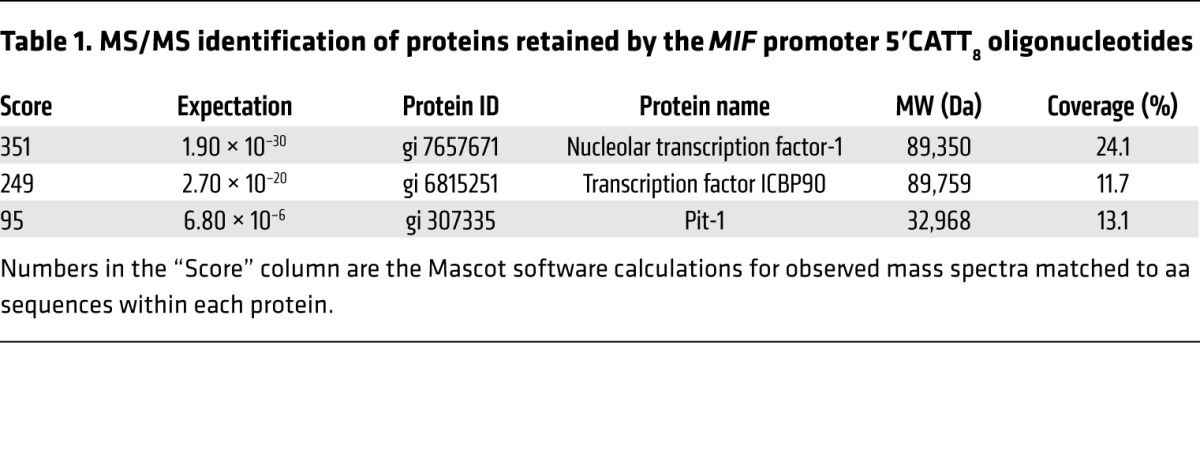
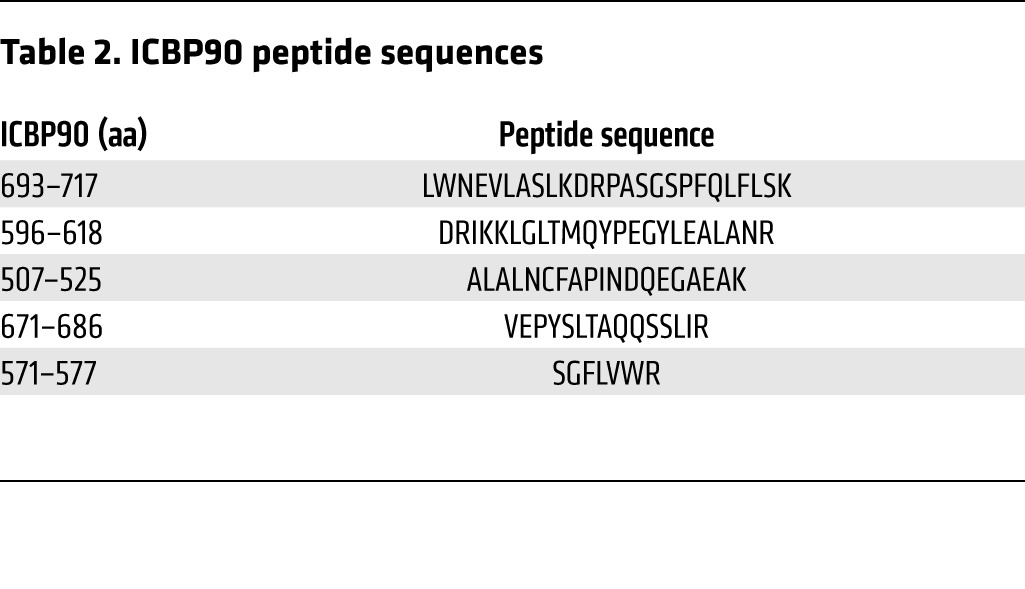
Table 2. ICBP90 peptide sequences.
As an initial test for the regulation of MIF expression by ICBP90, we prepared a CMV promoter-based expression plasmid encoding ICBP90 and transfected it into human HEK293 target cells. As shown in Figure 2, E and F, the pCMV-ICBP90 plasmid led to a 7-fold increase in the ICBP90 mRNA level as well as an appreciable increase in intracellular, immunoreactive ICBP90 protein. This increase in cellular ICBP90 expression was associated with an 8-fold increase in MIF mRNA, an increase in intracellular MIF content, and a 2.5-fold increase in secreted MIF (Figure 2, G–I).
LPS stimulates MIF production from monocytes/macrophages (28). We tested whether LPS increases the cellular expression of ICBP90 and, further, whether an shRNA-mediated reduction in cellular ICBP90 decreases LPS-inducible MIF expression. The addition of LPS to human monocytes increased the cellular expression of ICBP90 by 30%, and both the baseline and LPS-stimulated expression of ICBP90 were reduced by an ICBP90 shRNA (Figure 3A). These effects were associated with corresponding changes in the intracellular content of ICBP90 protein (Figure 3B). Of note, the inflammatory activation of monocytes was associated with a CATT repeat-dependent enhancement of MIF promoter-binding activity by ICBP90, as assessed by pull-down assays of LPS-stimulated and unstimulated nuclear lysates incubated with MIF promoter 5′CATT0–8 oligonucleotides (Figure 3C). By contrast, Pit-1 was barely detectable in monocyte nuclear extracts. LPS-activated monocytes exhibited a 30% increase in MIF mRNA when compared with unstimulated controls, and both the constitutive and inducible levels of MIF mRNA were reduced by pretreatment with ICBP90 shRNA (Figure 3D). These effects on cellular MIF mRNA expression were associated with corresponding changes in the levels of secreted MIF protein (Figure 3E) as well as in the production of the downstream, MIF-dependent cytokine, TNF-α (Figure 3F). ICBP90 undergoes PKA-dependent phosphorylation on Ser298, which enhances its interaction with target DNA (29). Phospho-ICBP90 (pICBP90) showed increased 5′CATT0–8 length–dependent binding, as revealed by reduced 5′CATT5–8-associated pICBP90 immunoreactivity in LPS-stimulated human monocytes treated with the PKA inhibitor H-89 (Figure 3G).
Figure 3. ICBP90 binds to the MIF –794 CATT5–8 promoter sequence in an activation- and CATT length–dependent manner.

(A) ICBP90 mRNA expression analyzed by qPCR in human THP-1 monocytes (1 × 10⁶) treated with 0.5 μg of a control or ICBP90 shRNA prior to stimulation with LPS (100 ng/ml, 16 hours). (B) Corresponding cellular content of ICBP90, as measured by Western blotting, with anti-ICBP90 or anti–β-actin as a protein control. (C) Detection of DNA-bound ICBP90 after incubation of the nuclear lysates that were collected from the cells used to determine cellular ICBP90 content with 100 nM each of the biotin-labeled 5′CATT0–8 oligonucleotides spanning the MIF promoter (–865/–833 to –752). The 5′CATT0–8 oligonucleotide–bound proteins were removed by streptavidin bead absorption after 3 hours at 4°C, and 1 μg of each sample was electrophoresed and immunoblotted with an anti-ICBP90 or an anti–Pit-1 antibody. (D) Quantification by qPCR of MIF mRNA in human THP-1 monocytes treated with ICBP90 or control shRNA followed by stimulation with LPS (100 ng/ml, 16 hours), together with corresponding effects on (E) MIF and (F) TNF-α protein secretion into 24-hour-conditioned medium. (G) Western blot detection of 5′CATT0–8-bound ICBP90 after incubation of nuclear lysates from LPS-stimulated human THP-1 monocytes cotreated with the PKA inhibitor H-89 (20 μM) or vehicle control. The 5′CATT0–8 oligonucleotide–bound proteins were removed by streptavidin bead absorption after 3 hours at 4°C and 1 μg of each sample was electrophoresed and immunoblotted with an anti-ICBP90 (Total) or anti-pICBP90 antibody. Data are mean+SD of 3 measurements, with all experiments replicated twice (n = 3 measurements per experiment). *P < 0.05 for LPS– vs. LPS+ controls, **P < 0.01 for ICBP90 shRNA vs. corresponding control shRNA (Con) (1-way ANOVA with Tukey’s post-hoc test).
ICBP90 regulates MIF expression in response to TLR agonists in a 5′CATT5–8-dependent manner.
Given the low abundance and absence of inflammatory induction of Pit-1 (Figure 3C), we focused further attention on defining the regulatory role of ICBP90 in –794 CATT5–8-dependent MIF expression. MIF production by human monocytes/macrophages or peripheral blood leukocytes is induced by activation of a number of TLRs, including TLR2, TLR4, TLR7, and TLR9 (12, 21, 30). To assess the functional role of ICBP90 in TLR-activated MIF expression, we measured the transcriptional activity of human THP-1 monocytes transfected with MIF –794 CATT5–8 promoter-luciferase fusion plasmids and stimulated them with different TLR ligands in the presence of a control or ICBP90 shRNA. Both basal and TLR-stimulated transcriptional activity of the MIF promoter increased proportionally as a function of CATT length, with –794 CATT5 showing the lowest gene transcription and –794 CATT8 showing the highest gene transcription (Figure 4, A–F). The greatest effect of ICBP90 knockdown on inducible transcription was for the TLR4 agonist LPS, with smaller differences in MIF expression observed in response to the TLR1/2 agonist Pam3CysK. These results agree with recent evidence that CATT alleles have a role in the human host response to Gram-negative and mycobacterial infections, in which TLR4 and TLR1/2, respectively, mediate microbial recognition (13, 31). ICBP90 knockdown had less effect on the stimulus-induced upregulation of MIF expression induced by dsRNA (TLR3), flagellin (TLR5), or CpG DNA (TLR9) than observed for TLR4 or TLR1/2 agonists, which suggests a less dominant role for ICBP90 in the response to these agonists, at least in the context of this defined monocyte-based assay. In addition, we examined the influence of ICBP90 in human primary peripheral blood mononuclear cells (PBMCs) and observed a similar inhibitory effect of ICBP90 shRNA on –794 CATT5–8 length–dependent basal and LPS-induced MIF expression (Figure 4, G and H).
Figure 4. Regulation of TLR-activated MIF expression in human monocytes by ICBP90.

THP-1 monocytes were transfected with MIF promoter-luciferase reporter plasmids bearing 0, 5, 6, 7, and 8 CATT repeats and treated with an ICBP90 or control shRNA, cultured for 6 hours, and (A) were left unstimulated or were stimulated with (B) Pam3CysK (100 ng/ml) for TLR1/2 agonism, (C) polyI:C (1 μg/ml) for TLR3 agonism, (D) LPS (100 ng/ml) for TLR4 agonism, (E) flagellin (100 ng/ml) for TLR5 agonism, or (F) CpG DNA (5 μM) for TLR9 agonism prior to measurement of luciferase activity. Primary human peripheral blood monocytes were similarly analyzed under (G) basal and (H) LPS-stimulated conditions (100 ng/ml). Data are presented as the mean+SD of 3 measurements, with all experiments replicated twice (n = 3 measurements per experiment). *P < 0.05, **P < 0.01 for control shRNA vs. ICBP90 shRNA within each panel; #P < 0.05, ##P < 0.01 for stimulated vs. basal expression for B–F vs. A and for H vs. G (2-tailed Student’s t test).
Treatment of human monocytes with MIF or ICBP90 shRNA resulted in equivalent decreases in LPS-stimulated MIF production, which is consistent with the interpretation that ICBP90 plays a direct upstream role in the TLR4-induced MIF response of human monocytes (Figure 5A). MIF itself exerts an upstream autocrine/paracrine-activating effect on monocytes, and Mif deficiency is associated with a reduction in the stimulus-induced production of TNF-α, IL-1β, IL-6, IL-8, and MCP-1 (4, 16, 32–34). We compared the effect of shRNA directed against ICBP90 with that directed against MIF on LPS-activated human monocytes by measuring the downstream production of these cytokines (and after confirming the absence of CATT motifs in their corresponding gene promoters). MIF or ICBP90 shRNA inhibited, to an equivalent degree, the time-dependent production of TNF-α, IL-1β, IL-6, IL-8, and MCP-1, supporting the conclusion that the MIF-dependent augmentation of these proinflammatory cytokines relies on ICBP90 (Figure 5, B–F).
Figure 5. Comparative effect of ICBP90 versus MIF knockdown on MIF-dependent cytokine production.

Human THP-1 monocytes were treated with shRNA directed against ICBP90, MIF, or an shRNA control and stimulated for 6 hours with LPS (100 ng/ml). Conditioned media then were harvested for analysis by specific ELISA for (A) MIF, (B) TNF-α, (C) IL-1β, (D) IL-6, (E) IL-8, and (F) MCP-1. Data are presented as the mean+SD of 3 measurements, with all experiments replicated twice (n = 3 measurements per experiment). *P < 0.05, **P < 0.01 for control shRNA versus MIF shRNA as well as for control shRNA versus ICBP90 shRNA by 1-way ANOVA for repeated measurements followed by Dunnett’s test for comparing the 2 knockdown groups with the control group at individual time points. P values are shown only for those comparisons that were significantly different.
ICBP90 regulates MIF expression in human B and T lymphocytes.
MIF is expressed by lymphoid and stromal cells and under both constitutive and activating conditions (35, 36). Treatment of human Raji B cells or Jurkat T cells with ICBP90 shRNA effectively reduced ICBP90 mRNA and intracellular protein content and was associated with a corresponding decrease in the constitutive levels of MIF mRNA and secreted protein (Figure 6, A–H). Human T cells transfected with MIF CATT5–8 promoter-luciferase fusion plasmids and stimulated with PMA also showed –794 CATT5–8 length–dependent expression of MIF mRNA that was regulated by ICBP90 (Figure 6I).
Figure 6. ICBP90 regulates MIF expression in human lymphocytes and rheumatoid synovial fibroblasts.

Cultured Raji B cells were transfected with control or ICBP90 shRNA. Eight hours later (A) ICBP90 mRNA and (B) intracellular ICBP90 protein content were measured by qPCR and Western blotting, respectively. (C) Cellular MIF mRNA was determined by qPCR, and (D) secreted MIF was determined by ELISA. Human Jurkat T cells were transfected with control or ICBP90 shRNA and analyzed for (E) ICBP90 mRNA, (F) intracellular ICBP90 protein content, (G) MIF mRNA, and (H) secreted MIF as above. (I) Jurkat T cells were transfected with MIF promoter-luciferase reporter plasmids, treated with an ICBP90 or control shRNA, cultured for 6 hours, and stimulated or not with PMA/ionomycin (100 ng/ml). Cultured human synovial fibroblasts were transfected with control or ICBP90 shRNA. Eight hours later (J) ICBP90 mRNA and (K) intracellular ICBP90 protein content were measured by qPCR and Western blotting, respectively. (L) Cellular MIF mRNA was determined by qPCR, and (M) cytosolic and (N) secreted MIF were quantified by ELISA. Cytosolic MIF is expressed as ng immunoreactive MIF/total cellular protein. Data are presented as the mean+SD of 3 measurements, with all experiments replicated twice (n = 3 measurements per experiment). *P < 0.05, **P < 0.01 by 2-tailed Student’s t test for control shRNA vs. ICBP90 shRNA (A, C–E, G–J, and L–N) and for PMA/ionomycin stimulated vs. unstimulated conditions (I).
Role of ICBP90 in the regulation of MIF expression by rheumatoid synovial fibroblasts.
Human genetic studies implicate high-expression MIF alleles in rheumatoid arthritis, and experimental data suggest a pathogenic role for MIF as a product of synovial fibroblasts that promotes their proliferative and invasive phenotype in the joint (10, 37, 38). We assessed the influence of ICBP90 on MIF mRNA expression and protein production by rheumatoid synovial fibroblasts, which remain activated after isolation and in vitro cultivation (39). Genetic knockdown of ICBP90 by shRNA reduced cellular ICBP90 mRNA by approximately 70% (Figure 6J) and led to a concomitant reduction in ICBP90 protein (Figure 6K), together with a significant decrease in the expression of MIF mRNA (Figure 6L), intracellular MIF content (Figure 6M), and constitutive MIF secretion (Figure 6N).
To better understand the primacy of ICBP90 in the regulation of MIF and MIF-directed gene expression, synovial fibroblasts freshly isolated from the affected joints of 3 patients with rheumatoid arthritis were treated with shRNA against ICBP90 or MIF, and their whole-genome transcriptional profiles were compared by microarray analysis. Threshold Ct values for the reduction in MIF expression in response to ICBP90 shRNA (24–32 cycles) were nearly as complete as the reduction in Ct values observed in response to MIF shRNA (24–34 cycles) (Figure 7A). Principal component analysis showed distinct coclustering of the gene expression profiles influenced by ICBP90 and MIF shRNAs (data not shown). Fifty percent (45 of 89) of the genes that were downregulated and ninety-seven percent (36 of 37) of the genes that were upregulated by ICBP90 shRNA were similarly influenced by MIF shRNA, suggesting that ICBP90 is a major regulator of MIF transcription in rheumatoid arthritis synoviocytes (Figure 7B). MIF shRNA treatment was associated with the downregulation of an additional 544 genes and upregulation of 733 genes, which reflects the broad and downstream autocrine/paracrine influence of MIF expression on cellular signaling and activation pathways (31, 40, 41). As ICBP90 primarily affects inducible MIF expression, the greater number of genes affected by MIF than by ICBP90 knockdown most likely reflects the broad influence of constitutive and non-ICBP90-dependent effects of MIF on cellular processes. Heatmaps for the highest scoring genes (1.5-fold differential expression, FDR < 0.05, Figure 7C) confirmed the coordinate regulation by ICBP90 and MIF of 4 of 5 innate cytokines (TNF-α, MCP-1, IL-6, and IL-1β) observed previously in human monocytes (Figure 5). The expression of IL-8 was downregulated by ICBP90 and MIF shRNA in monocytes (Figure 5E) and only by MIF shRNA in synovial fibroblasts. This may reflect the higher inducible expression of this neutrophil chemokine by monocytes than by fibroblasts (42) or the relative insensitivity of IL8 to ICBP90 regulation in fibroblasts compared with that in monocytes.
Figure 7. The ICBP90-dependent transcription response shows concordance with MIF-regulated genes in rheumatoid synovium.

(A) Comparative effect in rheumatoid synovial fibroblasts of ICBP90 shRNA (or control) on ICBP90 and MIF expression (left) versus MIF shRNA (or control) on MIF expression (right). No appreciable effect of MIF shRNA on ICBP90 expression was observed (data not shown). (B) Venn diagrams illustrating the relationship between ICBP90- and MIF-regulated gene transcripts. (C) Expression heatmaps of genes selected for 1.5-fold differential expression with FDR < 0.05. Data are for synovial fibroblast cell lines isolated from 3 individuals with rheumatoid arthritis. (D) Correlation plots for ICBP90 versus MIF mRNA expression in RNA samples obtained from the joint synovia of subjects with rheumatoid arthritis (RA, n = 86) or osteoarthritis (OA, n = 22). The expression scores were calculated from a quartile-trimmed mean of the normalized probe set values. P < 0.0001 for mean MIF expression in RA (12.81 ± 0.29) versus OA (9.37 ± 0.15); P < 0.001 for mean ICBP90 expression in RA (7.98 ± 0.67) versus OA (5.82 ± 0.334) by 2-tailed Student’s t test. (E) High genotypic MIF expressor human rheumatoid synovia express greater amounts of MIF mRNA and MIF protein than low MIF expressor genotypes. MIF mRNA was measured by qPCR analysis and expressed relative to 18S rRNA mRNA, and supernatant MIF content was measured by ELISA in 72-hour cultures of early-passage synoviocytes. Four patient-derived early-passage synovial fibroblast lines were studied for each genotype group (i.e., 4 CATT5-containing genotype lines and 4 CATT6- and CATT7-containing genotypes). Three measurements were obtained for each genotyped cell line. Mean ± SD. *P < 0.05, **P < 0.02 by 2-tailed Student’s t test.
ICBP90 is expressed in human synovia and correlates with MIF expression in vivo.
Both high CATT repeat number and increased MIF expression have been associated with the incidence or clinical severity of different forms of autoimmune arthritis, including rheumatoid arthritis (10–12). To assess whether ICBP90 is involved in regulating MIF expression in vivo, we examined the expression levels of ICBP90 and MIF mRNA in a registry of synovial tissue samples obtained by synovectomy and subjected previously to whole-tissue microarray analysis. These samples included mRNA obtained from the joints of individuals with rheumatoid arthritis and osteoarthritis. Overall, the rheumatoid synovia showed a higher mean level of MIF expression than the osteoarthritic synovia, which is in agreement with prior reports and reflects the generally noninflammatory nature of osteoarthritis (10, 43, 44). Notably, a significant correlation was observed within the rheumatoid arthritis group between the tissue expression of ICBP90 and MIF (r2 = 0.602, P < 1.8 × 10⁻⁹) (Figure 7D). A correlation was not observed in osteoarthritis subjects, in which the observed expression of both genes was significantly lower than that in synovia from subjects with rheumatoid arthritis. This correlated expression of ICBP90 and MIF supports a functional role of ICBP90 in the inflammatory expression of MIF in rheumatoid arthritis. Both rheumatoid synovia in situ and rheumatoid synovial fibroblasts in vitro express increased levels of MIF when compared with synovial tissue or fibroblasts obtained from osteoarthritis synovia (43, 44). Finally, we examined the influence of the MIF promoter microsatellite on MIF expression in early-passage rheumatoid synovial fibroblasts isolated from the synovia of patients who were either low (CATT5-containing genotypes) or high (CATT6- and CATT7-containing genotypes) MIF expressors. Both MIF mRNA expression and MIF protein production were greater in synovial fibroblast lines of high MIF expressors when compared with those of low MIF expressors.
Discussion
The identification of candidate susceptibility genes for autoimmunity is prompting closer investigation of their transcriptional regulation, with the objective of creating a more comprehensive understanding of functional interactions between loci. The –794 CATT5–8 microsatellite length variants within the MIF promoter exist commonly in the population and have been linked to the susceptibility or clinical severity of several autoimmune and infectious diseases (10, 12, 13). These functional alleles also show global population stratification, with the highest prevalence of the low-expression –794 CATT5 allele found in sub-Saharan Africa, where it may protect individuals from the lethal inflammatory sequelae of malaria (45, 46).
In the absence of information about the transcriptional regulation of the MIF microsatellite, we embarked on a proteomic approach to identify candidate proteins that might interact with the –794 CATT5–8 site from the nuclei of monocytes, which are a major cellular source of MIF in vivo (28). While Pit-1 has been suggested to be a CATT-interacting transcription factor, a notion supported by the cloning of MIF from AtT-20 pituitary cells (9, 21), we found only very low, albeit detectable, Pit-1 expression or interaction with the MIF promoter in human mononuclear cells. Our proteomic and functional analyses did identify ICBP90, a 90-kDa transcription factor characterized by a RING finger domain, in –794 CATT5–8 length–dependent MIF expression. First identified in proliferating cancer carcinoma tissues, ICBP90 has been reported to regulate G1/S cell-cycle transition (27, 47), which is notable given independent evidence that MIF influences tumorigenesis via checkpoint arrest and genomic instability (47, 48). ICBP90 has not been implicated previously in inflammatory processes but appears essential for –794 CATT5–8 length–dependent MIF expression in several immune cell types as well as in rheumatoid synoviocytes. The PKA-dependent phosphorylation of ICBP90 at Ser298 enhances its binding to DNA promoters (29), and we observed a similar augmentation by pICBP90 in –794 CATT5–8 length–dependent binding. By RNA interference, concordance was observed across several immune cell types (e.g., monocytes, B and T lymphocytes, and rheumatoid synoviocytes) between ICBP90 and MIF expression at both the mRNA and protein levels.
Monocytes/macrophages express MIF at baseline, and circulating MIF levels can be stratified by an individual’s genotype (10, 12, 13). Diverse activating stimuli upregulate MIF production, and the data herein support an important role for ICBP90 in both constitutive and inducible –794 CATT5–8 length–dependent MIF expression. RNA interference studies in monocytes transfected with MIF –794 CATT5–8 promoter constructs showed ICBP90 to have its strongest effect on MIF expression induced by bacterial agonists for TLR4 and TLR1/2, which is notable given reports that clinical outcome from infections by Neisseria meningitides and Mycobacterium tuberculosis, which activate the TLR4 and TLR1/2 receptors, respectively, is influenced by MIF genotype (13, 49). In addition, studies in subjects with systemic lupus erythematosus have shown that PBMCs from high or low MIF expressors stimulated with nucleic acid agonists produce MIF in a genotype-specific manner (12). Experimental reduction of ICBP90 expression was associated with a much smaller decrease in inducible MIF expression by nucleic acid agonists for TLR3 and TLR9 than was observed for stimulation of TLR1/2 and TLR4. This finding likely reflects a less dominant role for ICBP90 in the TLR3/9-mediated upregulation of MIF but also may be influenced by the relatively low expression level of these two pattern recognition receptors on monocytes when compared with circulating dendritic cells (50). Under conditions of TLR4 stimulation, experimental reduction of ICBP90 or MIF expression produced an equivalent decrease in the downstream expression of known MIF-dependent cytokines, namely TNF, IL-1β, Il-6, IL-8, and MCP-1.
A more detailed comparative expression analysis of ICBP90- and MIF-dependent transcription was performed using whole-genome microarray analysis of rheumatoid synovial fibroblasts. These cells maintain an activated phenotype in vitro and can be transfected with high efficiency, which facilitates such analysis, and a role for variant MIF alleles in joint erosion has been established previously by human genetic data and functional studies in Mif-deficient mice (10, 37). This analysis revealed close concordance between the genes influenced by ICBP90 and by MIF knockdown, with 50% and 97% of the genes downregulated and upregulated, respectively, by ICBP90 observed to be regulated similarly by MIF. These data affirm the upstream regulatory role of ICBP90 in MIF expression and suggest a high specificity of ICBP90 for MIF-dependent transcription in synoviocytes, with a marked effect on several proinflammatory cytokines, chemokines, and their receptors. MIF knockdown influences an additional 1,277 gene transcripts (544 downregulated, 733 upregulated), which is accord with the known activating role of MIF in downstream cellular processes (31, 40, 41).
High expression MIF alleles defined by greater than 5 repetitions of the –794 CATTX, most significantly CATT7, have been linked to the clinical severity of several autoimmune diseases and across different populations (10–12). In rheumatoid arthritis, higher repeat variants are associated with higher circulating MIF levels and with more severe radiologic joint damage. Additionally, separate studies have shown disease activity to correlate with synovial MIF expression (10, 43). In a gene expression data set of rheumatoid synovial tissues, we observed a close correlation between ICBP90 and MIF expression, supporting the regulatory role of ICBP90 in MIF transcription in vivo.
In conclusion, these studies identify ICBP90 as a transcription factor regulating –794 CATT5–8 length–dependent MIF expression. MIF is expressed in numerous cell types outside the immune system, and the present findings do not exclude a role for other CATTX-interacting transcription factors, yet to be identified, in the tissue-specific regulation of the MIF promoter microsatellite (1). It is notable that an increasing body of literature implicates MIF in stress responses and a role for Pit-1 in neuroendocrine cell types may still be defined (23, 51). Within the context of the rheumatoid synovium, it is noteworthy that ICBP90 action appears highly specific for MIF, suggesting that further investigation of the role of ICBP90 in inflammatory processes and disease pathogenesis is warranted. ICBP90 also may provide a functional link that will increase our understanding of MIF’s role in the inflammatory pathogenesis of human tumors (52, 53), especially with emerging data suggesting associations between high expression MIF alleles and tumor progression (14, 54). Finally, given ongoing efforts to develop MIF-based therapies, which may be most beneficial in high MIF expressors, the present findings open the possibility of the pharmacological targeting of ICBP90 in immunological and oncologic disease (19, 40, 55).
Methods
Cells and reagents.
Human Jurkat T cell, THP-1 monocyte, and Raji B cell lines were from ATCC and were cultured in RPMI 1640 medium containing 10% fetal bovine serum (low endotoxin, 0.5 EU/ml, BioWhittaker). Human HEK293 cells and early-passage primary rheumatoid synovial fibroblasts, isolated as described previously (39), were cultured in DMEM/10% fetal bovine serum. LPS (E. coli serotype 0111:B4) was obtained from Sigma-Aldrich, and the synthetic lipopeptide Pam3CysSerLys4 (Pam3CSK4) and flagellin were obtained from Invivogen. The anti–Pit-1 (sc-393943) and anti-ICBP90 (ab57083) antibodies were from Santa Cruz Biotechnology and Abcam, respectively, and the anti-pSer antibody was from Cell Signaling Technology (catalog 9621). The PKA inhibitor H-89 was purchased from Calbiochem.
Nuclear protein affinity screening, 2D gel electrophoresis, and liquid chromatography–mass spectrometry.
Five double-stranded oligonucleotides spanning the MIF promoter –794 CATT site (–865/–833 to –752) but differing in CATT repetition (e.g., 5, 6, 7, 8, with 0 as control) were synthesized, labeled with biotin at their 5′ termini, and linked to M-280 Streptavidin Dynabeads (Invitrogen). Duplex DNA molecules were prepared by temperature reduction annealing of complementary 3′-oligos. Nuclear proteins were extracted from human THP-1 monocytes with the Qproteome Nuclear Protein Kit (Qiagen). Typically, 3 mg nuclear protein was incubated with test oligonucleotides at 4°C for 1 hour in 1 ml of binding buffer [10 mM Hepes, pH 7.9, 1.5 mM MgCl2, 10 mM KCl, 0.5 mM DTT, and 100 ng/ml poly(dI-dC)]. The beads then were washed 3 times, and proteins were eluted with 0.1 ml aliquots of the same buffer containing 0.5 M NaCl.
For 2D gel electrophoresis, the eluted proteins were precipitated (2D Clean-Up Kit, GE Healthcare) and resuspended at 4°C in a labeling buffer containing 7 M urea, 2 M thiourea, 4% CHAPS (w/v), and 25 mM Tris (pH 8.6). The total protein content for each sample was determined by Nanodrop (Agilent). Labeling with the Cy2, Cy3, and Cy5 N-hydroxysuccinimidyl ester dyes was performed by a standard protocol (56), and the reaction was quenched with excess lysine. For the first-dimension isoelectric focusing gel, the 3 separately labeled samples were pooled and mixed with 400 μl rehydration buffer containing 7 M urea, 2 M thiourea, 4% CHAPS (w/v), 1% DTT (w/v), 2% (v/v) Pharmalyte (GE Healthcare) (pH 3−10), and trace bromophenol blue before loading onto 24-cm pH 3-10 linear IPG strips. Isoelectric focusing was performed on an Ettan IPGphor 3 (GE Healthcare) for approximately 60 kVh at 20°C and 50 μA per strip using the voltage gradient of 30 V for 1 hour, 500 V for 1 hour, and 1,000 V for 1 hour, followed by a linear gradient to 8,000 V over approximately 8 hours, until reaching 60 kVh. The IPG strips then were incubated with shaking in an equilibration buffer containing 6 M urea, 10 mM Tris (pH 6.8), 30% glycerol (w/v), 1% SDS (w/v), and 2% (w/v) DTT for 15 minutes at room temperature. The solution was replaced with equilibration buffer containing 5% iodoacetamide for an additional 10 minutes. For the 2D electrophoresis, the IPG strips were applied to 22- × 24-cm SDS-PAGE gels (12% T, 2.6% C) and overlaid with low-melting point agarose in running buffer. The gels were run at 125 V (20°C) in an Ettan DALTtwelve electrophoresis chamber. For image acquisition, gels were scanned with a Typhoon 9410 Imager at 100 μm resolution, and the data were processed using ImageQuant V5.0 and DeCyder v6.5 software (all from GE Healthcare). Spot detection was conducted on image pairs consisting of each sample from the same gel, which allowed for image overlay and direct measurement of volume ratios of spots between samples.
For MALDI-TOF, protein spots first were subjected to robotic tryptic (Promega) digestion on a GE Healthcare Ettan TA Digester. Portions of the digest (1–1,000 fmols) were desalted using a C18 ZipTip (P10 size) and 50% acetonitrile/0.1% TFA, followed by washing with 0.1% TFA. Peptides were eluted from the ZipTip with 3 μl of 60% acetonitrile/0.1% TFA, containing 3.5 mg/ml α-cyano-4-hydroxy cinnamic acid matrix. 0.8-μl samples were loaded onto the MALDI target plate. Internal calibrants (1 fmol bradykinin, 2 fmols ACTH18–39) were added with the matrix. Peptide identification was performed on an Applied Biosystems (AB) model 4800 MALDI-TOF mass spectrometer. Reflectron mass spectrometry analysis summed 1,250 laser shots to generate each peptide fingerprint map, and the spectra were internally calibrated using a bradykinin internal standard. Masses were selected by the AB 4000 Series Explorer software (v3.0) for tandem mass spectrometry (MS/MS) acquisition. MS/MS was performed first on the masses with the highest intensity to ensure that several MS/MS spectra of high quality were obtained before the MALDI spot was depleted. Up to 10 MS/MS spectra were acquired and 10,000 laser shots were combined for each MS/MS spectrum. Mass spectrum data were collected using Xcalibur mass spectrometry acquisition software, and raw data were analyzed with the MASCOT Daemon batch processing software, the MASCOT Distiller, and the MASCOT search engine algorithm.
ChIP analysis.
Ficoll-purified human PBMCs were treated with 1% formaldehyde and washed and lysed in the presence of inhibitors, and chromatin fragments were prepared by MNase digestion prior to immunoprecipitation using the Thermo Scientific ChIP Kit and the manufacturer’s protocol. Briefly, aliquots were incubated with 2 μg anti-ICBP90 (sc-98817, Santa Cruz Biotechnology) or control IgG, followed by addition of 20 μl of Protein A/G plus Agarose, and incubated under constant agitation for 1 hour. After extensive washing, the DNA-protein-antibody complexes were eluted from the agarose beads with 150 μl of 0.1 M NaHCO3/1% SDS. Following the addition of 0.2 M NaCl, all samples, including input, were incubated for 4 hours at 65°C with shaking to revert cross-linking. After treatment with 10 μM RNAase and digestion with 40 μM proteinase-K, the immunoprecipitated DNA was recovered using a DNA clean-up column. The following ChIP-grade antibodies were used: rabbit anti-ICBP90 (sc-98817, Sant Cruz Biotechnology), mouse anti–RNApol II (1862243, Thermo Scientific), and rabbit IgG (1862244, Thermo Scientific). Immunoprecipitated DNA was quantified by qPCR (5 minutes at 95°C, 35 cycles at 95°C for 30 seconds and 60°C for 30 seconds) using the iQ5 Sequence Detection System and the Power SYBR Green PCR Master Mix (Bio-Rad). A melting curve analysis was performed to discriminate between specific and nonspecific PCR products. The relative amount of MIF promoter DNA (123-bp amplicon encompassing the CATT repeat region) was determined using the following primers: MIF forward 5′-TCTTCCTGCTATGTCATG-3′; MIF reverse 5′-AATGGTAAACTCGGGGAC-3′. Data were normalized by input control DNA and expressed with respect to those of control IgG (used as calibrator). To confirm ICBP90 occupancy of the MIF promoter, the PCR amplicon derived from the anti-ICBP90 immunoprecipitated DNA was subcloned into the pTA2 vector and the CATT-containing MIF promoter sequence was confirmed by DNA sequencing.
ICBP90 cloning and expression.
A genomic sequence from GenBank (NM_001048201.1) was used for DNA amplification to produce a full-length human ICBP90F cDNA clone in the pCMV7.1 expression vector (Sigma-Aldrich). Construction fidelity was confirmed by DNA sequencing, and TOP10 cells were (Invitrogen) transformed for plasmid propagation. An ICBP90 cDNA clone in the pSG5 vector was provided by Christian Bronner (CNRS UMR 7213 Laboratoire de Biophotonique et Pharmacologie, Faculté de Pharmacie, Université de Strasbourg, Strasbourg, France).
EMSAs.
Nuclear extracts from human THP-1 monocytes were analyzed with the LightShift Chemiluminescent EMSA Kit (Thermo Scientific). Nuclear extracts (2 μg) were incubated at 4°C in 2 μl of ×10 binding buffer, 1 μl of 50 ng/μl poly(dI-dC), 11 μl ddH2O, and anti-ICBP90 or control IgG. A biotin-labeled MIF promoter oligonucleotide containing 5′CATT8 (–865 to –752, 20 fmol) was added to the reaction mixture with or without unlabeled excess 5′CATT8 or 5′CATT0 oligonucleotides (4 pmol) and incubated for 20 minutes at 22°C. Samples were electrophoresed at room temperature using 6% (w/v) nondenaturing polyacrylamide gels prior to transfer onto nylon membranes for chemiluminescence detection.
Transfection, MIF expression, and real-time qPCR studies.
MIF –794 CATT5–8–dependent transcription was analyzed using 4 corresponding MIF promoter/luciferase reporter plasmids and an isologous MIF –794 CATT0 plasmid control as described previously (9). Lipofectamine 2000 reagent was used for transient transfection of adherent cell lines (Invitrogen), and an Amaxa nucleofector was employed for suspension cell cultures. Typically, 1 μg of each MIF reporter plasmid, a β-actin Renilla luciferase plasmid, and shRNA-expressing plasmid was used per transfection; the shRNAs included ICBP90 (GI333964), Pit-1 (TG310279), HBP1 (TL312507), or control vector (TR30007) (all from Origene). In selected experiments, the transfected cells were stimulated with the TLR agonists (Pam3CSK4, LPS, flagellin, double-stranded polyI:C, CpG DNA) or PMA for an additional 6 to 8 hours of culture prior to measurement of promoter activity. Studies with primary human PBMCs used RPMI-5HS medium (RPMI 1640 plus 5% human AB serum), nucleofection technology (Amaxa), and the manufacturer’s guidelines. Luciferase assays were measured using a TD-20/20 luminometer (Turner Designs) and the Dual-Luciferase Reporter System (Promega), and signals normalized in relation to the internal Renilla luciferase activity. Each transfection experiment was performed in triplicate wells and repeated at least twice.
For real-time PCR, RNA was extracted using the RNeasy Extraction Kit (Qiagen) and cDNA was synthesized from 1 μg RNA (iScript cDNA Synthesis Kit, Bio-Rad). Real-time PCR was carried out with the iQ SYBR Green System (Bio-Rad) and nucleotide primers for ICBP90 (5′-ATGTGGATCCAGGTTCGGA-3′ and 5′-GAACAGCTCCTGGATCTT-3′) and for selected cytokines (30). The emitted fluorescence for each reaction was measured during the annealing/extension phase, and relative quantity values were calculated by the standard curve method. The quantity value of GAPDH or 18S in each sample was used as a normalizing control. Differences were evaluated by nonparametric testing using the Mann-Whitney U test.
Protein quantification.
The release of TNF-α, IL-1β, IL-6, IL-8, and MCP-1 into cell culture supernatants was determined by the Bio-PLEX PRO Luminex assay method (Bio-Rad). Immunoreactive MIF was measured by specific ELISA, as described in Sreih et al. (12). For Western blotting, equal amounts of total protein were resolved by 10% SDS–polyacrylamide gel electrophoresis and transferred onto nitrocellulose membranes, and nonspecific binding was blocked by standard protocols. The membranes were incubated overnight with anti-ICBP90 (1:1,000), and the antibody-antigen complexes were detected using an HRP-coupled anti-rabbit secondary antibody (1:2,000) and ECL detection (Pierce). Films were densitometrically analyzed using NIH ImageJ (version 1.62f).
Transcriptome and tissue expression analysis.
Total RNA from early-passage rheumatoid synovial fibroblasts (3 early-passage lines per experimental group) was isolated using RNeasy miniprep columns (Qiagen), and labeling and hybridization were performed with the Genisphere Array 900 Expression Array Detection Kit according to the manufacturer’s protocol. The OMM25K oligonucleotide gene array set (18,000 genes) was used (http://support.illumina.com/array/array_kits/humanht-12_v4_expression_beadchip_kit.html) and the cDNA probe and the fluorescent 3DNA reagent were hybridized to the microarray in succession using an Advalytix Slide Booster hybridization station. The hybridized slides were scanned with a Gene-Pix 4000 scanner (Axon Instruments), and raw data were analyzed with GenePix 5.0 analysis software. Hierarchical clustering analysis was performed using GeneSpringGX 7.3 (Agilent Technologies) to reveal relationships among the different experimental conditions. Pearson correlation was used to measure the similarity of the expression levels. Responsive genes were extracted from an unsupervised, full transcriptional profile analysis by a combination of statistical testing of absolute and relative changes in expression across the different experimental conditions and a permutation-based test to estimate false discovery. Statistical analysis among experimental groups was performed using the Student’s t test, with a FDR of less than 0.05 and a fold change of more than 1.5 considered as differential expression. Original data were deposited at the International MIF Consortium website (http://imc.isd-muc.de/) under filename MIF:ICBP90 Study.
A previously collected human synovial tissue registry, comprising samples obtained in accord with an IRB-approved protocol for subjects undergoing arthroplasty and/or synovectomy and fulfilling the American College of Rheumatology criteria for disease (57, 58), was accessed for comparative mRNA expression analysis. Synovial samples were processed for expression analysis on GeneChip Human Genome U133 Plus 2 Affymetrix arrays, and the accessed data are in GEO data sets GSE48780 and GSE7669.
Statistics.
GraphPad Prism software was used for statistical analysis. Results are expressed as mean ± SD. The Student’s t test and approximate calculation of normal distribution were used to study the difference between groups, with all comparisons being 2 tailed. One-way ANOVA with subsequent Tukey’s test for multiple comparisons was used for comparing ICBP90 knockdown shRNA with the corresponding control shRNA (Figure 3). One-way ANOVA for repeated measurements followed by Dunnett’s test was used for comparing the two knockdown groups with the control group at individual time points (Figure 5). Pearson correlation was used to measure the similarity of expression levels in the transcriptome analysis. A P value less than 0.05 was considered statistically significant.
Study approval.
The use of discarded surgical specimens from arthroplasties for the isolation of synovial fibroblasts and the drawing of peripheral blood for monocyte cultivation were approved by the Yale Human Investigations Committee. Informed consent was obtained for the procurement and analysis of these specimens.
Author contributions
JY, LL, and RB designed research. JY, WF, JZ, YZ, and XD performed experiments. MS, XY, PL, and RB analyzed data. JY and RB wrote the paper.
Acknowledgments
Gratitude is expressed for support from the NIH (AI042310, AR049610, AR050498) (to R. Bucala) and T32 HL007778 (to M. Sauler), the Alliance for Lupus Research (to R. Bucala), the Flight Attendant Medical Research Institute CIA82384 (to P. Lee), and the National Natural Scientific Foundation of China (81000225, 81572078) (to J. Yao).
Footnotes
Conflict of interest: The authors have declared that no conflict of interest exists.
Reference information:J Clin Invest. 2016;126(2):732–744. doi:10.1172/JCI81937.
References
- 1.Calandra T, Roger T. Macrophage migration inhibitory factor: a regulator of innate immunity. Nat Rev Immunol. 2003;3(10):791–800. doi: 10.1038/nri1200. [DOI] [PMC free article] [PubMed] [Google Scholar]
- 2.Morand EF, Leech M, Bernhagen J. MIF: a new cytokine link between rheumatoid arthritis and atherosclerosis. Nat Rev Drug Discov. 2006;5(5):399–410. doi: 10.1038/nrd2029. [DOI] [PubMed] [Google Scholar]
- 3.Calandra T, et al. MIF as a glucocorticoid-induced modulator of cytokine production. Nature. 1995;377(6544):68–71. doi: 10.1038/377068a0. [DOI] [PubMed] [Google Scholar]
- 4.Mitchell RA, et al. Macrophage migration inhibitory factor (MIF) sustains macrophage proinflammatory function by inhibiting p53: regulatory role in the innate immune response. Proc Natl Acad Sci U S A. 2002;99(1):345–350. doi: 10.1073/pnas.012511599. [DOI] [PMC free article] [PubMed] [Google Scholar]
- 5.Roger T, David J, Glauser MP, Calandra T. MIF regulates innate immune responses through modulation of Toll-like receptor 4. Nature. 2001;414(6866):920–924. doi: 10.1038/414920a. [DOI] [PubMed] [Google Scholar]
- 6.Leng L, et al. MIF signal transduction initiated by binding to CD74. J Exp Med. 2003;197(11):1467–1476. doi: 10.1084/jem.20030286. [DOI] [PMC free article] [PubMed] [Google Scholar]
- 7.Shi X, et al. CD44 is the signaling component of the MIF-CD74 receptor complex. Immunity. 2006;25(4):595–606. doi: 10.1016/j.immuni.2006.08.020. [DOI] [PMC free article] [PubMed] [Google Scholar]
- 8.Bernhagen J, et al. MIF is a noncognate ligand of CXC chemokine receptors in inflammatory and atherogenic cell recruitment. Nat Med. 2007;13(5):587–596. doi: 10.1038/nm1567. [DOI] [PubMed] [Google Scholar]
- 9.Baugh JA, et al. A functional promoter polymorphism in the macrophage migration inhibitory factor (MIF) gene associated with disease severity in rheumatoid arthritis. Genes Immun. 2002;3(3):170–176. doi: 10.1038/sj.gene.6363867. [DOI] [PubMed] [Google Scholar]
- 10.Radstake TRDJ, et al. Correlation of rheumatoid arthritis severity with the genetic functional variants and circulating levels of macrophage migration inhibitory factor. Arthritis Rheum. 2005;52(10):3020–3029. doi: 10.1002/art.21285. [DOI] [PubMed] [Google Scholar]
- 11.Wu SP, et al. Macrophage migration inhibitory factor promoter polymorphisms and the clinical expression of scleroderma. Arthritis Rheum. 2006;54(11):3661–3669. doi: 10.1002/art.22179. [DOI] [PubMed] [Google Scholar]
- 12.Sreih AG, et al. Dual effect of MIF gene on the development and the severity of human systemic lupus erythematosus. Arthritis Rheum. 2011;63(12):3942–3951. doi: 10.1002/art.30624. [DOI] [PMC free article] [PubMed] [Google Scholar]
- 13.Renner P, et al. A functional microsatellite of the macrophage migration inhibitory factor gene associated with meningococcal disease. FASEB J. 2011;26(2):907–916. doi: 10.1096/fj.11-195065. [DOI] [PubMed] [Google Scholar]
- 14.Meyer-Siegler KL, et al. Macrophage migration inhibitory factor (MIF) gene polymorphisms are associated with increased prostate cancer incidence. Genes Immun. 2007;8(8):646–652. doi: 10.1038/sj.gene.6364427. [DOI] [PubMed] [Google Scholar]
- 15.Grigorenko EL, et al. Macrophage migration inhibitory factor and autism spectrum disorders. Pediatrics. 2008;122(2):E438–EE45. doi: 10.1542/peds.2007-3604. [DOI] [PMC free article] [PubMed] [Google Scholar]
- 16.Bozza M, et al. Targeted disruption of migration inhibitory factor gene reveals its critical role in sepsis. J Exp Med. 1999;189(2):341–346. doi: 10.1084/jem.189.2.341. [DOI] [PMC free article] [PubMed] [Google Scholar]
- 17.Fingerle-Rowson G, et al. The p53-dependent effects of macrophage migration inhibitory factor revealed by gene targeting. Proc Natl Acad Sci U S A. 2003;100(16):9354–9359. doi: 10.1073/pnas.1533295100. [DOI] [PMC free article] [PubMed] [Google Scholar]
- 18.Hoi AY, et al. Macrophage migration inhibitory factor deficiency attenuates macrophage recruitment, glomerulonephritis, and lethality in MRL/lpr mice. J Immunol. 2006;177(8):5687–5696. doi: 10.4049/jimmunol.177.8.5687. [DOI] [PubMed] [Google Scholar]
- 19.Kerschbaumer RJ, et al. Inhibition of MIF by fully human antibodies correlates with their specificity for the β-sheet structure of MIF. J Biol Chem. 2012;287(10):7446–7455. doi: 10.1074/jbc.M111.329664. [DOI] [PMC free article] [PubMed] [Google Scholar]
- 20.Cohen LE, Wondisford FE, Radovick S. Role of Pit-1 in the gene expression of growth hormone, prolactin, and thyrotropin. Endocrinol Metab Clin North Am. 1996;25(3):523–540. doi: 10.1016/S0889-8529(05)70339-X. [DOI] [PubMed] [Google Scholar]
- 21.Bernhagen J, et al. MIF is a pituitary-derived cytokine that potentiates lethal endotoxaemia. Nature. 1993;365(6448):756–759. doi: 10.1038/365756a0. [DOI] [PubMed] [Google Scholar]
- 22.Nishino T, Bernhagen J, Shiiki H, Calandra T, Dohi K, Bucala R. Localization of MIF to secretory granules within the corticotrophic and thyrotrophic cells of the pituitary gland. Mol Med. 1995;1(7):781–788. [PMC free article] [PubMed] [Google Scholar]
- 23.Petrovsky N, Socha L, Silva D, Grossman AB, Metz C, Bucala R. Macrophage migration inhibitory factor exhibits a pronounced circadian rhythm relevant to its role as a glucocorticoid counter-regulator. Immunol Cell Biol. 2003;81(2):137–143. doi: 10.1046/j.0818-9641.2002.01148.x. [DOI] [PubMed] [Google Scholar]
- 24.Baugh JA, Gantier M, Li L, Byrne A, Buckley A, Donnelly SC. Dual regulation of macrophage migration inhibitory factor (MIF) expression in hypoxia by CREB and HIF-1. Biochem Biophys Res Commun. 2006;347(4):895–903. doi: 10.1016/j.bbrc.2006.06.148. [DOI] [PubMed] [Google Scholar]
- 25.Elsby LA, Donn R, Alourfi Z, Green LM, Beaulieu E, Ray DW. Hypoxia and glucocorticoid signaling converge to regulate MIF gene expression. Arthritis Rheum. 2009;60(8):2220–2231. doi: 10.1002/art.24659. [DOI] [PMC free article] [PubMed] [Google Scholar]
- 26.Leng L, et al. Glucocorticoid-induced MIF expression by human CEM T cells. Cytokine. 2009;48(3):177–185. doi: 10.1016/j.cyto.2009.07.002. [DOI] [PMC free article] [PubMed] [Google Scholar]
- 27.Mousli M, et al. ICBP90 belongs to a new family of proteins with an expression that is deregulated in cancer cells. Br J Cancer. 2003;89(1):120–127. doi: 10.1038/sj.bjc.6601068. [DOI] [PMC free article] [PubMed] [Google Scholar]
- 28.Calandra T, Bernhagen J, Mitchell RA, Bucala R. The macrophage is an important and previously unrecognized source of macrophage migration inhibitory factor. J Exp Med. 1994;179(6):1895–1902. doi: 10.1084/jem.179.6.1895. [DOI] [PMC free article] [PubMed] [Google Scholar]
- 29.Trotzier MA, et al. Phosphorylation of ICBP90 by protein kinase A enhances topoisomerase IIα expression. Biochem Biophys Res Commun. 2004;319(2):590–595. doi: 10.1016/j.bbrc.2004.05.028. [DOI] [PubMed] [Google Scholar]
- 30.McDevitt MA, et al. A critical role for the host mediator macrophage migration inhibitory factor in the pathogenesis of malarial anemia. J Exp Med. 2006;203(5):1185–1196. doi: 10.1084/jem.20052398. [DOI] [PMC free article] [PubMed] [Google Scholar]
- 31.Das R, et al. Macrophage Migration Inhibitory Factor (MIF) is a critical mediator of the innate immune response to Mycobacterium tuberculosis. Proc Natl Acad Sci U S A. 2013;110(32):E2997–E3006. doi: 10.1073/pnas.1301128110. [DOI] [PMC free article] [PubMed] [Google Scholar]
- 32.Assuncao-Miranda I, et al. Contribution of macrophage migration inhibitory factor to the pathogenesis of dengue virus infection. FASEB J. 2010;24(1):218–228. doi: 10.1096/fj.09-139469. [DOI] [PubMed] [Google Scholar]
- 33.Foote A, Briganti EM, Kipen Y, Santos L, Leech M, Morand EF. Macrophage migration inhibitory factor in Systemic Lupus Erythematosus. J Rheumatol. 2004;31(2):268–273. [PubMed] [Google Scholar]
- 34.Atsumi T, et al. The proinflammatory cytokine MIF regulates glucose metabolism during systemic inflammation. J Immunol. 2007;179(8):5399–5406. doi: 10.4049/jimmunol.179.8.5399. [DOI] [PubMed] [Google Scholar]
- 35.Bacher M, et al. An essential regulatory role for macrophage migration inhibitory factor in T-cell activation. Proc Natl Acad Sci U S A. 1996;93(15):7849–7854. doi: 10.1073/pnas.93.15.7849. [DOI] [PMC free article] [PubMed] [Google Scholar]
- 36.Mitchell RA, Metz CN, Peng T, Bucala R. Sustained mitogen-activated protein kinase (MAPK) and cytoplasmic phospholipase A2 activation by macrophage migration inhibitory factor (MIF). Regulatory role in cell proliferation and glucocorticoid action. J Biol Chem. 1999;274(25):18100–18106. doi: 10.1074/jbc.274.25.18100. [DOI] [PubMed] [Google Scholar]
- 37.Leech M, et al. Regulation of p53 by macrophage migration inhibitory factor in inflammatory arthritis. Arthritis Rheum. 2003;48(7):1881–1889. doi: 10.1002/art.11165. [DOI] [PubMed] [Google Scholar]
- 38.Lacey D, et al. Control of fibroblast-like synoviocyte proliferation by macrophage migration inhibitory factor. Arthritis Rheum. 2003;48(1):103–109. doi: 10.1002/art.10733. [DOI] [PubMed] [Google Scholar]
- 39.Bucala R, Ritchlin C, Winchester R, Cerami A. Constitutive production of inflammatory and mitogenic cytokines by rheumatoid synovial fibroblasts. J Exp Med. 1991;173(3):569–574. doi: 10.1084/jem.173.3.569. [DOI] [PMC free article] [PubMed] [Google Scholar]
- 40.Leng L, et al. A small-molecule macrophage migration inhibitory factor antagonist protects against glomerulonephritis in lupus-prone NZB/NZW F1 and MRL/ lpr mice. J Immunol. 2011;186(1):527–538. doi: 10.4049/jimmunol.1001767. [DOI] [PMC free article] [PubMed] [Google Scholar]
- 41.Verschuren L, et al. MIF deficiency reduces chronic inflammation in white adipose tissue and impairs the development of insulin resistance, glucose intolerance, and associated atherosclerotic disease. Circ Res. 2009;105(1):99–107. doi: 10.1161/CIRCRESAHA.109.199166. [DOI] [PMC free article] [PubMed] [Google Scholar]
- 42.Koch AE, et al. Synovial tissue macrophage as a source of the chemotactic cytokine IL-8. J Immunol. 1991;147(7):2187–2195. [PubMed] [Google Scholar]
- 43.Morand EF, Leech M, Weedon H, Metz C, Bucala R, Smith MD. Macrophage migration inhibitory factor in rheumatoid arthritis: clinical correlations. Rheumatology (Oxford) 2002;41(5):558–562. doi: 10.1093/rheumatology/41.5.558. [DOI] [PubMed] [Google Scholar]
- 44.Leech M, et al. Macrophage migration inhibitory factor (MIF) in rheumatoid arthritis. Arthritis Rheum. 1999;42(8):1601–1608. doi: 10.1002/1529-0131(199908)42:8<1601::AID-ANR6>3.0.CO;2-B. [DOI] [PubMed] [Google Scholar]
- 45.Awandare GA, et al. MIF promoter polymorphisms and susceptibility to severe malarial anemia. J Infect Dis. 2009;200(4):629–637. doi: 10.1086/600894. [DOI] [PMC free article] [PubMed] [Google Scholar]
- 46.Zhong XB, et al. Simultaneous detection of microsatellite repeats and SNPs in the macrophage migration inhibitory factor (MIF) gene by thin-film biosensor chips and application to rural field studies. Nucleic Acids Res. 2005;33(13):121–129. doi: 10.1093/nar/gni123. [DOI] [PMC free article] [PubMed] [Google Scholar]
- 47.Tien AL, et al. UHRF1 depletion causes a G2/M arrest, activation of DNA damage response and apoptosis. Biochem J. 2011;435(1):175–185. doi: 10.1042/BJ20100840. [DOI] [PMC free article] [PubMed] [Google Scholar]
- 48.Nemajerova A, Mena P, Fingerle-Rowson G, Moll UM, Petrenko O. Impaired DNA damage checkpoint response in MIF-deficient mice. EMBO J. 2007;26(4):987–997. doi: 10.1038/sj.emboj.7601564. [DOI] [PMC free article] [PubMed] [Google Scholar]
- 49.Das R, et al. Functional polymorphisms in the gene encoding macrophage migration inhibitory factor are associated with Gram-negative bacteremia in older adults. J Infect Dis. 2014;209(5):764–768. doi: 10.1093/infdis/jit571. [DOI] [PMC free article] [PubMed] [Google Scholar]
- 50.Kawai T, Akira S. TLR signaling. Semin Immunol. 2007;19(1):24–32. doi: 10.1016/j.smim.2006.12.004. [DOI] [PubMed] [Google Scholar]
- 51.Katsuura S, et al. High-throughput screening of brief naturalistic stress-responsive cytokines in university students taking examinations. Int J Psychophysiol. 2010;77(2):135–140. doi: 10.1016/j.ijpsycho.2010.05.004. [DOI] [PubMed] [Google Scholar]
- 52.Bucala R, Donnelly SC. Macrophage migration inhibitory factor: A probable link between inflammation and cancer. Immunity. 2007;26(3):281–285. doi: 10.1016/j.immuni.2007.03.005. [DOI] [PubMed] [Google Scholar]
- 53.Hagemann T, Robinson SC, Thompson RG, Charles K, Kulbe H, Balkwill FR. Ovarian cancer cell-derived migration inhibitory factor enhances tumor growth, progression, and angiogenesis. Mol Cancer Ther. 2007;6(7):1993–2002. doi: 10.1158/1535-7163.MCT-07-0118. [DOI] [PubMed] [Google Scholar]
- 54.Arisawa T, et al. Functional promoter polymorphisms of the macrophage migration inhibitory factor gene in gastric carcinogenesis. Oncol Rep. 2008;19(1):223–228. [PubMed] [Google Scholar]
- 55.Alinari L, et al. Combination anti-CD74 (milatuzumab) and anti-CD20 (rituximab) monoclonal antibody therapy has in vitro and in vivo activity in mantle cell lymphoma. Blood. 2008;117(17):4530–4541. doi: 10.1182/blood-2010-08-303354. [DOI] [PMC free article] [PubMed] [Google Scholar]
- 56.Gorg A, Weiss W, Dunn MJ. Current two-dimensional electrophoresis technology for proteomics. Proteomics. 2004;4(12):3665–3685. doi: 10.1002/pmic.200401031. [DOI] [PubMed] [Google Scholar]
- 57.Sun Y, et al. PILRalpha negatively regulates mouse inflammatory arthritis. J Immunol. 2014;193(2):860–870. doi: 10.4049/jimmunol.1400045. [DOI] [PubMed] [Google Scholar]
- 58.Pohlers D, Beyer A, Koczan D, Wilhelm T, Thiesen HJ, Kinne RW. Constitutive upregulation of the transforming growth factor-β pathway in rheumatoid arthritis synovial fibroblasts. Arthritis Res Ther. 2007;9(3): doi: 10.1186/ar2217. [DOI] [PMC free article] [PubMed] [Google Scholar]