Sixty-eight patients with treated high-grade gliomas who developed increasing enhancing masses of indeterminate nature underwent DWI and DSC as part of their studies. Pseudoprogression was found in 15% who showed higher ADC as well as lower relative cerebral blood volume when compared with those with recurrent tumors.
Abstract
BACKGROUND AND PURPOSE:
Treatment-related changes and recurrent tumors often have overlapping features on conventional MR imaging. The purpose of this study was to assess the utility of DWI and DSC perfusion imaging alone and in combination to differentiate treatment-related effects and recurrent high-grade gliomas.
MATERIALS AND METHODS:
We retrospectively identified 68 consecutive patients with high-grade gliomas treated by surgical resection followed by radiation therapy and temozolomide, who then developed increasing enhancing mass lesions indeterminate for treatment-related changes versus recurrent tumor. All lesions were diagnosed by histopathology at repeat surgical resection. ROI analysis was performed of the enhancing lesion on the ADC and DSC maps. Measurements made by a 2D ROI of the enhancing lesion on a single slice were recorded as ADCLesion and rCBVLesion, and measurements made by the most abnormal small fixed diameter ROI as ADCROI and rCBVROI. Statistical analysis was performed with Wilcoxon rank sum tests with P = .05.
RESULTS:
Ten of the 68 patients (14.7%) had treatment-related changes, while 58 patients (85.3%) had recurrent tumor only (n = 19) or recurrent tumor mixed with treatment effect (n = 39). DWI analysis showed higher ADCLesion in treatment-related changes than in recurrent tumor (P = .003). DSC analysis revealed lower relative cerebral blood volume (rCBV)Lesion and rCBVROI in treatment-related changes (P = .003 and P = .011, respectively). Subanalysis of patients with suspected pseudoprogression also revealed higher ADCLesion (P = .001) and lower rCBVLesion (P = .028) and rCBVROI (P = .032) in treatment-related changes. Applying a combined ADCLesion and rCBVLesion model did not outperform either the ADC or rCBV metric alone.
CONCLUSIONS:
Treatment-related changes showed higher diffusion and lower perfusion than recurrent tumor. Similar correlations were found for patients with suspected pseudoprogression.
Differentiating treatment-related changes from recurrent tumor in treated patients with high-grade glioma (HGG) remains challenging due to overlapping clinical and radiologic features. Both may present with new and/or increasing enhancing mass lesions and fulfill standard response criteria for progression.1 Radiation therapy (RT) and chemotherapy can increase capillary permeability and alter the blood-brain barrier, leading to increased leakiness of contrast agent and increased contrast enhancement in the absence of tumor.2,3 At histopathology, these treatment-related changes are characterized by vascular dilation, fibrinoid necrosis, and endothelial damage of normal cerebral vasculature.4 In contrast, recurrent tumors are characterized by the presence of tumor cells, increased cellularity, and vascular proliferation.5–7
Treatment-related changes may be clinically separated into early pseudoprogression and late radiation necrosis on the basis of timing. Pseudoprogression usually develops <6 months after RT with self-limited enhancing lesions that spontaneously stabilize and resolve without any new treatment. Patients who develop pseudoprogression have been described as having improved survival,3,8–10 due to favorable correlation with methylated O6-methylguanine-DNA methyltransferase (MGMT) promoter status.11 In contrast, radiation necrosis usually occurs >12–18 months after RT, with progressive enhancing lesions that are associated with worsened morbidity. Although pseudoprogression and radiation necrosis are thought to represent distinct clinical and pathophysiologic mechanisms,11 they share many histologic similarities such as inflammatory infiltrates and necrosis, which translate into similar imaging characteristics.9
Diffusion and perfusion MR imaging provide physiologic information that is not available with conventional MR imaging. DWI measures the motility of water molecules and alterations in the balance of intracellular and extracellular water restricted by cell membranes and other structures.12 Areas of diffusion restriction in tumors are correlated with increased tumor cellularity and/or inflammatory processes. DSC MR imaging perfusion is a complementary technique that provides independent information on neoangiogenesis, vascular attenuation, and microvascular leakiness.2,13 While both techniques have been examined individually in patients with suspected treatment-related changes, few studies have examined the utility of combining these 2 techniques. The purpose of this study was to assess the utility of DWI and DSC perfusion imaging in differentiating treatment-related changes and recurrent tumor. We hypothesized that the combination of DWI and DSC predictors would improve diagnostic accuracy over either alone.
Materials and Methods
Patients
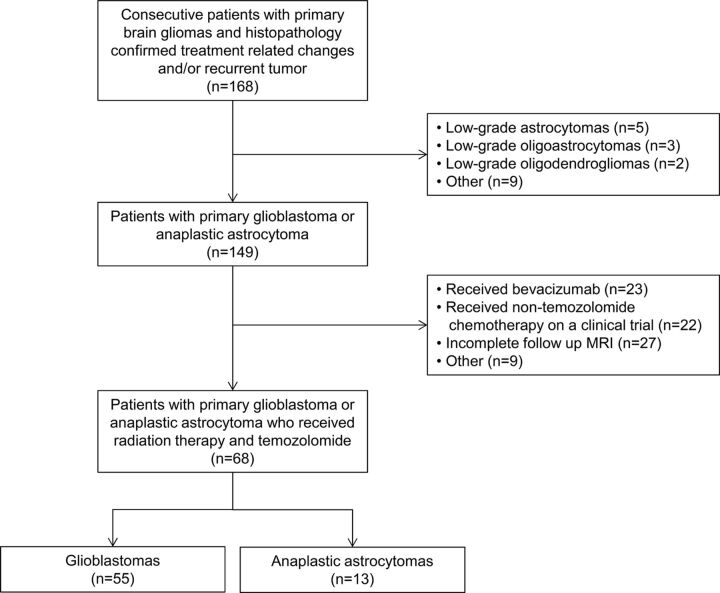
This retrospective study was granted a waiver of informed consent by the hospital institutional review board. In compliance with all Health Insurance Portability and Accountability Act regulations, we queried a hospital data base for patients with histopathologic evidence of HGG according to revised World Health Organization criteria. As summarized in Fig 1, the final patient cohort consisted of 68 consecutive patients with HGG according to the following inclusion criteria: 1) diagnosis of primary glioblastoma or anaplastic astrocytoma, 2) treatment with RT and temozolomide (Temodar), 3) new and/or increasing enhancing mass lesions at follow-up MR imaging suspicious for treatment-related changes versus recurrent tumor, and 4) brain MR imaging, including contrast T1-weighted imaging with DWI and/or DSC perfusion, ≤35 days before subsequent resection of the enhancing mass lesion.
Fig 1.
Description of patient cohort.
The 68 patients consisted of 51 men (75%) and 17 women (25%) with a median age of 54.9 years (range, 22.6–79.4 years). Chart review was performed by an experienced neuro-oncologist blinded to the DWI and DSC results. At initial diagnosis, patients underwent gross total resection of all enhancing tumors (n = 41, 60.3%), subtotal resection of the enhancing tumors (n = 24, 35.3%), or biopsy (n = 3, 4.4%). When available, MGMT promoter status was determined by review of results from real-time polymerase chain reaction amplification. Most patients (n = 66, 97.1%) received partial brain RT to 5940–6000 cGy in 30–33 fractions during 6 weeks. In 2 patients (2.9%), partial brain RT was administered to 4005 cGy in 15 fractions during 3 weeks, which is an equivalent alternative for the elderly or patients with deconditioning.14 All patients except 1 received concomitant temozolomide, and all patients received adjuvant temozolomide at standard (n = 62, 91.2%) or alternative doses according to an ongoing clinical trial (n = 6, 8.8%).15 Patients were followed to determine overall survival.
Lesion Diagnosis
In each case, the lesion diagnosis was determined by histopathology at repeat surgical resection. Treatment-related changes were defined as necrotizing treatment effects with the complete absence of tumor. Recurrent tumor was defined as any amount of tumor (ie, pure tumor and tumor admixed with necrotizing treatment effects).
MR Imaging Parameters
MR images were obtained by using 1.5T and 3T magnets (Signa Excite and Discovery 750; GE Healthcare, Milwaukee, Wisconsin). In addition to the DWI and DSC parameters described below, standard T1-weighted, T2-weighted, FLAIR, and triplanar contrast T1-weighted images were obtained. A trained operator (with 2 years' experience in MR imaging postprocessing) blinded to clinical status (eg, symptomatic or asymptomatic) and lesion diagnosis performed DWI and DSC analysis under the direct supervision of a board-certified radiologist with a Certificate of Added Qualification in neuroradiology (with 14 years' experience).
DWI
DWI was performed by using single-shot echo-planar imaging with b-values = 0 and 1000 s/mm2. The DWI data were transferred along with the anatomic data to an off-line workstation (Advantage Workstation; GE Healthcare) and were analyzed by using commercial software (FuncTool 4.6; GE Healthcare). ADC maps were calculated, coregistered with the axial contrast T1-weighted images, and then displayed as overlays. The contrast images were inspected, and the section containing the maximum diameter of the enhancing lesion was selected for subsequent ROI analysis. We manually drew a 2D-ROI around the entire enhancing lesion on a single section, while excluding blood vessels and areas of hemorrhagic, cystic, and/or necrotic-appearing change. The ROI was transferred to the ADC map, and the mean value was recorded as ADCLesion. In addition, up to 4 small circular ROIs (approximately 0.5 mm2) were manually drawn in the enhancing lesion on the same contrast section, transferred to the ADC map, and adjusted as necessary to target areas with visually low ADC values; the single minimum ADC measurement was recorded as ADCROI. This technique has been described as the most accurate and reproducible way to obtain ROI-based measurements.16–18 The ADCRatio was calculated by dividing the ADCROI by the ADCnormal contralateral white matter (NL) obtained from measuring a similar small circular ROI in the contralateral normal brain.
DSC
DSC was performed by using gradient-echo echo-planar images with TR = 1000–1200 ms, TE = 40–50 ms, matrix = 128 × 128, flip angle = 60°, section thickness = 5 mm, intersection gap = 0, sections = 12–18. Multisection image data were acquired every second for a total of 60 seconds with the contrast injection beginning at 10 seconds. Gadopentetate dimeglumine (Magnevist; Bayer HealthCare Pharmaceuticals, Wayne, New Jersey) was power-injected though a peripheral intravenous catheter at doses standardized by patient body weight (0.2 mL/kg body weight, to a maximum of 20 mL) at 2–5 mL/s and immediately followed by a 20-mL saline flush at the same rate. No preload contrast was administered.
The DSC data were transferred along with the anatomic data to an off-line workstation (Advantage Workstation) and were analyzed by using commercial software (FuncTool 4.6). T2*-weighted signal intensity–time curves were derived on a voxel-by-voxel basis. Post hoc correction for leakage was performed by using γ-variate curve fitting to approximate the curve without recirculation and leakage.19 Cerebral blood volume maps were calculated, coregistered with the contrast T1-weighted images, and displayed as overlays. ROI analysis for CBV was performed in a manner similar to that of ADC. A single contrast section containing the maximum diameter of the enhancing lesion was selected, and an ROI was drawn around the entire enhancing lesion. Areas of hemorrhage, blood vessels, susceptibility artifacts, and cystic or necrotic change were excluded. The control CBVNL was initially placed in the normal white matter contralateral to the enhancing lesion. The relative CBV of the lesion (rCBVLesion) was calculated by dividing the CBVLesion, drawn around the entire enhancing lesion on a single section, by the CBVNL. Next, 4 small (approximately 0.5 mm2) circular ROIs were drawn in the enhancing lesion, transferred to the CBV map, adjusted as necessary to target the areas with the visually highest CBV, and the ROI with the maximal CBV abnormality was measured and selected as the CBVROI. The location of the small ROI for CBV was often the same as the location of the small ROI for ADC because the 2 were placed to target different biologic processes. The CBVROI was divided by the CBVNL to yield the relative CBVROI (rCBVROI). The signal intensity–time curve of the CBVROI was also used to determine S0 = precontrast baseline signal intensity, Smin = minimum signal intensity at the peak of contrast bolus, and S1 = end signal intensity at 60 seconds. These values were then used to calculate the percentage signal recovery (PSRROI) = (S1 − Smin)/(S0 − Smin). PSRROI is a measure of permeability influenced by leakage of contrast and the size of the extravascular space,20 with lower PSR reflecting higher permeability.
Statistical Analysis
Comparisons between treatment-related change and recurrent tumor groups were performed by using Wilcoxon rank sum tests. Optimal threshold values for ADCLesion and rCBVLesion were obtained by area under the curve (AUC) analysis derived from the receiver operating characteristic (ROC) curves and maximizing the sum of sensitivity and specificity. Overall survival analysis was performed by fitting a univariate Cox model to report the hazard ratio (HR) with P values. Multivariate analysis was not performed due to the small number of events (treatment-related changes). Statistical significance was set at P = .05.
To specifically examine patients with possible pseudoprogression, we performed an analysis for the subset of patients who developed new and/or increasing enhancing lesions <6 months (<180 days) after completion of RT. Similar Wilcoxon rank sum tests and ROC and AUC analyses were performed.
Results
The cohort consisted of patients with HGG with glioblastoma (n = 55, 80.9%) and anaplastic astrocytoma (n = 13, 19.1%). MGMT promoter status was known for 31 patients (46%), with more unmethylated (n = 19, 61%) than methylated (n = 12, 39%) tumors. During follow-up, all patients developed a new and/or increasing enhancing lesion suspicious for recurrent tumor or treatment-related change and underwent repeat surgery. The mean interval from the end of RT to the repeat surgery was 6.1 months (range, 0.4–40.4 months), with patients undergoing gross total resection of the entire enhancing lesion (n = 38, 55.9%) or subtotal resection of the enhancing lesion (n = 30, 44.1%). Subsequent histopathology revealed treatment-related changes (n = 10, 14.7%) or recurrent tumor (n = 58; 85.3%, consisting of n = 19 tumor only and n = 39 tumor admixed with necrotizing treatment effects). Of the patients with treatment-related changes, most had gross total resections (n = 6, 60%). Due to evolving MR imaging standards of care during the study period, all 68 patients underwent DWI and most patients (n = 41, 60.3%) underwent both DWI and DSC.
DWI
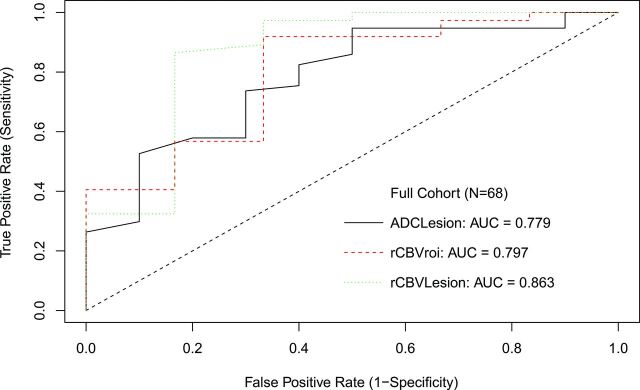
Diffusion analysis showed higher ADCLesion in treatment-related change (P = .003). An ADCLesion threshold of ≤0.00149 mm2/s to optimize both sensitivity and specificity in declaring tumor had 73.7% sensitivity, 70% specificity, and AUC = 0.779. ADCLesion ≤0.0016 mm2/s had 94.7% sensitivity and 50% specificity to maximize sensitivity for tumor, while ADCLesion ≤0.00139 mm2/s had 52.6% sensitivity and 90% specificity to maximize specificity. ROC curves are shown in Fig 2.
Fig 2.
ROC curve for all patients.
DSC
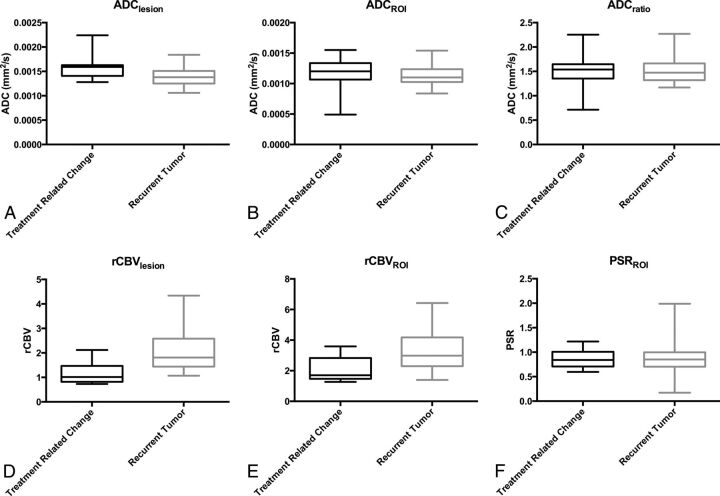
For perfusion, both rCBVLesion (P = .003) and rCBVROI (P = .011) were lower in treatment-related change. An optimized rCBVLesion threshold of ≥1.27 had 86.5% sensitivity and 83.3% specificity with AUC = 0.863 to declare tumor. This AUC was not significantly better than the best AUC derived from DWI, with P = .36. With a commonly applied threshold ≥1.75,9,21,22 rCBVLesion had 56.8% sensitivity and 83.3% specificity. An optimized rCBVROI of ≥1.74 showed 91.9% sensitivity and 66.7% specificity with AUC = 0.797. Results are summarized in Table 1 and Fig 3.
Table 1:
Diffusion and perfusion results in all patientsa
| Treatment-Related Change (Median) | Recurrent Tumor (Median) | P Value | Survival Analysis |
||
|---|---|---|---|---|---|
| HR | P Value | ||||
| ADCLesion | 0.00159 | 0.00138 | .003b | 3.547 | .104 |
| ADCROI | 0.0012 | 0.0011 | .13 | 0.437 | .352 |
| ADCRatio | 1.538 | 1.471 | .37 | 0.515 | .283 |
| rCBVLesion | 1.015 | 1.81 | .003b | 1.286 | .183 |
| rCBVROI | 1.7 | 2.98 | .011b | 1.316 | .019b |
| PSRROI | 0.84 | 0.85 | .53 | 0.204 | .036b |
ADC is reported in mm2/s; rCBV and PSR are unitless.
Significant values.
Fig 3.
Box-and-whisker plots for parameters in Table 1.
DWI and DSC
An analysis was performed for the subset of patients (n = 41) with both DWI and DSC data. Using ADCLesion ≤0.00149 mm2/s and rCBVLesion ≥1.27 to predict recurrent tumor, we found 51.2% sensitivity (21/41 recurrent tumors correctly identified) and 100% specificity (8/8 treatment-related changes correctly identified). This combined model was not significantly better than rCBVLesion alone.
Pseudoprogression
For patients (n = 51) who developed worsening lesions <6 months after RT, histopathology revealed pseudoprogression in 8 (15.7%) patients and recurrent tumor in 43 (84.3%) patients. Due to low numbers of known MGMT status (n = 21/51, 41.2%), particularly in the pseudoprogression group (n = 3), further stratification by MGMT status was not performed.
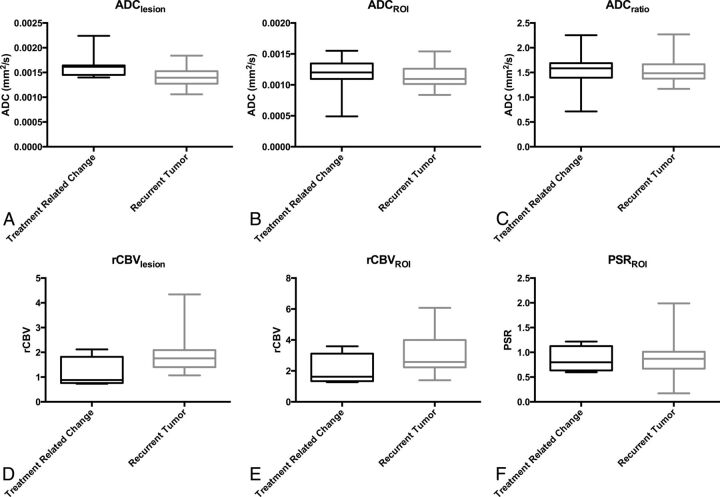
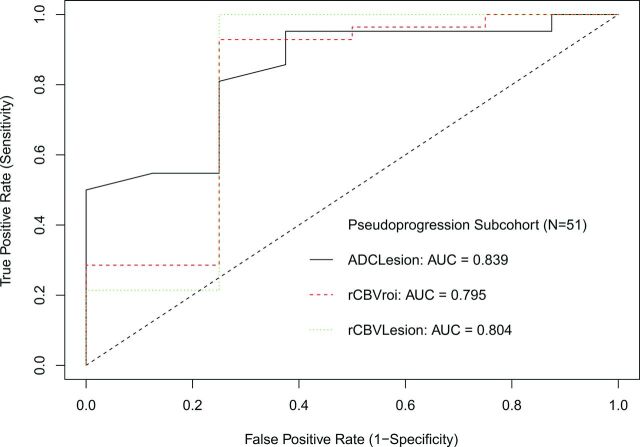
All patients had DWI available for analysis, and most (n = 33, 64.7%) had both DWI and DSC available, though only half of the patients with pseudoprogression (n = 4) had DSC. For DWI, ADCLesion was higher in pseudoprogression (P = .001), while ADCROI and ADCRatio were not different (P > .12). The ADCLesion had an AUC of 0.839, and a threshold of >0.0016 mm2/s showed 63% specificity and 95% sensitivity. Results are summarized in Table 2 and Fig 4, and ROC curves are shown in Fig 5.
Table 2:
Diffusion and perfusion results in patients <6 months from RTa
| Treatment-Related Change (Median) | Recurrent Tumor (Median) | P Value | Survival Analysis |
||
|---|---|---|---|---|---|
| HR | P Value | ||||
| ADCLesion | 0.00162 | 0.00139 | .001b | 5.563 | .047b |
| ADCROI | 0.0012 | 0.0011 | .128 | 0.653 | .651 |
| ADCRatio | 1.585 | 1.482 | .288 | 0.703 | .595 |
| rCBVLesion | 0.88 | 1.76 | .028b | 1.382 | .233 |
| rCBVROI | 1.625 | 2.575 | .032b | 1.563 | .009b |
| PSRROI | 0.80 | 0.87 | .467 | 0.166 | .040b |
ADC is reported in mm2/s; rCBV and PSR are unitless.
Significant values.
Fig 4.
Box-and-whisker plots for parameters in Table 2.
Fig 5.
ROC curve for patients <6 months after RT.
For DSC, rCBVLesion (P = .028) and rCBVROI (P = .032) were lower for pseudoprogression. The AUC for rCBVLesion was 0.804, and for rCBVROI, it was 0.795. The best threshold for rCBVLesion to predict pseudoprogression was <1.07 with 75% specificity and 100% sensitivity, and for rCBVROI, it was <1.74 with 75% specificity and 92.9% sensitivity.
A subanalysis was performed to evaluate a combined DWI and DSC model for the patients at risk for pseudoprogression. When using ADCLesion ≤0.0016 and rCBVLesion ≥1.07 to predict recurrent tumor, we found 93.1% sensitivity (21/41 recurrent tumors correctly identified) and 83.3% specificity (5/6 treatment-related changes correctly identified). This finding was not significantly better than rCBVLesion alone. Representative T1-weighted imaging, DWI, ADC maps, and rCBV maps for pseudoprogression and recurrent tumors are shown in Figs 6 and 7.
Fig 6.
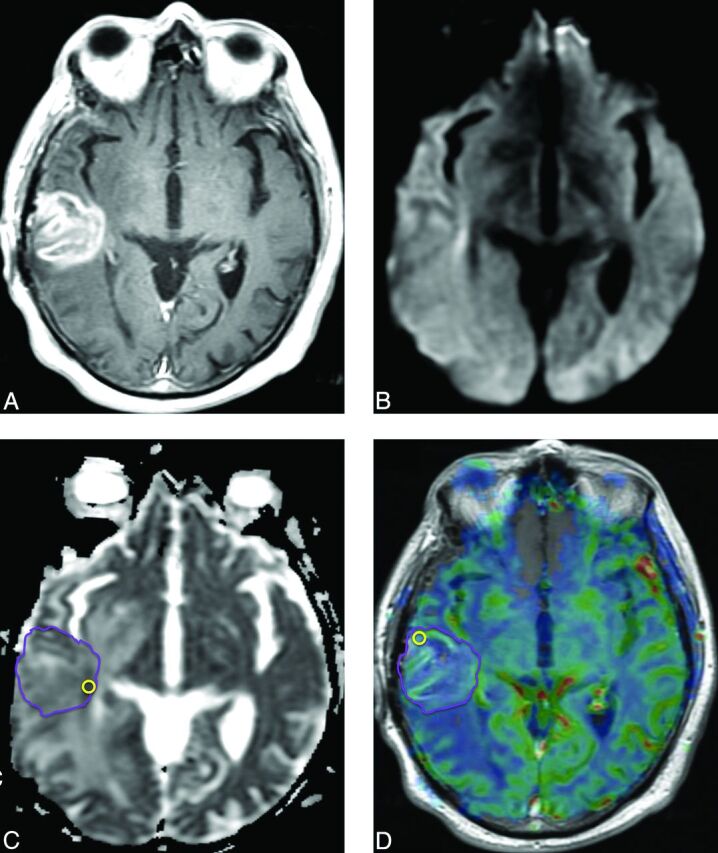
Pseudoprogression. Six months following RT with concomitant and adjuvant temozolomide, this patient with glioblastoma developed a new heterogeneously enhancing mass lesion in the right posterior temporal lobe on a contrast T1-weighted image (A) with no diffusion restriction on DWI (B) or ADC (C). ADCLesion = 0.00142 mm2/s. An rCBV map overlaid on a contrast T1-weighted image (D) shows no increase in perfusion. rCBVLesion = 1.41. Repeat surgery confirmed treatment-related changes.
Fig 7.
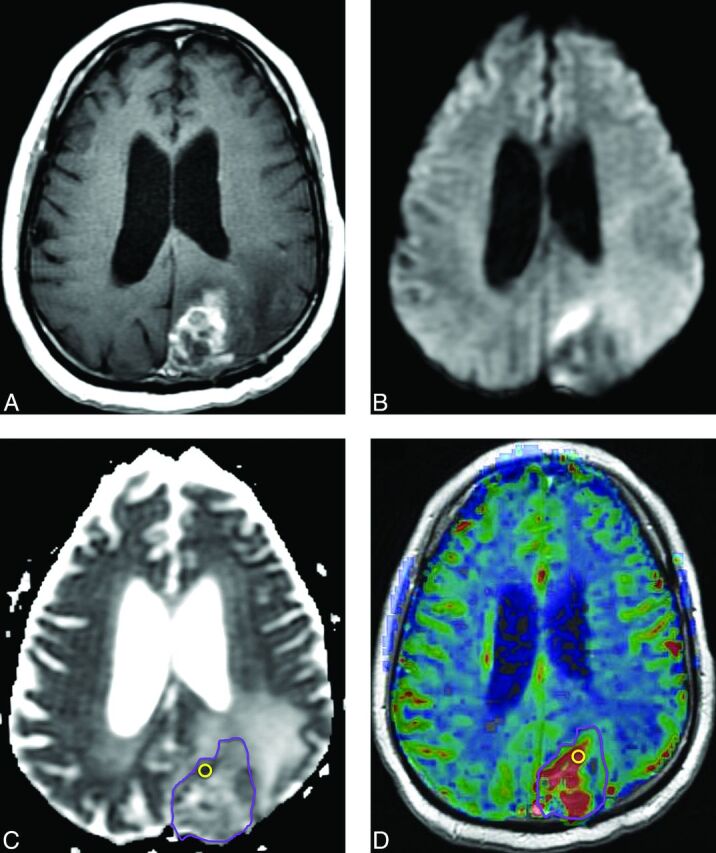
Recurrent tumor. Five months later after RT with concomitant and adjuvant temozolomide, this patient with glioblastoma developed a new heterogeneously enhancing mass lesion in the left occipital lobe on a contrast T1-weighted image (A) with heterogeneously increased signal on DWI (B) and decreased ADC (C). ADCLesion = 0.00123 mm2/s. rCBV map (D) shows hyperperfusion. rCBVLesion = 2.78. Repeat surgery confirmed recurrent tumor.
Survival
For all patients, the predictors of overall survival were rCBVROI (HR = 1.32, P = .019) and PSRROI (HR = 0.204, P = .036). For the subset of patients with suspected pseudoprogression presenting with enhancing lesions <6 months after completing RT, the predictors of overall survival were ADCLesion (HR = 5.563, P = .047), rCBVROI (HR = 1.557, P = .009), and PSRROI (HR = 0.166, P = .04). The other diffusion and perfusion metrics were not significant (P > .10).
Discussion
We found higher diffusion and lower perfusion values in treatment-related changes than in recurrent tumor in patients with HGGs as confirmed by histopathology. These results probably reflect the lower cellularity and vascularity of treatment-related changes, respectively, and suggest that DWI and DSC are useful tools in discriminating treatment-related changes from recurrent tumor. DSC outperformed DWI in predicting treatment-related changes, while the combination of DSC and DWI yielded higher specificity at the expense of lowered sensitivity.
DWI has been shown to be helpful in determining treatment response, with several studies describing higher mean ADC values or ADC ratios than those in recurrent tumors.12,23 Other articles have applied ADC histogram analysis24 and 3-layer patterns of ADC analysis,25 though these techniques are not commercially available and have not been incorporated into clinical practice. ADC may be decreased with treatment-related changes, possibly due to cellular inflammatory factors and abundant polymorphonuclear lymphocytes.23,25 Our results suggest that these inflammatory-related decreases in ADC are less marked than those that occur in recurrent tumors due to high cellularity.
DSC has also been described as useful for distinguishing treatment-related changes from recurrent tumor.9,26–28 Alterations in perfusion parameters may occur due to inflammation and vascular changes, including vascular elongation, aneurysmal formation, and proliferation of endothelial cells in response to radiation injury. In patients with glioblastoma with suspected radiation necrosis at a mean of >300 days after RT, Barajas et al26 found lower rCBV (P < .01) and higher PSR (P < .05) in the necrosis group. In patients with glioblastoma with suspected pseudoprogression at a mean of 133 days after RT, Young et al9 reported similar results with lower rCBV (P = .009) and higher PSR (P = .039). These studies indicate that despite possible differences in the underlying pathophysiologic processes for early pseudoprogression and late radiation necrosis and the very different clinical courses and implications, the 2 entities share common imaging features along a spectrum of treatment-related changes—and that similarities on conventional scans may also translate into similarities on advanced MR imaging by using DSC as well as DWI.
Few studies have examined the combination of DWI and DSC imaging for distinguishing treatment-related changes and recurrent tumor. In 38 patients with primary brain tumor, Fink et al29 reported that rCBV (AUC = 0.917, P < .001) outperformed ADCRatio (AUC = 0.726, P = .035) in determining postradiation injury. Patients in their study had a mix of HGGs (n = 20) and low-grade gliomas (n = 17) as well as an ependymoma, however, who received a variety of chemotherapy agents and inconsistently underwent RT (n = 6, no RT). In addition, their median interval for clinical and radiological follow-up was 17.6 months with a wide range (1.2–164.5 months), and only 35% were confirmed by histopathology. A small study of 8 patients with glioma (n = 7, HGG) by Bobek-Billewicz et al,30 also reported lower rCBV in radiation injury (median, 13 months; range, 3–70 months) with insignificant results for ADC probably due to their small cohort.
We used histopathology as the reference standard against which the imaging results were tested. Because all patients in this study underwent gross total or subtotal resections rather than biopsies, the likelihood of sampling error was lessened. The power of our study may have been affected by the fewer patients (14.7%) determined to have treatment-related changes at repeat surgery. This number probably reflects our definition of recurrent tumor as any amount of tumor at histopathologic analysis, with treatment-related changes having a relatively conservative definition as the complete absence of any identifiable tumor. We did not attempt to stratify by fraction of tumor versus fraction of treatment-related changes because there is no standard definition of how little tumor is permissible to diagnose treatment-related changes rather than recurrent tumor. We also did not attempt to distinguish active (eg, mitotic figures, vascular proliferation, necrosis with pseudopalisading) and inactive (ie, quiescent) tumor. The literature definition of treatment-related changes is inconsistently described as “necrosis without evidence of tumor,”31 “pure treatment-related necrosis,”32 “≤20% … neoplasm,”27 “no to minimal identifiable tumor,”10 “<1% viable tumor,”20 or simply “at pathologic analysis.”33 Despite these limitations, histopathology remains the reference standard and is often considered preferable to clinical and radiologic definitions, which are more subjective and influenced by patient signs, symptoms, medications, and follow-up.
Both DWI and DSC may be useful in differentiating treatment-related changes from recurrent tumor, with DSC performing slightly better as a predictor. We found increased specificity when both ADCLesion and rCBVROI were applied in a combined model for all patients, though the increase in specificity (100%) was accompanied by a decrease in sensitivity (51%). While the clinical dilemma is usually to accurately identify treatment-related changes, for which the high specificity should be helpful, the decrease in sensitivity for only an incremental increase in specificity limits the usefulness of combining the 2 metrics. For the subgroup of patients at <6 months after RT at risk for pseudoprogression, the specificity and sensitivity when using both ADCLesion and rCBVROI were slightly better (but not significantly better) than rCBVROI alone. Compared with DSC, DWI has the distinct advantage of widespread adoption into routine imaging protocols, as well as being a rapid-acquisition, noncontrast technique with highly reproducible results. We, therefore, suggest that whenever possible, patients with suspected treatment-related changes should undergo both DSC and DWI.
A few potential limitations were encountered. First, this was a retrospective study in which only 60.3% had both DWI and DSC imaging, which may have decreased our evaluation of the combined diffusion and perfusion model. In addition, fewer patients had treatment-related changes, and only 4 of 8 patients with pseudoprogression had DSC data available for analysis. Despite the small sample sizes, we detected significant differences in diffusion and perfusion metrics and suggest that DSC may be a useful technique for detecting pseudoprogression. Second, there was some heterogeneity in MR imaging scanner field strengths and contrast injection rates that may have affected DSC perfusion time curves, though such variability was minimized by standardized scan parameters, contrast dose, and postprocessing techniques. Third, there may have been a clinical bias to preferentially recommend surgery for patients with large enhancing lesions, mass effect, and/or worsening signs/symptoms. Patients who have treatment-related changes, particularly pseudoprogression, are more likely to be asymptomatic8 and therefore more likely to undergo follow-up rather than repeat surgery. While this outcome may have decreased the power of our results, we still found significant results for both DWI and DSC. Fourth, <50% of our patients had known MGMT status, which was still emerging as the standard of care during the time of the study. Because studies have shown positive correlations between MGMT status and pseudoprogression,8,11 this correlation is an attractive area for future study. Fifth, we used two 2D-ROI measurements that encompassed the entire lesion and targeted the areas of maximal abnormality. These techniques are rapid, reproducible, robust by using commercial software, and are commonly used in clinical practice.17,18 Although some authors have implemented 3D volumetric measurements,34 these tools often require additional technical expertise and are not widely available.
Conclusions
DWI and DSC may be helpful in differentiating treatment-related changes and recurrent HGGs. We found that DSC may outperform DWI alone and in combination to predict treatment-related changes as distinguished from recurrent tumor. We suggest that both DSC and DWI be used to improve specificity.
ABBREVIATIONS:
- AUC
area under the curve
- HGG
high-grade glioma
- HR
hazard ratio
- NL
normal contralateral white matter
- MGMT
O6-methylguanine-DNA methyltransferase
- PSR
percentage signal recovery
- rCBV
relative cerebral blood volume
- ROC
receiver operating characteristic
- RT
radiation therapy
Footnotes
Disclosures: Alisa J. Prager—RELATED: Grant: Memorial Sloan Kettering Cancer Center Medical Student Summer Fellowship Research Program.* Antonio Omuro—UNRELATED: Consultancy: Roche, Novocure, CarThera. Zhigang Zhang—RELATED: Grant: National Institutes of Health Core Grant P30 CA008748.* *Money paid to the institution.
This work was supported by a Department of Radiology Seed Grant, Memorial Sloan Kettering Cancer Center (R.J.Y.); the Summer Medical Student Fellowship, Memorial Sloan Kettering Cancer Center (A.J.P.); and the Memorial Sloan Kettering Cancer Center Epidemiology and Biostatistics Core (P30 CA008748).
Paper previously presented at: Annual Meeting of the American Society of Neuroradiology, May 18–23, 2013; San Diego, California.
REFERENCES
- 1. Wen PY, Macdonald DR, Reardon DA, et al. Updated response assessment criteria for high-grade gliomas: response assessment in neuro-oncology working group. J Clin Oncol 2010;28:1963–72 [DOI] [PubMed] [Google Scholar]
- 2. Hygino da Cruz LC Jr, Rodriguez I, Domingues RC, et al. Pseudoprogression and pseudoresponse: imaging challenges in the assessment of posttreatment glioma. AJNR Am J Neuroradiol 2011;32:1978–85 [DOI] [PMC free article] [PubMed] [Google Scholar]
- 3. Brandes AA, Franceschi E, Tosoni A, et al. MGMT promoter methylation status can predict the incidence and outcome of pseudoprogression after concomitant radiochemotherapy in newly diagnosed glioblastoma patients. J Clin Oncol 2008;26:2192–97 [DOI] [PubMed] [Google Scholar]
- 4. Hopewell JW, Calvo W, Jaenke R, et al. Microvasculature and radiation damage. Recent Results Cancer Res 1993;130:1–16 [DOI] [PubMed] [Google Scholar]
- 5. Sugahara T, Korogi Y, Kochi M, et al. Correlation of MR imaging-determined cerebral blood volume maps with histologic and angiographic determination of vascularity of gliomas. AJR Am J Roentgenol 1998;171:1479–86 [DOI] [PubMed] [Google Scholar]
- 6. Oh BC, Pagnini PG, Wang MY, et al. Stereotactic radiosurgery: adjacent tissue injury and response after high-dose single fraction radiation. Part I. Histology, imaging, and molecular events. Neurosurgery 2007;60:31–44; discussion 44–45 [DOI] [PubMed] [Google Scholar]
- 7. Wesseling P, Ruiter DJ, Burger PC. Angiogenesis in brain tumors; pathobiological and clinical aspects. J Neurooncol 1997;32:253–65 [DOI] [PubMed] [Google Scholar]
- 8. Brandsma D, van den Bent MJ. Pseudoprogression and pseudoresponse in the treatment of gliomas. Curr Opin Neurol 2009;22:633–38 [DOI] [PubMed] [Google Scholar]
- 9. Young RJ, Gupta A, Shah AD, et al. MRI perfusion in determining pseudoprogression in patients with glioblastoma. Clin Imaging 2013;37:41–49 [DOI] [PMC free article] [PubMed] [Google Scholar]
- 10. Young RJ, Gupta A, Shah AD, et al. Potential utility of conventional MRI signs in diagnosing pseudoprogression in glioblastoma. Neurology 2011;76:1918–24 [DOI] [PMC free article] [PubMed] [Google Scholar]
- 11. Brandsma D, Stalpers L, Taal W, et al. Clinical features, mechanisms, and management of pseudoprogression in malignant gliomas. Lancet Oncol 2008;9:453–61 [DOI] [PubMed] [Google Scholar]
- 12. Hein PA, Eskey CJ, Dunn JF, et al. Diffusion-weighted imaging in the follow-up of treated high-grade gliomas: tumor recurrence versus radiation injury. AJNR Am J Neuroradiol 2004;25:201–09 [PMC free article] [PubMed] [Google Scholar]
- 13. Mangla R, Kolar B, Zhu T, et al. Percentage signal recovery derived from MR dynamic susceptibility contrast imaging is useful to differentiate common enhancing malignant lesions of the brain. AJNR Am J Neuroradiol 2011;32:1004–10 [DOI] [PMC free article] [PubMed] [Google Scholar]
- 14. Roa W, Brasher PM, Bauman G, et al. Abbreviated course of radiation therapy in older patients with glioblastoma multiforme: a prospective randomized clinical trial. J Clin Oncol 2004;22:1583–88 [DOI] [PubMed] [Google Scholar]
- 15. Clarke JL, Iwamoto FM, Sul J, et al. Randomized phase II trial of chemoradiotherapy followed by either dose-dense or metronomic temozolomide for newly diagnosed glioblastoma. J Clin Oncol 2009;27:3861–67 [DOI] [PMC free article] [PubMed] [Google Scholar]
- 16. Cha S, Knopp EA, Johnson G, et al. Intracranial mass lesions: dynamic contrast-enhanced susceptibility-weighted echo-planar perfusion MR imaging. Radiology 2002;223:11–29 [DOI] [PubMed] [Google Scholar]
- 17. Wetzel SG, Cha S, Johnson G, et al. Relative cerebral blood volume measurements in intracranial mass lesions: interobserver and intraobserver reproducibility study. Radiology 2002;224:797–803 [DOI] [PubMed] [Google Scholar]
- 18. Young R, Babb J, Law M, et al. Comparison of region-of-interest analysis with three different histogram analysis methods in the determination of perfusion metrics in patients with brain gliomas. J Magn Reson Imaging 2007;26:1053–63 [DOI] [PubMed] [Google Scholar]
- 19. Rosen BR, Belliveau JW, Vevea JM, et al. Perfusion imaging with NMR contrast agents. Magn Reson Med 1990;14:249–65 [DOI] [PubMed] [Google Scholar]
- 20. Barajas RF, Chang JS, Sneed PK, et al. Distinguishing recurrent intra-axial metastatic tumor from radiation necrosis following gamma knife radiosurgery using dynamic susceptibility-weighted contrast-enhanced perfusion MR imaging. AJNR Am J Neuroradiol 2009;30:367–72 [DOI] [PMC free article] [PubMed] [Google Scholar]
- 21. Law M, Young RJ, Babb JS, et al. Gliomas: predicting time to progression or survival with cerebral blood volume measurements at dynamic susceptibility-weighted contrast-enhanced perfusion MR imaging. Radiology 2008;247:490–98 [DOI] [PMC free article] [PubMed] [Google Scholar]
- 22. Al-Okaili RN, Krejza J, Woo JH, et al. Intraaxial brain masses: MR imaging-based diagnostic strategy—initial experience. Radiology 2007;243:539–50 [DOI] [PubMed] [Google Scholar]
- 23. Asao C, Korogi Y, Kitajima M, et al. Diffusion-weighted imaging of radiation-induced brain injury for differentiation from tumor recurrence. AJNR Am J Neuroradiol 2005;26:1455–60 [PMC free article] [PubMed] [Google Scholar]
- 24. Chu HH, Choi SH, Ryoo I, et al. Differentiation of true progression from pseudoprogression in glioblastoma treated with radiation therapy and concomitant temozolomide: comparison study of standard and high-b-value diffusion-weighted imaging. Radiology 2013;29:831–40 [DOI] [PubMed] [Google Scholar]
- 25. Cha J, Kim ST, Kim HJ, et al. Analysis of the layering pattern of the apparent diffusion coefficient (ADC) for differentiation of radiation necrosis from tumour progression. Eur Radiol 2013;23:879–86 [DOI] [PubMed] [Google Scholar]
- 26. Barajas RF Jr, Chang JS, Segal MR, et al. Differentiation of recurrent glioblastoma multiforme from radiation necrosis after external beam radiation therapy with dynamic susceptibility-weighted contrast-enhanced perfusion MR imaging. Radiology 2009;253:486–96 [DOI] [PMC free article] [PubMed] [Google Scholar]
- 27. Gasparetto EL, Pawlak MA, Patel SH, et al. Posttreatment recurrence of malignant brain neoplasm: accuracy of relative cerebral blood volume fraction in discriminating low from high malignant histologic volume fraction. Radiology 2009;250:887–96 [DOI] [PubMed] [Google Scholar]
- 28. Hu LS, Baxter LC, Smith KA, et al. Relative cerebral blood volume values to differentiate high-grade glioma recurrence from posttreatment radiation effect: direct correlation between image-guided tissue histopathology and localized dynamic susceptibility-weighted contrast-enhanced perfusion MR imaging measurements. AJNR Am J Neuroradiol 2009;30:552–58 [DOI] [PMC free article] [PubMed] [Google Scholar]
- 29. Fink JR, Carr RB, Matsusue E, et al. Comparison of 3 Tesla proton MR spectroscopy, MR perfusion and MR diffusion for distinguishing glioma recurrence from posttreatment effects. J Magn Reson Imaging 2012;35:56–63 [DOI] [PubMed] [Google Scholar]
- 30. Bobek-Billewicz B, Stasik-Pres G, Majchrzak H, et al. Differentiation between brain tumor recurrence and radiation injury using perfusion, diffusion-weighted imaging and MR spectroscopy. Folia Neuropathol 2010;48:81–92 [PubMed] [Google Scholar]
- 31. Chamberlain MC, Glantz MJ, Chalmers L, et al. Early necrosis following concurrent Temodar and radiotherapy in patients with glioblastoma. J Neurooncol 2007;82:81–83 [DOI] [PubMed] [Google Scholar]
- 32. Kong DS, Kim ST, Kim EH, et al. Diagnostic dilemma of pseudoprogression in the treatment of newly diagnosed glioblastomas: the role of assessing relative cerebral blood flow volume and oxygen-6-methylguanine-DNA methyltransferase promoter methylation status. AJNR Am J Neuroradiol 2011;32:382–87 [DOI] [PMC free article] [PubMed] [Google Scholar]
- 33. Suh CH, Kim HS, Choi YJ, et al. Prediction of pseudoprogression in patients with glioblastomas using the initial and final area under the curves ratio derived from dynamic contrast-enhanced T1-weighted perfusion MR imaging. AJNR Am J Neuroradiol 2013;34:2278–86 [DOI] [PMC free article] [PubMed] [Google Scholar]
- 34. Cha J, Kim ST, Kim HJ, et al. Differentiation of tumor progression from pseudoprogression in patients with posttreatment glioblastoma using multiparametric histogram analysis. AJNR Am J Neuroradiol 2014;35:1309–17 [DOI] [PMC free article] [PubMed] [Google Scholar]


