Abstract
Differential diagnosis of brainstem lesions, either isolated or in association with cerebellar and supra-tentorial lesions, can be challenging. Knowledge of the structural organization is crucial for the differential diagnosis and establishment of prognosis of pathologies with involvement of the brainstem. Familiarity with the location of the lesions in the brainstem is essential, especially in the pediatric population. Magnetic resonance imaging (MRI) is the most sensitive and specific imaging technique for diagnosing disorders of the posterior fossa and, particularly, the brainstem. High magnetic static field MRI allows detailed visualization of the morphology, signal intensity and metabolic content of the brainstem nuclei, together with visualization of the normal development and myelination. In this pictorial essay we review the brainstem pathology in pediatric patients and consider the MR imaging patterns that may help the radiologist to differentiate among vascular, toxico-metabolic, infective-inflammatory, degenerative and neoplastic processes. Helpful MR tips can guide the differential diagnosis: These include the location and morphology of lesions, the brainstem vascularization territories, gray and white matter distribution and tissue selective vulnerability.
Keywords: Brainstem, Pediatrics, Differential diagnosis, Neuroradiology, Magnetic resonance
Core tip: Magnetic resonance imaging differential diagnosis of brainstem lesions in children is depicted with an anatomical-based pictorial essay approach.
MAGNETIC RESONANCE IMAGING DIFFERENTIAL DIAGNOSIS OF BRAINSTEM LESIONS IN CHILDREN
The brainstem is the portion of the neuraxis that connects the brain to the spinal cord and cerebellum. It is cranio-caudally made up of diencephalon-midbrain, pons, and medulla. The gray matter of the brain stem is grouped in clusters, some of which form the nuclei of the cranial nerves[1]. The white matter is composed by the axons of descending and ascending pathways connecting the neurons of the cerebral cortex with the spinal cord, the cerebellum, and the brainstem gray matter nuclei. In the sagittal and axial view, the brainstem may be subdivided into 3 laminae, which extend throughout its entire length. From the dorsal to ventral side, these laminae are called tectum, tegmentum, and basis[1]. The tectum is the quadrigeminal plate in the midbrain, the superior medullary velum in the pons and the inferior medullary velum in the medulla oblongata. The basis is the ventral lamina and contains the pyramidal descending pathways (cortico-bulbar and cortico-spinal tracts); at the level of the pons it reaches its largest size due to the presence of numerous central nuclei (pontine nuclei) that receive numerous fibers projecting to the cerebellum. The tegmentum is placed between the tectum and basis and is divided into 2 layers: The dorsal one contains all the somato-motor and general sensory cranial nerve nuclei while the ventral one contains the supplementary motor nuclei (the substantia nigra and red nucleus in the midbrain and the inferior olivary nucleus in the medulla). The sensory tracts or lemniscus cross the rest of the tegmentum and are surrounded by the reticular formation[1]. Also, the pratique ductal gray matter, surrounding the Sylvian acqueduct and 4th ventricle needs to be mentioned. Thus, in respect to the other portions of the neuraxis, the gray and white matter of the brainstem are intermingled within each other making the topography of lesions challenging.
High static magnetic field magnetic resonance imaging (MRI) (> 1.5 Tesla) allows detailed visualization of the morphology, signal intensity and metabolic content of the brainstem nuclei, together with visualization of normal gray matter development and normal myelination of the white matter. The conventional MR imaging protocol in children should be adapted to the age of the patient and acquisition volumes should cover the whole brain down to the foramen magnum. T2 weighted sequences perform better than fluid attenuated inversion recovery (FLAIR) images for detecting posterior fossa T2 hyperintense lesions, with an increase of sensitivity using multiplanar images[2]. FLAIR sequences are usually not useful in less than 12 mo old children. Optimized conventional brain MR imaging protocols are described in detail in Table 1 (1.5 Tesla) and Table 2 (3.0 Tesla).
Table 1.
Optimized conventional imaging protocol at 1.5 Tesla (Magnetom Avanto B13, Siemens, Erlangen, Germany), configured with a 12 element designed head matrix coil
| 1.5 T | Plane | Seq. | TR (msec) | TE/TI (msec) | Flip angle | Slice (mm) | FOV | NEX | Matrix size | Scan time |
| Neonates | Axial1 | SE T1w | 450-650 | 12 | 90 | 3 | 200 | 3 | 192 × 256 | 4.30 |
| Axial | IR | 8400 | 60/350 | 180 | 3 | 230 | 2 | 176 × 512 | 4.30 | |
| Coronal Axial | TSE T2w | 8900 | 99 | 145 | 3 | 200 | 2 | 176 × 256 | 5.00 | |
| Axial2 | GRE T21w | 640 | 18 | 35 | 5 | 200 | 2 | 160 × 256 | 3.30 | |
| Axial DWI (b0 and b800) | EPI | 5700 | 139 | - | 5 | 200 | 4 | 96 × 128 | 1.00 | |
| Infants and adolescents | Axial | FLAIR T2w | 7000 | 110/2000 | 180 | 3 | 200 | 3 | 154 × 256 | 4.30 |
| Axial1 | SE T1w | 450-650 | 12 | 90 | 3 | 200 | 3 | 192 × 256 | 4.30 | |
| Axial | IR | 8400 | 60/350 | 180 | 3 | 230 | 2 | 176 × 512 | 4.30 | |
| Coronal | TSE T2w | 8900 | 99 | 145 | 3 | 200 | 2 | 176 × 256 | 5.00 | |
| Axial2 | GRE T21w | 640 | 18 | 35 | 5 | 200 | 2 | 160 × 256 | 3.30 | |
| Axial DWI (b0 and b1000) | EPI | 5700 | 139 | - | 5 | 200 | 4 | 96 × 128 | 1.00 |
SE: Spin echo; TSE: Turbo spin echo; IR: Inversion recovery; GRE: Gradient echo; FLAIR: Fluid attenuated inversion recovery; TR: Repetition time; TE: Echo time; TI: Inversion time; FOV: Field of view; DWI: Diffusion weighted imaging; EPI: Echo planar imaging. Scan Time is expressed in minutes.
: Contrast agent if necessary;
: Only if suspicion of bleeding.
Table 2.
Optimized conventional imaging protocol at 3.0 Tesla (Magnetom Skyra, Siemens, Erlangen, Germany), configured with a 64 element designed Head Matrix coil
| 3.0 T | Plane | Seq. | TR (msec) | TE/TI (msec) | Flip angle | Slice (mm) | FOV | NEX | Matrix size | Scan time |
| Neonates | Axial1 | TSE T1w | 550 | 6.7 | 138 | 2 | 180 | 4 | 256 × 80 | 3.07 |
| Axial | IR | 2006 | 12/500 | 150 | 2 | 180 | 2 | 256 × 80 | 4.48 | |
| Coronal Axial | TSE T2w | 10320 | 122 | 180 | 2 | 180 | 2 | 384 × 90 | 3.18 | |
| Axial2 | GRE T21w | 600 | 20 | 20 | 2 | 180 | 2 | 256 × 85 | 3.35 | |
| Axial3 | FLAIR | 9000 | 88/2500 | 150 | 2 | 180 | 1 | 320 × 70 | 3.56 | |
| Axial1 DWI (b0 and b800) | EPI | 8100 | 76 | - | 2 | 200 | 6 | 192 × 100 | 3.40 | |
| Infants and adolescents | Axial | TSE T1w | 600 | 6.4 | 150 | 3 | 200 | 3 | 256 × 256 | 1.36 |
| Axial2 | IR | 2500 | 11/500 | 150 | 3 | 220 | 1 | 320 × 80 | 3.27 | |
| Coronal and Axial | TSE T2w | 6380 | 108 | 150 | 3 | 220 | 1 | 384 × 75 | 1.29 | |
| Axial3 | GRE T21w | 630 | 20 | 20 | 4 | 220 | 1 | 320 × 75 | 2.33 | |
| Axial | FLAIR Fat Sat | 9000 | 85/2500 | 150 | 3 | 220 | 1 | 320 × 70 | 3.56 | |
| Axial1 (b0 and b1000) | EPI | 9000 | 98 | - | 3 | 220 | 3 | 192 × 100 | 3.00 |
TSE: Turbo spin echo; IR: Inversion recovery; GRE: Gradient echo; FLAIR: Fluid attenuated inversion recovery; TR: Repetition time; TE: Echo time; TI: Inversion time; FOV: Field of view; DWI: Diffusion weighted imaging; EPI: Echo planar imaging. Scan Time is expressed in minutes.
: Contrast agent if necessary;
: Only if suspicion of bleeding;
: Only if necessary.
A common feature of brainstem lesions is signal hyperintensity on turbo spin-echo T2-weighted (T2W) images; these lesions may be focal or diffuse and span from partial to complete involvement on the axial planes and across multiple levels cranio-caudally[3,4]. Especially in children, on the sole basis of signal intensity it is not possible to differentiate acute and chronic lesions neither lesions of different etiology. Moreover, in the case of chronic metabolic or inflammatory diseases, acute lesions may develop on a pattern of chronic damage and make the interpretation of findings challenging.
In this pictorial essay we review the brainstem pathology in pediatric patients and consider the MR imaging patterns that may help the radiologist to differentiate among vascular, toxic-metabolic, infective-inflammatory and neoplastic processes.
As it regards morphology, the presence of perilesional edema and T1 gadolinium enhancement suggest inflammatory/infective or neoplastic nature of the lesions, whereas a mass effect is a more typical feature of neoplastic lesions.
Helpful MR tips can guide the differential diagnosis: These include the knowledge of the brainstem vascularization territories, gray and white matter distribution and tissue selective vulnerability.
Brainstem vascularization territories: In the transverse plane, paramedian, short circumferential and long circumferential arteries originating from the vertebro-basilar arteries are known. Ischemic and septic emboli tend to pass along the arterial tree as far distally as their size permits in the terminal vascularisation of the brainstem[5]. The border zones of this arterial terminal vascularisation are located at the tegmentum, especially in medulla and pons, and have been proposed as the most vulnerable sites of hypoxic-ischemic injury in neonates[6,7].
Gray and white matter topography: Gray matter nuclei in the brainstem intermingle within the white matter pathways. However, most of the gray matter structures are deep and most of the white matter is peripheral in the brainstem due to the fibers packing of the pyramids anteriorly and of the superior, middle and inferior cerebellar peduncles laterally and posteriorly in the pons. Thus, white matter diseases are expected to preferentially involve peripheral zones in the brainstem without a cranio-caudal specificity.
Tissue selective vulnerability: Gray matter nuclei are known to be more vulnerable to metabolic insults because of higher metabolic demands as compared to the white matter. Since the gray matter nuclei, especially the reticular formation, extend from midbrain to medulla oblongata, metabolic diseases do not show cranio-caudal specificity.
Ischemic/vascular diseases
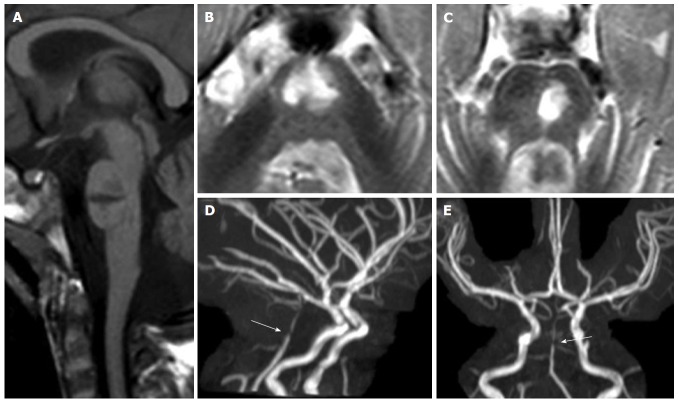
Acute arterial ischemic stroke involves the brainstem in about 5%-6% of children experiencing a stroke[8]. Emboli tend to pass along the arterial tree as far distally as their size permits in the terminal vascularisation of the brainstem and may lead to T2 hyperintense CSF-like infarcts (Figure 1). Large infarct size (≥ 50% of axial brainstem diameter) independently predicts poor outcome[8]. A reduction in apparent diffusion coefficient (ADC) values can be seen between 3 h and 15 d after onset of an arterial ischemic insult[9]. Due to the small size of the brainstem in children and to the known low sensitivity of echo planar imaging sequences in the posterior cranial fossa, false negatives are frequent[10]. Ischemic lesions, when detected, are usually small in size and associated with faint T2 or FLAIR hyperintense lesions. From 14 d on after the ischemic event, ADC hypointensity usually resolves, a phenomenon known as “pseudonormalization”[11]. In these cases, however, hyperintense signal is still observed on diffusion weighted images acquired at elevated b values (b800 or b1000). Nevertheless, the brainstem is usually considered an ischemia-resistant site of the central nervous system and a high-density vessel network of collateral perforators is considered to confer resistance to ischemic insults in this region[9].
Figure 1.
Pontine ischemic infarct. A 2-year-old girl shows a large median and left paramedian T1 hypointense (mid-sagittal image in panel A) and T2 hyperintense (axial images in panels B and C) lesion as lacunar sequela of an infarct in the territory of basilar artery perforators. Time of flight maximum intensity of projection images (panels D and E) show residual segmental sub-occlusive stenosis of the basilar artery (white arrow in D and E).
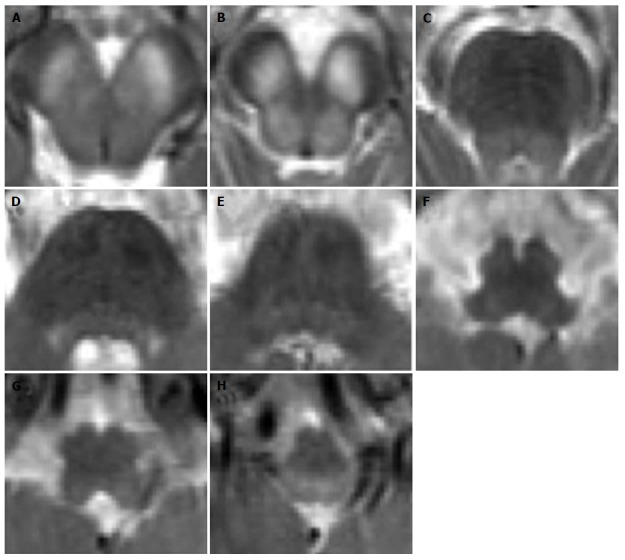
In the neonatal period, however, the development of this network may not be complete and children with hypoxic-ischemic encephalopathy in the perinatal period are susceptible to damage in the brainstem tegmentum[7]. Tegmental lesions are columnar-shaped on the coronal planes, bilateral and usually symmetrical, with specific involvement of caudal pons and medulla oblongata and are associated with oral motor dysfunction and gavage feeding[7] (Figure 2).
Figure 2.
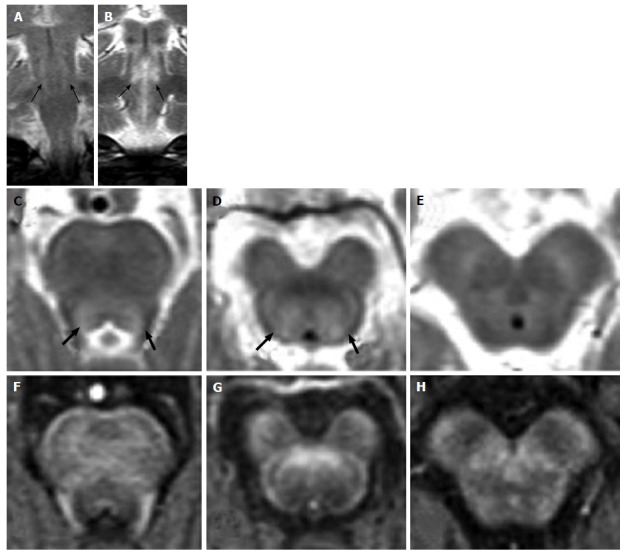
Hypoxic-ischemic tegmental watershed lesions. A 26-day-old neonate with history of hypoxic-ischemic injuried. Coronal (A and B) and axial (C-E) T2- weighted images show bilateral and symmetric hyperintensities (black arrows) at the level of the pontine tegmentum. T1-weighted axial images (F-H) show hypointense signal at the same sites.
Vascular malformations also are encountered in the brainstem of children. These include low flow malformations such as developmental venous anomaly, cavernous hemangioma and capillary telangiectasia and high flow malformations such as arterio-venous malformation. The MRI pattern is characteristic for each of these vascular entities and commonly the diagnosis is not challenging. The MR signal intensity and morphology at conventional imaging are identical to those observed in the adult population[3].
Toxic/metabolic diseases
Among syndromes related to genetic inborn errors of metabolism, mitochondrial encephalopathies are the most frequent affecting the brainstem. Mitochondrial diseases include a wide range of clinical syndromes associated with deficits of the oxidative phosphorylation, caused by partial or complete deficits of one or more enzymatic complexes of the respiratory chain[12]. Hereditary transmission may be autosomal recessive, autosomal dominant, X-linked or maternal[13]. The defect of the mitochondrial respiratory chain may, in fact, be caused by genetic mutations of either nuclear DNA or mitochondrial DNA[14-17]. Metabolic vulnerability is an important issue for the involvement of the brainstem in these diseases[18]: In fact, cells and tissues with high metabolic demand are more susceptible to specifically incur damage due to their inability or incomplete ability to reduce oxygen and finally produce ATP energy molecules[19]. The clinical presentation of these diseases is multi-systemic because different tissues and organs are involved. The diagnosis is challenging due to the extreme genetic and phenotypic heterogeneity.
Leigh’s syndrome may be consequent to mutations of mitochondrial DNA but most of the cases are due to nuclear genes mutations affecting the pyruvate dehydrogenase complex (Figure 3) or any of the I to IVrespiratory chain complexes (Figures 4-6). As it regards MRI patterns, the lesions in Leigh’s disease have been explored and examined for topography, size, nature and timing[20]. Due to their pathogenesis, the brainstem lesions are symmetrical, sometimes confined to the same specific location bilaterally. The substantia nigra, mainly the pars reticulata, the medullary and pontine tegmentum and the inferior colliculi are reported as the most frequent sites[20]. The inferior olivary nuclei are often involved, although this is not seen in children who die before 1 year of age[20]. More recently, bilateral hypertrophic olivary nucleus degeneration have been described in 40% of a series of patients with metabolic diseases, either associated or not with lesions of the central tegmental tract and dentate nuclei of the cerebellum[21], thus suggesting that inferior olivary nuclei are involved in Leigh disease both by primary metabolic vulnerability and/or secondary trans-synaptic neuronal degeneration. In Leigh’s syndromes, brainstem lesions may or may not be associated with bilateral and symmetrical lesions of the basal ganglia[22] and with diffuse supra-tentorial leukoencephalopathy[13]. In Leigh’s syndrome the loss of Purkinje cells and cerebellar atrophy seems to be secondary to excitotoxic damage. The loss of Purkinje cells and cerebellar involvement is, in fact, more characteristic of other mitochondrial encephalopathies such as myoclonic epilepsy with ragged-red fibers (MERRF), mitochondrial encephalopathy, lactic acidosis and stroke-like episodes (MELAS) and Kearns-Sayre syndrome[23]. In these syndromes also age at onset, clinical presentation and patterns of supratentorial involvement are helpful to differentiate it from Leigh’s disease. However, differential diagnosis may be challenging because brainstem lesions have been described in these other mitochondrial disease, such as the involvement of the periacqueduttal gray matter and the superior cerebellar peduncles in MERRF[24], the bilateral medullary tegmentum in Kearns-Sayre syndrome[25] or brainstem infarct-like lesions that do not respect vascular territories in MELAS[26]. One recently identified multisystem mitochondrial disease with specific involvement of specific white matter tracts is the Leukoencephalopathy with Brainstem and Spinal cord involvement and Lactate elevation that is consequent to mutations in the DARS2 gene encoding the mitochondrial aspartyl-tRNA synthetase[27,28]. In this syndrome, the MRI pattern of bilateral and symmetric involvement of white matter of medial lemniscus and pyramids, dorsal columns, superior and inferior cerebellar peduncles, cerebellar white matter, associated with elevated lactate in magnetic resonance spectroscopy is specific, diagnostic and helpful for genetic characterization[28].
Figure 3.
Leigh’s syndrome in pyruvate dehydrogenase complex deficiency. A 1-year-old boy with vomiting and dystonia. Coronal (A) and axial (B) T2-weighted images show bilateral and symmetric hyperintense signal at the basilar portion of midbrain (white arrows). T1-weighted images (C) show hypointense signal at the same sites (white arrows). Note the bilateral and symmetric hyperintense signal of the lentiform nuclei (black arrows in A).
Figure 4.
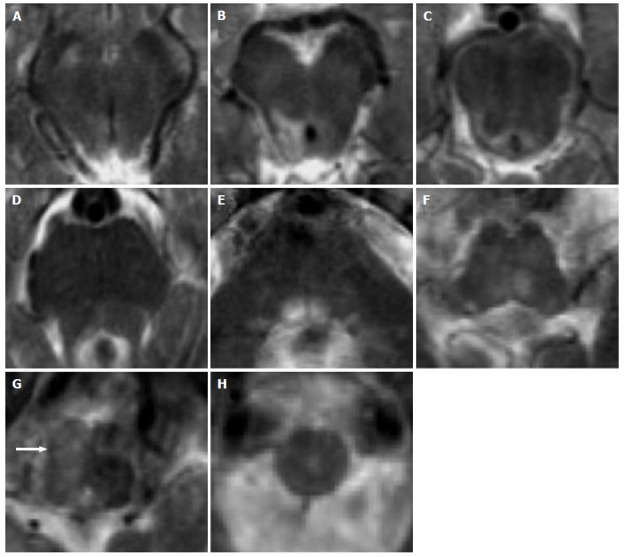
Leigh’s syndrome in complex I deficiency. A 7-year-old girl with vomiting and respiratory distress. Axial T2-weighted images show multiple focal hyperintense lesions, involving midbrain, pons and medulla, mostly sparing the peripheral zone of the brainstem. A diffuse T2 hyperintensity and engulfement of the right basilar portion of the medulla is seen in G (white arrow): Differential diagnosis includes primary lesion and unilateral hypertrophic olivary degeneration.
Figure 6.
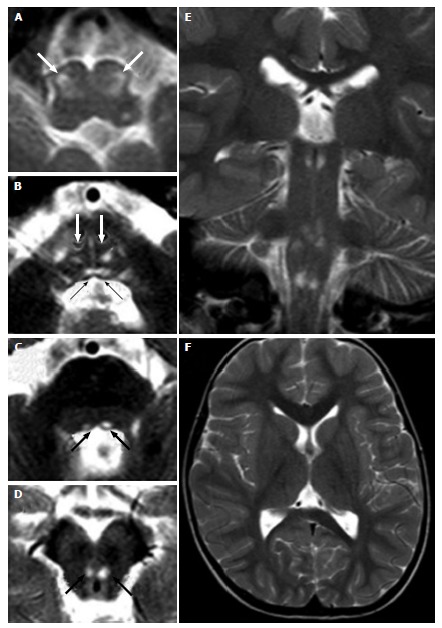
Leigh’s syndrome in complex IV deficiency. A 3-year-old male (heterozygous mutation of the SURF1 gene, responsible for assembly of the complex IV) with convergent strabism and ataxia. Axial (A-D, F) and coronal (E) T2 weighted images show hyperintense lesions at the brainstem. Bilateral and symmetric lesions involve inferior olivary nuclei (white arrows in A), bilateral medial longitudinal fasciculus (black arrows in B) and medial lemniscus (white arrows in B) in the caudal pons (B), and the medial longitudinal fasciculus in the cranial pons (black arrows in C) and midbrain (black arrows in D).
Figure 5.
Leigh’s syndrome in complex II and III deficiency. A 8-year-old boy with respiratory distress and dysphagia. Axial T2-weighted images (A-H) show bilateral and symmetric T2 hyperintense lesions involving the basilar portion and the tegmentum of midbrain (A and B), pons (C-E) and medulla (F-H).
Among metabolic syndromes involving the brainstem, the central pontine myelinolysis, is the MRI feature of the osmotic demyelination syndrome, a metabolic syndrome occurring in patients who experience severe alterations of plasma osmolality or receive rapid correction of hyponatremia[29]. The T2 hyperintensity specifically involves the central pons with signal changes related to alteration of the integrity of the myelin sheaths but not of the axons. In some cases, a characteristic “trident shape” alteration may be seen with specific sparing of the cortico-spinal tracts and the ventro-lateral portions of the pons (Figure 7). The signal alteration may extend cranially to the midbrain and laterally to the middle cerebellar peduncles[29]. When extra-pontine myelinolisis is associated, bilateral and symmetric T2 hyperintensity of the basal ganglia is observed[22]. This condition is transient and, if the correct steady state of osmolality is established, the lesion tends to completely resolve.
Figure 7.
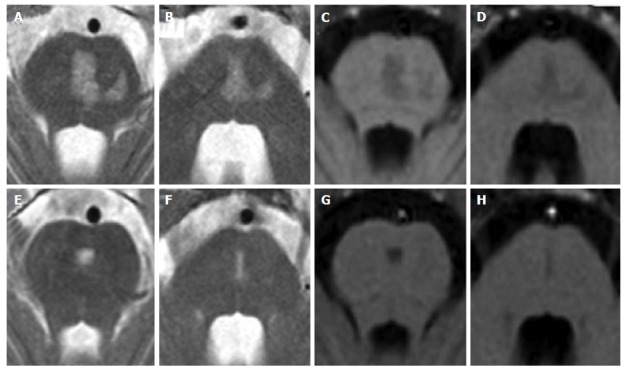
Central pontine myelinolysis. A 11-year-old boy with lymphoma after a rapid correction of hyponatremia. Axial T2-weighted (A and B) and T1 weighted (C and D) images show signal alterations of the central pons. Note the incomplete trident shape and the sparing of the peripheral zones of the pons. Two years later, MR images (E to H) show minimal residual pontine alterations with absence of symptoms.
Transient bilateral and symmetric T2 hyperintensities of the tegmental tracts, with restriction of diffusion of the tegmental tracts in the dorsal pons and midbrain, globi pallidi and thalami have been reported in 20%-30% of epileptic infants undergoing vigabatrin treatment[30,31]. Despite the underlying mechanisms of this condition are still under debate and investigation, the MRI alterations are greatest at 3 to 6 mo after the beginning of treatment and reversible in nature[30] (Figure 8).
Figure 8.
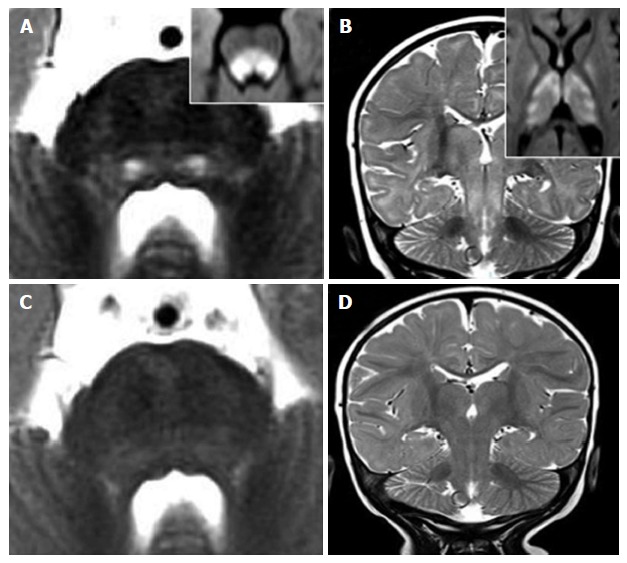
Vigabatrin-related transient magnetic resonance imaging abnormalities. A 8-mo-old infant shows symmetric and bilateral pontine lesions located at the central tegmental tracts (white arrows in panel A) and bilateral basal ganglia and midbrain (panel B) T2 hyperintensities. Diffusion weighted images showed net restriction of diffusion at the same sites (right upper inlets in panels A and B). The T2 signal alterations resolved after three months of vigabatrin withdrawal (panels C and D).
Infective/inflammatory diseases
The terms rhombo-encephalitis and brainstem encephalitis are interchangeably used and referred to the involvement of infra-tentorial structures (brainstem and cerebellum in the former and brainstem only in the latter) in the context of an inflammatory disease, either infectious, autoimmune or paraneoplastic.
Infectious rhomboencephalitis may be observed in the context of almost any viral or bacterial encephalitis[4] and is associated to supratentorial involvement in up to 50% of the cases[32]. The most frequent agents associated with involvement of the brainstem are Listeria monocytogenes and enterovirus 71, followed by herpes simplex viruses[32].
MRI findings in these pathological conditions are not specific; lesions are usually multiple, patchy and asymmetric hyperintense on T2 weighted images and are not typically associated with T1 contrast enhancement (Figure 9). Selective vulnerability of the substantia nigra has been shown for some specific viral encephalitides (St. Louis encephalitis and Japanese encephalitis)[33,34]. Patchy enhancement and abscess formation with ring enhancement after contrast agent injection can be observed at all levels of the brainstem in Listeria monocytogenes infection[35] and in the miliary pattern of tuberculosis[36] due to the formation of abscesses (Figure 10). Abscesses are mainly located at the pons and show a faint T2 hyperintensity due to vasogenic edema. The central portion of the lesions may be iso- or hyperintense on T2 weighted images[37]. In the case of tuberculomas, the signal of the central portion is hypointense on T2 weighted images[38]. Due to the hematogenous spread, abscesses usually show a distribution resembling the arterial embolic strokes. When there is a clinical suspicion of infection, diagnosis may be reached by measuring the levels of antibodies, by blood and CSF culture tests. For viral encephalitides, polymerase chain reaction allows to demonstrate the presence of viral DNA in the CSF. Brainstem lesions in the course of encephalitis may be associated with supra-tentorial alterations, in some cases with specific symmetric and bilateral involvement of the basal ganglia[22] (Figure 9).
Figure 9.
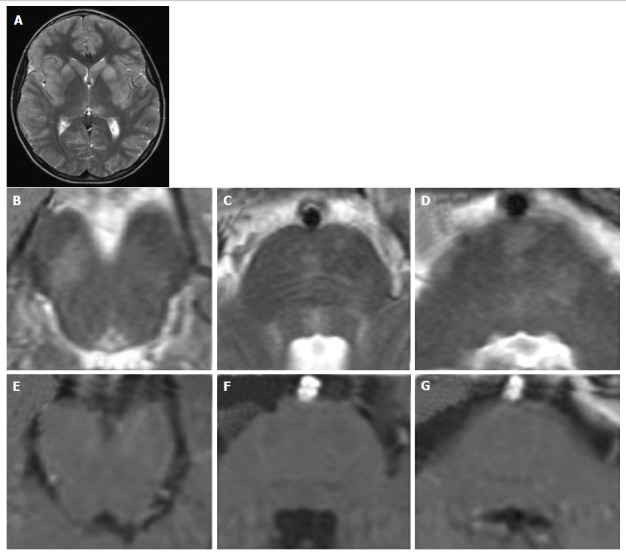
Viral encephalitis. A 10-year-old boy with fever, vomiting, abdominal pain, irritability. Coronal (A) and axial (B-D) T2 weighted images show multiple asymmetrical hyperintense areas at the level of the midbrain and pons. T1 weighted signal intensity of the lesions do not enhance after contrast agent administration (E-G). Note the typical MR pattern of viral encephalitis with a bilateral and symmetrical hyperintensity of the corpus striatum and of the left thalamus (A) at the supra-tentorial level. MR: Magnetic resonance.
Figure 10.
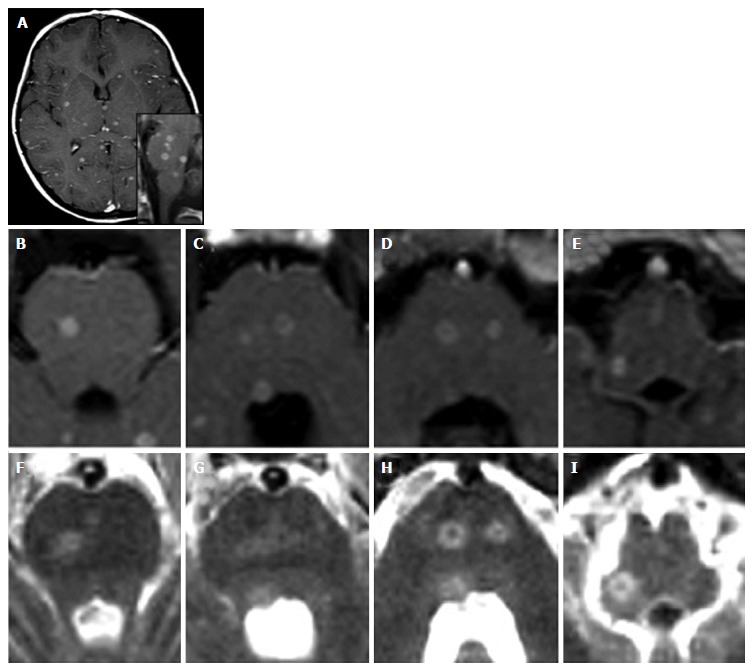
Miliary central nervous system tuberculosis. A 5-year-old girl with a 2 mo history of vomiting, cephalea and dysartria. Diagnosis of miliary tuberculosis. Contrast-enhanced axial (A-E) and sagittal (lower inlet in A) T1-weighted images show multiple abscesses (tuberculomas) both supra-tentorially and at the level of the brainstem. T2 weighted images (F-I) show hyperintense lesions at the same sites.
“Brainstem only” encephalitis also called Bickerstaff encephalitis seems to be of inflammatory non-infectious origin and specifically to be an autoimmune disease in most of the confirmed cases[39]. After the demonstration of the pathogenetic role of immunoglobulin G anti-ganglioside GQ1b antibodies, patients with a clinical presentation ranging from ophtalmoplegia and ataxia to altered consciousness and areflexia, previously described as Miller-Fisher syndrome or Bickerstaff encephalitis or Guillan-Barrè syndrome were classified as affected of an unique anti-GQ1b antibody syndrome[40-42], with variable central and peripheral nervous system involvement. In these syndromes, immune cross-reaction seems to be triggered by previous exposure to Campylobacter jejuni[42] and Mycoplasma pneumoniae[43]. Bickerstaff encephalitis may mimic a glioma: Metabolic profile at MR spectroscopy, MRI re-evaluation after corticosteroid treatment and CSF levels of anti-GQ1b autoantibodies guide the differential diagnosis (Figure 11).
Figure 11.
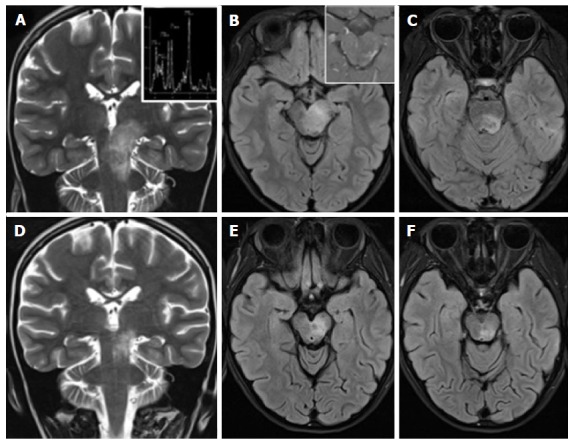
Anti-GQ1b antibody syndrome, Bickerstaff brainstem encephalitis type. A 8-year-old girl with ataxia, diplopia and drowsiness. A tumor-like left diencephalo-mesencephalic T2 hyperintense lesion (A-C), shows a normal metabolic profile at MR spectroscopy (upper inlet in A) and inhomogeneous peripheral and spotty enhancement after contrast agent administration (upper inlet in B). Net reduction in size of the lesion (D-F) two weeks after corticosteroid treatment and the identification of anti-GQ1b autoantibodies in the CSF guide towards the diagnosis of brainstem encephalitis. MR: Magnetic resonance. CSF: Cerebro-spinal fluid.
After common viral infections such as influenza A, influenza B, parainfluenza II, human herpes virus 6, coxsackie virus or enterovirus, a rapidly progressive encephalopathy known as acute necrotizing encephalopathy (ANE) may occur in otherwise healthy children[44]. ANE begins within the first four days after onset of viral symptoms as lethargy that, then, progresses to coma and seizures in 50% of the cases. Among survivors to the first episode, 50% will experience at least one relapse. Both familiar and sporadic forms have developed in patients harboring missense mutations of the nuclear pore gene Ran-binding 2[45] (Figure 12). ANE is considered different from Acute Disseminated Encephalomyelitis (ADEM). ADEM is, in most of the cases, a monophasic and multifocal inflammatory disease that has a typical temporal relationship with an infection or a vaccination occurred 1 to 3 wk before the clinical onset[46,47]. Brainstem lesions have a MR appearance indistinguishable from that of multiple sclerosis lesions; however, in patients with ADEM there is a higher frequency of midbrain lesions and lesions are more symmetrical and bilateral than in patients with multiple sclerosis[48]. The bilateral and symmetrical involvement of cerebellum, basal ganglia and thalami and relative sparing of corpus callosum supports the diagnosis of ADEM (Figure 13). As a further hint, at follow-up ADEM lesions do reduce in number, size and T2 hyperintensity, down to a complete resolution in about 50% of the cases[49].
Figure 12.
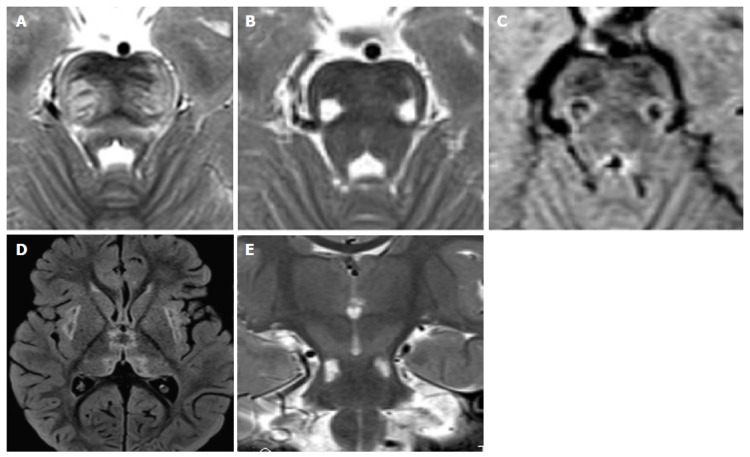
Recurrent acute necrotizing encephalopathy. A 2-year-old boy with previous influenza, hyperpyrexia, ataxia, episodes of prolonged stupor. A mutation in ran-binding protein 2 was confirmed. Characteristic distribution of lesions involve the pons, midbrain, thalamus and external capsule bilaterally (D). T2 hyperintense and T1 hypointense lesions of the pontine transverse fibers (A) and of the ventro-lateral portions of the pons-midbrain (B and C) are demonstrated.
Figure 13.

Acute disseminated encephalomyelitis. A 3-year-old boy developed ataxia, nystagmus and stupor one month after gastro-enteritis. T2 hyperintense areas of the pontine tegmentum and faint areas of the base and of the periphery of the brainstem are demontrated in panels A and B. Supratentorial bilateral and symmetric T2 hyperintensities involve basal ganglia, thalami and the subcortical white matter.
The brainstem is frequently involved in patients with multiple sclerosis and lesions have frequently a clinical correlate because of the scarce functional resilience of fiber tracts and gray matter nuclei in the brainstem[50]. MS lesions in the brainstem are more prevalent at the floor of the fourth ventricle and in the periphery of the brainstem, especially the pons[51] (Figure 14). The infratentorial site is considered specific for the diagnosis of multiple sclerosis, being one of the four sites necessary and or sufficient for the dissemination in space criteria (revised 2010 McDonald criteria)[52]. The incidence of multiple sclerosis peaks at 15-45 years and is rare in children[49]. Nevertheless, pediatric patients with an initial demyelinating event have more brainstem/cerebellum lesions than adults, especially among males[53,54], raising the idea of a preferential immune targeting of more mature myelin[55]. Among demyelinating diseases, it must be mentioned that brainstem involvement including the medullary area postrema may be observed in Neuromyelitis Optica spectrum disorders, both with or without serum aquaporin-4 immunoglobulin G autoantibodies[56].
Figure 14.
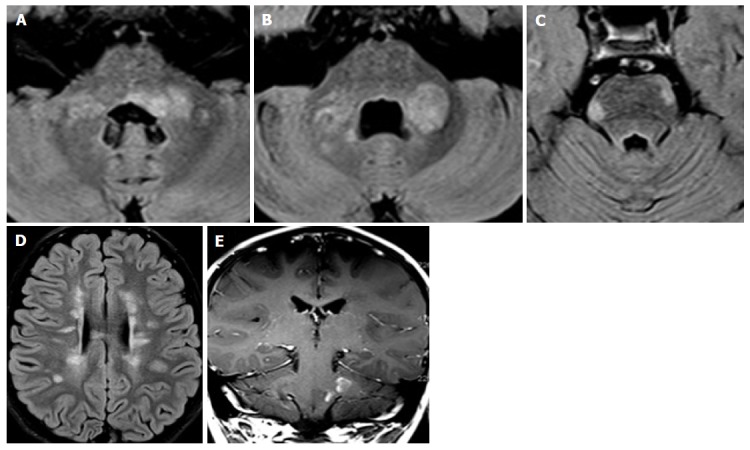
Pediatric onset multiple sclerosis. A 7-year-old boy with diplopia, ataxia and speech disorder. Peripheral and peri-ventricular multiple brainstem T2 hyperintense lesions are observed (A-C), with extension to the middle cerebral peduncles (A and B). Multiple bilateral periventricular ovoidal-shaped lesions are seen at supra-tentorial level (C). Two lesions of the left pons and left middle cerebral peduncle show enhancement after contrast agent administration (E).
Degenerative diseases
A rare autosomal-recessive neurodegenerative disorder caused by a combined deficiency of molybdenum-dependent enzymes is the Molybdenum cofactor deficiency. This condition is considered rare in prevalence but probably under-reported. This deficiency leads to an early-onset encephalopathy or to an atypical late onset syndrome with global developmental delay. The MR morphological and diffusion weighted imaging pattern in these patients resemble the damage observed after diffuse hypoxic-ischemic injury. However, a preferential involvement of the cerebral peduncles in the brainstem associated with globi pallidi and subthalamic regions may guide the diagnosis towards this condition that is confirmed by specific laboratory tests. Early diagnosis is crucial to start early supplementation and/or substitution therapies, thus preventing brain atrophy[57].
Hypertrophic olivary nucleus degeneration (HON) is recognized as a specific form of transynaptic degeneration that is associated with hypertrophy of the inferior olivary nucleus. The HON is a consequence of aspecific lesions in the dento-rubro-olivary pathway, a network connecting the dentate nucleus of the cerebellum to the red nucleus through the superior cerebellar peduncle, the red nucleus to the contralateral inferior olivary nucleus through the central tegmental tract and, in turn, the inferior olivary nucleus to the contralateral dentate nucleus[3]. Thus, any lesion affecting this pathway may trigger HON. Despite this condition has been considered rare in children, recent reports highlighted its significant prevalence in patients with metabolic diseases[21,58,59] and following surgery for posterior cranial fossa tumors[60]. MRI shows T2 hyperintensity with or without enlargement of the olivary nucleus, often bilateral and symmetric, starting from the first month after the acute event; then, it tends to resolve after 3-4 years[61].
Dilated Virchow-Robin spaces do not pose challenges for differential diagnosis as they develop along the perforator arteries in the ponto-mesencephalic tract between the cerebral peduncles and the substantia nigra and show CSF-like signal intensity on T1 and T2 weighted images[3]. Only sporadic cases are reported in the literature[62].
Benign/malignant masses
A T2 hyperintense brainstem lesion with mass effect on adjacent structures, surrounding the cysterns, fourth ventricle, sylvian acqueduct and/or cerebellum are the MR features of a brainstem glioma. The three most frequent groups of brainstem gliomas in children, based on anatomy and clinical behavior, are: Diffuse intrinsic pontine glioma (DIPG), exophytic medullary glioma and tectal glioma[63]. DIPG has the worst prognosis with an overall survival of about 1 year[64]. DIPG shows perilesional edema, absent or inhomogeneous contrast enhancement and mass effect[4]. Peak age is 5-10 years with the clinical triad of ataxia, long tract signs and cranial nerve deficits. Typically, the lesion involves totally or subtotally the brainstem in the axial plane, being the pons the most common location (Figure 15). In the midbrain and medulla focal gliomas are more common, being the tectal plate and the medullary tegmentum the epicenter of lesions respectively (Figure 16). Although absence of enhancement is the rule, in some cases inhomogeneous, spotty or peripheral, enhancement may be seen, especially in the cervico-medullary junction despite their histological nature of low-grade astrocytoma and indolent course[65] (Figure 16).
Figure 15.
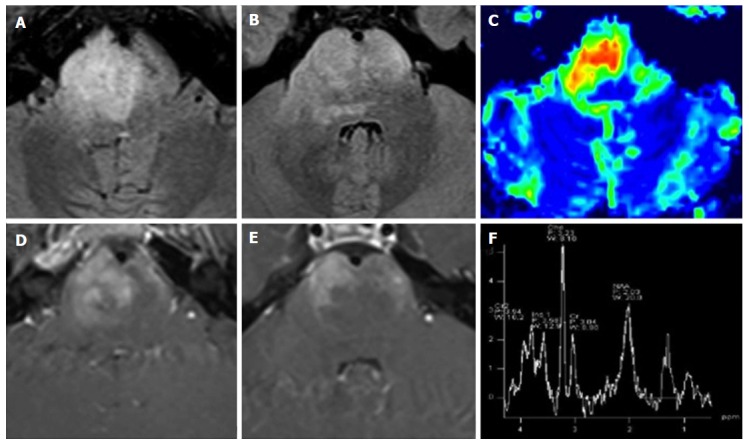
Diffuse intrinsic pontine glioma. A 15-year-old boy with sudden onset of diplopia and right VI cranial nerve paresis. A T2 hyperintense infiltrating mass occupies more than two-thirds of the pontine transverse area. Note enlargement of the ventral portion of the brainstem (A and B). As an atypical pattern, the mass lesion in this case shows inhomogeneous enhancement on post-contrast T1 weighted images (D and E). DSC Perfusion CBV maps demonstrate relative CBV approximately 4.5 times higher than normal appearing cerebellar deep white matter (C). 1H spectroscopy demonstrates significant reduction of the NAA/Ch ratio (F). CBV: Cerebral blood volume; NAA/Ch: N-acetyl-aspartate/choline; DSC Perfusion CBV maps: Dynamic susceptibility contrast enhanced perfusion cerebral blood volume maps.
Figure 16.
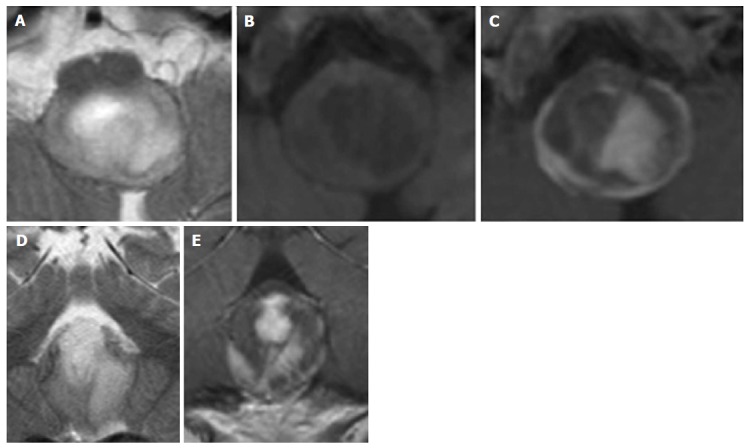
Pylocitic astrocytoma. A 2-year-old boy with vomiting, respiratory distress and a dorsal exophytic medullary glioma Axial (A) and Coronal (D) T2 weighted images show a solid-cystic mass with an epicenter at the level of the medulla oblongata. Axial unenhanced (B) and axial (C) and coronal (E) enhanced T1 weighted images show inhomogeneous contrast enhancement.
Children younger than 3 years old may present with solid primitive neuroectodermal tumors. These tumors are focal, exophytic in behavior, usually located in the pons, show a mild to moderate enhancement and are also associated with subarachnoid spread[66,67].
Brainstem tumors may develop in children with neurofibromatosis type 1[68] and are about 50% of extra-optic pathway tumors in these patients[69]. All levels of the brainstem may be involved including diffuse and focal tumors[68]. Astrocytoma is the most frequent tumor and the clinical behavior is less aggressive than the same tumors in children without NF1[70]. In these patients unidentified bright objects are frequently encountered (Figure 17). These are T2 hyperintense lesions[71] that remain stable over time or even disappear after 12 years of age. These lesions do not enhance, may be found at all levels of the brainstem, may be associated with similar lesions in the cerebellum and basal ganglia and have generally a favourable outcome (Figure 18).
Figure 17.
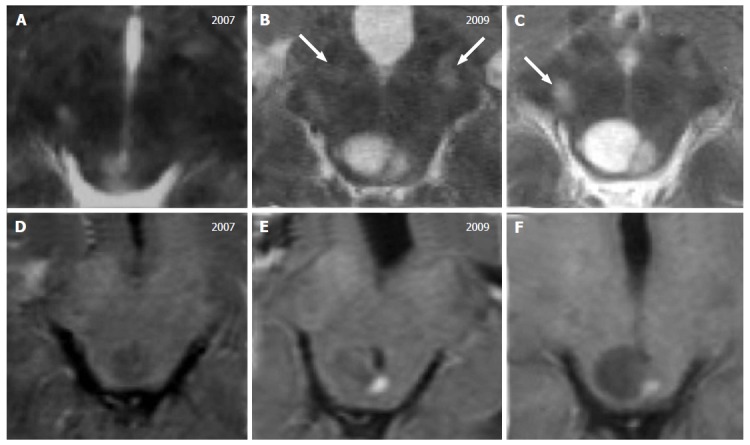
Tectal glioma in neurofibromatosis type 1. A 7-year-old boy with a diagnosis of Neurofibromatosis type 1. T2 weighted images (A-C) show a small area of hyperintense signal, increasing in size over time with a cystic component. Contrast enhanced T1-weighted images (D-F) show a mural nodule of enhancement 2 and 3 years after the initial diagnosis. Note the multiple focal hyperintense lesions located at the basilar portion of the midbrain (white arrows in B and C) that are stable over time, defined as typical unidentified bright objects, observed in these patients.
Figure 18.
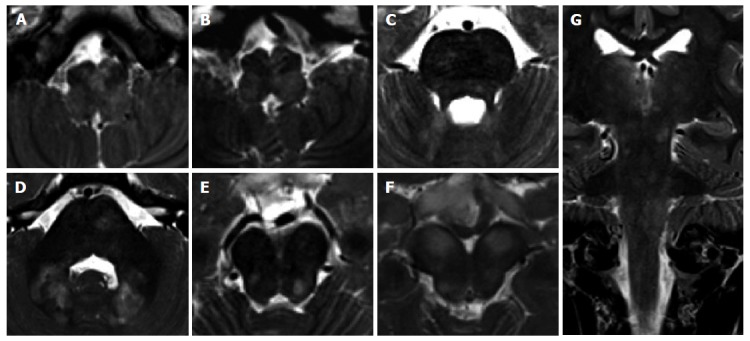
Unidentified bright objects in neurofibromatosis type 1. A 11-year-old girl with NF1. Multiple bilateral symmetric or asymmetric T2 hyperintense lesions, diffuse and confluent across the brainstem, in the cerebellar white matter and at supratentorial level may be encountered in these patients. These lesions do not enhance after contrast agent injection. Axial (A-F) and coronal (G) T2 weighted images of the medulla (A,B), pons (C,D) and midbrain (E,F) are presented. Coronal image (G) shows the involvement of infra- and supra-tentorial areas.
Intracranial lesions in the brainstem may develop in the course of Langerhans cell histiocytosis (LCH)[72,73]. LCH is a rare granulomatous disease of the monocyte-macrophage system and includes the Letterer-Siwe disease, Hand-Schüller-Christian disease and eosinophilic granuloma. The typical clinical presentation of LCH includes lytic cranio-facial bone lesions, hypothalamic-pituitary region involvement and diabetes insipidus. Intracranial lesions include mass lesions or symmetric white matter degenerative T2 hyperintensities and atrophy. Mass tumorous lesions, although rare, may develop in the brainstem as T2 hyper or hypointense and T1 iso or hypointense masses with contrast enhancement[73] (Figure 19). Non tumorous degenerative lesions are shown as symmetric white matter T2 hyperintensities with specific involvement of the pons [72-74] (Figure 20).
Figure 19.
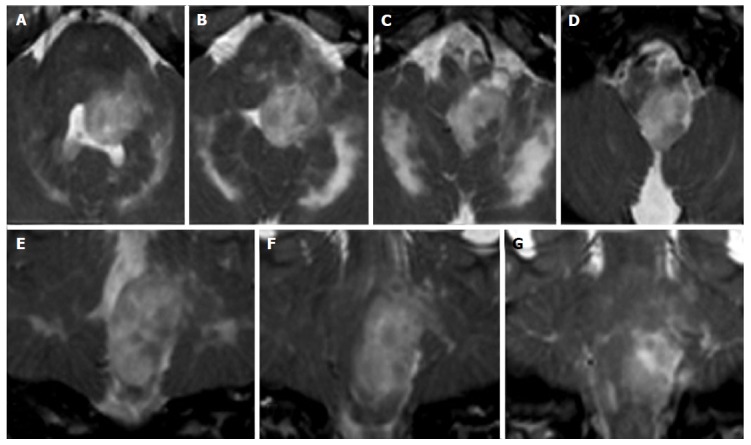
Isolated tumorous Langerhans cell histiocytosis. A posterior cranial fossa mass in a 5-year-old boy is observed. Axial (A-D) and coronal (E-G) T2 weighted images show a inhomogeneous solid mass, with an epicenter apparently located in the left postero-lateral portion of the pons. Histology of a surgical specimen led to the definite diagnosis of histiocytosis.
Figure 20.
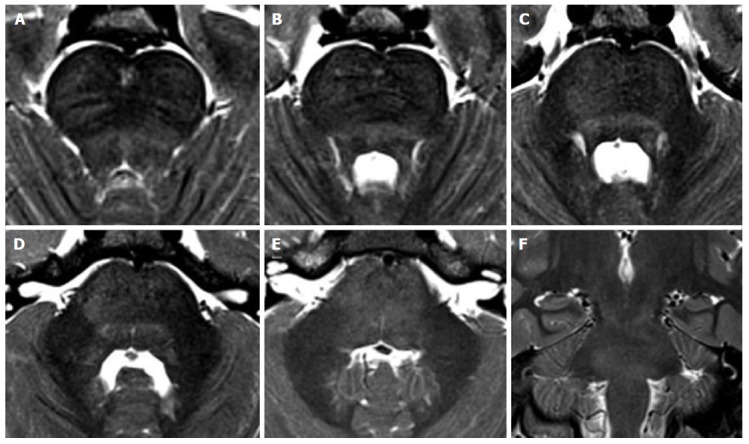
Non-tumorous degenerative T2 hyperintensities in Langerhans cell histiocytosis. A 8-year-old boy with the diagnosis of Langerhans cell histiocytosis who developed ataxia. Diffuse T2 hyperintensity of the brainstem white matter is seen on axial (A-E) and coronal (F) images, with partial involvement of cerebellar peduncles.
Among brainstem masses it is worth mentioning epidermoid/dermoid tumors. These are focal lesions without perilesional edema, without enhancement and with restricted diffusion that, although rare in children, originate from remnants of embryonic ectodermal tissue, have their epicenter extra-axially in the pontine cystern but can invade the pons through Virchow-Robin spaces[75].
CONCLUSION
Brainstem lesions, either isolated or associated with supra-tentorial lesions include a wide range of differential diagnoses, in some cases with poor outcome. Small size, a less remarkable distinction between grey and white matter structures and intrinsic limitations of advanced techniques, such as perfusion weighted imaging and spectroscopy, often challenge the interpretation of brainstem MRI findings. Topography and signal intensity of lesions is at times diagnostic; clinical, epidemiological and laboratory tests are often essential to guide the differential diagnosis.
Footnotes
Conflict-of-interest statement: The authors declare no conflict of interest.
Open-Access: This article is an open-access article which was selected by an in-house editor and fully peer-reviewed by external reviewers. It is distributed in accordance with the Creative Commons Attribution Non Commercial (CC BY-NC 4.0) license, which permits others to distribute, remix, adapt, build upon this work non-commercially, and license their derivative works on different terms, provided the original work is properly cited and the use is non-commercial. See: http://creativecommons.org/licenses/by-nc/4.0/
Peer-review started: September 1, 2015
First decision: September 29, 2015
Article in press: December 11, 2015
P- Reviewer: Chu JP, Li YZ, Shen J
S- Editor: Qiu S L- Editor: A E- Editor: Li D
References
- 1.Angeles Fernández-Gil M, Palacios-Bote R, Leo-Barahona M, Mora-Encinas JP. Anatomy of the brainstem: a gaze into the stem of life. Semin Ultrasound CT MR. 2010;31:196–219. doi: 10.1053/j.sult.2010.03.006. [DOI] [PubMed] [Google Scholar]
- 2.Bastianello S, Bozzao A, Paolillo A, Giugni E, Gasperini C, Koudriavtseva T, Millefiorini E, Horsfield MA, Colonnese C, Toni D, et al. Fast spin-echo and fast fluid-attenuated inversion-recovery versus conventional spin-echo sequences for MR quantification of multiple sclerosis lesions. AJNR Am J Neuroradiol. 1997;18:699–704. [PMC free article] [PubMed] [Google Scholar]
- 3.Guzmán-De-Villoria JA, Fernández-García P, Ferreiro-Argüelles C. Differential diagnosis of T2 hyperintense brainstem lesions: Part 1. Focal lesions. Semin Ultrasound CT MR. 2010;31:246–259. doi: 10.1053/j.sult.2010.03.001. [DOI] [PubMed] [Google Scholar]
- 4.Guzmán-De-Villoria JA, Ferreiro-Argüelles C, Fernández-García P. Differential diagnosis of T2 hyperintense brainstem lesions: Part 2. Diffuse lesions. Semin Ultrasound CT MR. 2010;31:260–274. doi: 10.1053/j.sult.2010.03.002. [DOI] [PubMed] [Google Scholar]
- 5.Savoiardo M, Bracchi M, Passerini A, Visciani A. The vascular territories in the cerebellum and brainstem: CT and MR study. AJNR Am J Neuroradiol. 1987;8:199–209. [PMC free article] [PubMed] [Google Scholar]
- 6.Leong S, Ashwell KW. Is there a zone of vascular vulnerability in the fetal brain stem. Neurotoxicol Teratol. 1997;19:265–275. doi: 10.1016/s0892-0362(97)00020-2. [DOI] [PubMed] [Google Scholar]
- 7.Quattrocchi CC, Longo D, Delfino LN, Cilio MR, Piersigilli F, Capua MD, Seganti G, Danhaive O, Fariello G. Dorsal brain stem syndrome: MR imaging location of brain stem tegmental lesions in neonates with oral motor dysfunction. AJNR Am J Neuroradiol. 2010;31:1438–1442. doi: 10.3174/ajnr.A2103. [DOI] [PMC free article] [PubMed] [Google Scholar]
- 8.Lagman-Bartolome AM, Pontigon AM, Moharir M, MacGregor DL, Askalan R, Yau I, Deveber G. Basilar artery strokes in children: good outcomes with conservative medical treatment. Dev Med Child Neurol. 2013;55:434–439. doi: 10.1111/dmcn.12092. [DOI] [PubMed] [Google Scholar]
- 9.Toi H, Uno M, Harada M, Yoneda K, Morita N, Matsubara S, Satoh K, Nagahiro S. Diagnosis of acute brain-stem infarcts using diffusion-weighed MRI. Neuroradiology. 2003;45:352–356. doi: 10.1007/s00234-002-0897-5. [DOI] [PubMed] [Google Scholar]
- 10.Oppenheim C, Stanescu R, Dormont D, Crozier S, Marro B, Samson Y, Rancurel G, Marsault C. False-negative diffusion-weighted MR findings in acute ischemic stroke. AJNR Am J Neuroradiol. 2000;21:1434–1440. [PMC free article] [PubMed] [Google Scholar]
- 11.Huang BY, Castillo M. Hypoxic-ischemic brain injury: imaging findings from birth to adulthood. Radiographics. 2008;28:417–439; quiz 617. doi: 10.1148/rg.282075066. [DOI] [PubMed] [Google Scholar]
- 12.Uziel G, Ghezzi D, Zeviani M. Infantile mitochondrial encephalopathy. Semin Fetal Neonatal Med. 2011;16:205–215. doi: 10.1016/j.siny.2011.04.003. [DOI] [PubMed] [Google Scholar]
- 13.Wong LJ. Mitochondrial syndromes with leukoencephalopathies. Semin Neurol. 2012;32:55–61. doi: 10.1055/s-0032-1306387. [DOI] [PubMed] [Google Scholar]
- 14.Nishino I, Spinazzola A, Hirano M. Thymidine phosphorylase gene mutations in MNGIE, a human mitochondrial disorder. Science. 1999;283:689–692. doi: 10.1126/science.283.5402.689. [DOI] [PubMed] [Google Scholar]
- 15.Tang S, Wang J, Lee NC, Milone M, Halberg MC, Schmitt ES, Craigen WJ, Zhang W, Wong LJ. Mitochondrial DNA polymerase gamma mutations: an ever expanding molecular and clinical spectrum. J Med Genet. 2011;48:669–681. doi: 10.1136/jmedgenet-2011-100222. [DOI] [PubMed] [Google Scholar]
- 16.Scheper GC, van der Klok T, van Andel RJ, van Berkel CG, Sissler M, Smet J, Muravina TI, Serkov SV, Uziel G, Bugiani M, et al. Mitochondrial aspartyl-tRNA synthetase deficiency causes leukoencephalopathy with brain stem and spinal cord involvement and lactate elevation. Nat Genet. 2007;39:534–539. doi: 10.1038/ng2013. [DOI] [PubMed] [Google Scholar]
- 17.Uluc K, Baskan O, Yildirim KA, Ozsahin S, Koseoglu M, Isak B, Scheper GC, Gunal DI, van der Knaap MS. Leukoencephalopathy with brain stem and spinal cord involvement and high lactate: a genetically proven case with distinct MRI findings. J Neurol Sci. 2008;273:118–122. doi: 10.1016/j.jns.2008.06.002. [DOI] [PubMed] [Google Scholar]
- 18.Cavanagh JB. Selective vulnerability in acute energy deprivation syndromes. Neuropathol Appl Neurobiol. 1993;19:461–470. doi: 10.1111/j.1365-2990.1993.tb00474.x. [DOI] [PubMed] [Google Scholar]
- 19.Nagai T, Goto Y, Matsuoka T, Sakuta R, Naito E, Kuroda Y, Nonaka I. Leigh encephalopathy: histologic and biochemical analyses of muscle biopsies. Pediatr Neurol. 1992;8:328–332. doi: 10.1016/0887-8994(92)90084-c. [DOI] [PubMed] [Google Scholar]
- 20.Cavanagh JB, Harding BN. Pathogenic factors underlying the lesions in Leigh’s disease. Tissue responses to cellular energy deprivation and their clinico-pathological consequences. Brain. 1994;117(Pt 6):1357–1376. doi: 10.1093/brain/117.6.1357. [DOI] [PubMed] [Google Scholar]
- 21.Bindu PS, Taly AB, Sonam K, Govindaraju C, Arvinda HR, Gayathri N, Bharath MM, Ranjith D, Nagappa M, Sinha S, et al. Bilateral hypertrophic olivary nucleus degeneration on magnetic resonance imaging in children with Leigh and Leigh-like syndrome. Br J Radiol. 2014;87:20130478. doi: 10.1259/bjr.20130478. [DOI] [PMC free article] [PubMed] [Google Scholar]
- 22.Quattrocchi CC, Longo D, Delfino LN, Errante Y, Aiello C, Fariello G, Bernardi B. MR differential diagnosis of acute deep grey matter pathology in paediatric patients. Pediatr Radiol. 2013;43:743–761. doi: 10.1007/s00247-012-2491-2. [DOI] [PubMed] [Google Scholar]
- 23.Sparaco M, Bonilla E, DiMauro S, Powers JM. Neuropathology of mitochondrial encephalomyopathies due to mitochondrial DNA defects. J Neuropathol Exp Neurol. 1993;52:1–10. doi: 10.1097/00005072-199301000-00001. [DOI] [PubMed] [Google Scholar]
- 24.Ito S, Shirai W, Asahina M, Hattori T. Clinical and brain MR imaging features focusing on the brain stem and cerebellum in patients with myoclonic epilepsy with ragged-red fibers due to mitochondrial A8344G mutation. AJNR Am J Neuroradiol. 2008;29:392–395. doi: 10.3174/ajnr.A0865. [DOI] [PMC free article] [PubMed] [Google Scholar]
- 25.Valanne L, Ketonen L, Majander A, Suomalainen A, Pihko H. Neuroradiologic findings in children with mitochondrial disorders. AJNR Am J Neuroradiol. 1998;19:369–377. [PMC free article] [PubMed] [Google Scholar]
- 26.Castillo M, Kwock L, Green C. MELAS syndrome: imaging and proton MR spectroscopic findings. AJNR Am J Neuroradiol. 1995;16:233–239. [PMC free article] [PubMed] [Google Scholar]
- 27.Yamashita S, Miyake N, Matsumoto N, Osaka H, Iai M, Aida N, Tanaka Y. Neuropathology of leukoencephalopathy with brainstem and spinal cord involvement and high lactate caused by a homozygous mutation of DARS2. Brain Dev. 2013;35:312–316. doi: 10.1016/j.braindev.2012.05.007. [DOI] [PubMed] [Google Scholar]
- 28.Schicks J, Schöls L, van der Knaap MS, Synofzik M. Teaching NeuroImages: MRI guides genetics: leukoencephalopathy with brainstem and spinal cord involvement (LBSL) Neurology. 2013;80:e176–e177. doi: 10.1212/WNL.0b013e31828cf846. [DOI] [PubMed] [Google Scholar]
- 29.Alleman AM. Osmotic demyelination syndrome: central pontine myelinolysis and extrapontine myelinolysis. Semin Ultrasound CT MR. 2014;35:153–159. doi: 10.1053/j.sult.2013.09.009. [DOI] [PubMed] [Google Scholar]
- 30.Milh M, Villeneuve N, Chapon F, Pineau S, Lamoureux S, Livet MO, Bartoli C, Hugonenq C, Mancini J, Chabrol B, et al. Transient brain magnetic resonance imaging hyperintensity in basal ganglia and brain stem of epileptic infants treated with vigabatrin. J Child Neurol. 2009;24:305–315. doi: 10.1177/0883073808324219. [DOI] [PubMed] [Google Scholar]
- 31.Dracopoulos A, Widjaja E, Raybaud C, Westall CA, Snead OC. Vigabatrin-associated reversible MRI signal changes in patients with infantile spasms. Epilepsia. 2010;51:1297–1304. doi: 10.1111/j.1528-1167.2010.02564.x. [DOI] [PubMed] [Google Scholar]
- 32.Jubelt B, Mihai C, Li TM, Veerapaneni P. Rhombencephalitis / brainstem encephalitis. Curr Neurol Neurosci Rep. 2011;11:543–552. doi: 10.1007/s11910-011-0228-5. [DOI] [PubMed] [Google Scholar]
- 33.Wasay M, Diaz-Arrastia R, Suss RA, Kojan S, Haq A, Burns D, Van Ness P. St Louis encephalitis: a review of 11 cases in a 1995 Dallas, Tex, epidemic. Arch Neurol. 2000;57:114–118. doi: 10.1001/archneur.57.1.114. [DOI] [PubMed] [Google Scholar]
- 34.Kalita J, Misra UK. The substantia nigra is also involved in Japanese encephalitis. AJNR Am J Neuroradiol. 2000;21:1978–1980. [PMC free article] [PubMed] [Google Scholar]
- 35.Reynaud L, Graf M, Gentile I, Cerini R, Ciampi R, Noce S, Borrelli F, Viola C, Gentile F, Briganti F, et al. A rare case of brainstem encephalitis by Listeria monocytogenes with isolated mesencephalic localization. Case report and review. Diagn Microbiol Infect Dis. 2007;58:121–123. doi: 10.1016/j.diagmicrobio.2006.11.001. [DOI] [PubMed] [Google Scholar]
- 36.Nogueira Delfino L, Fariello G, Lancella L, Marabotto C, Menchini L, Devito R, Errante Y, Quattrocchi CC, Longo D. Central nervous system tuberculosis in non-HIV-positive children: a single-center, 6 year experience. Radiol Med. 2012;117:669–678. doi: 10.1007/s11547-011-0743-0. [DOI] [PubMed] [Google Scholar]
- 37.Ramalho J, Castillo M. Case of the season: brainstem abscess. Semin Roentgenol. 2008;43:168–170. doi: 10.1053/j.ro.2008.03.001. [DOI] [PubMed] [Google Scholar]
- 38.Akhaddar A, Mahi M, Harket A, Elmostarchid B, Belhachemi A, Elasri A, Gazzaz M, Boucetta M. Brainstem tuberculoma in a postpartum patient. J Neuroradiol. 2007;34:345–346. doi: 10.1016/j.neurad.2007.09.001. [DOI] [PubMed] [Google Scholar]
- 39.Tan IL, Mowry EM, Steele SU, Pardo CA, McArthur JC, Nath A, Venkatesan A. Brainstem encephalitis: etiologies, treatment, and predictors of outcome. J Neurol. 2013;260:2312–2319. doi: 10.1007/s00415-013-6986-z. [DOI] [PMC free article] [PubMed] [Google Scholar]
- 40.Odaka M, Yuki N, Hirata K. Anti-GQ1b IgG antibody syndrome: clinical and immunological range. J Neurol Neurosurg Psychiatry. 2001;70:50–55. doi: 10.1136/jnnp.70.1.50. [DOI] [PMC free article] [PubMed] [Google Scholar]
- 41.Shahrizaila N, Yuki N. Bickerstaff brainstem encephalitis and Fisher syndrome: anti-GQ1b antibody syndrome. J Neurol Neurosurg Psychiatry. 2013;84:576–583. doi: 10.1136/jnnp-2012-302824. [DOI] [PubMed] [Google Scholar]
- 42.Ito M, Kuwabara S, Odaka M, Misawa S, Koga M, Hirata K, Yuki N. Bickerstaff’s brainstem encephalitis and Fisher syndrome form a continuous spectrum: clinical analysis of 581 cases. J Neurol. 2008;255:674–682. doi: 10.1007/s00415-008-0775-0. [DOI] [PubMed] [Google Scholar]
- 43.Steer AC, Starr M, Kornberg AJ. Bickerstaff brainstem encephalitis associated with Mycoplasma pneumoniae infection. J Child Neurol. 2006;21:533–534. doi: 10.1177/08830738060210061401. [DOI] [PubMed] [Google Scholar]
- 44.Wang GF, Li W, Li K. Acute encephalopathy and encephalitis caused by influenza virus infection. Curr Opin Neurol. 2010;23:305–311. doi: 10.1097/wco.0b013e328338f6c9. [DOI] [PubMed] [Google Scholar]
- 45.Gika AD, Rich P, Gupta S, Neilson DE, Clarke A. Recurrent acute necrotizing encephalopathy following influenza A in a genetically predisposed family. Dev Med Child Neurol. 2010;52:99–102. doi: 10.1111/j.1469-8749.2009.03405.x. [DOI] [PubMed] [Google Scholar]
- 46.Caldemeyer KS, Smith RR, Harris TM, Edwards MK. MRI in acute disseminated encephalomyelitis. Neuroradiology. 1994;36:216–220. doi: 10.1007/BF00588134. [DOI] [PubMed] [Google Scholar]
- 47.Rossi A. Imaging of acute disseminated encephalomyelitis. Neuroimaging Clin N Am. 2008;18:149–161; ix. doi: 10.1016/j.nic.2007.12.007. [DOI] [PubMed] [Google Scholar]
- 48.Lu Z, Zhang B, Qiu W, Kang Z, Shen L, Long Y, Huang J, Hu X. Comparative brain stem lesions on MRI of acute disseminated encephalomyelitis, neuromyelitis optica, and multiple sclerosis. PLoS One. 2011;6:e22766. doi: 10.1371/journal.pone.0022766. [DOI] [PMC free article] [PubMed] [Google Scholar]
- 49.Atzori M, Battistella PA, Perini P, Calabrese M, Fontanin M, Laverda AM, Suppiej A, Drigo P, Grossi P, Rinaldi L, et al. Clinical and diagnostic aspects of multiple sclerosis and acute monophasic encephalomyelitis in pediatric patients: a single centre prospective study. Mult Scler. 2009;15:363–370. doi: 10.1177/1352458508098562. [DOI] [PubMed] [Google Scholar]
- 50.Quattrocchi CC, Cherubini A, Luccichenti G, Grasso MG, Nocentini U, Beomonte Zobel B, Sabatini U. Infratentorial lesion volume correlates with sensory functional system in multiple sclerosis patients: a 3.0-Tesla MRI study. Radiol Med. 2010;115:115–124. doi: 10.1007/s11547-009-0477-7. [DOI] [PubMed] [Google Scholar]
- 51.Yousry TA, Grossman RI, Filippi M. Assessment of posterior fossa damage in MS using MRI. J Neurol Sci. 2000;172 Suppl 1:S50–S53. doi: 10.1016/s0022-510x(99)00279-8. [DOI] [PubMed] [Google Scholar]
- 52.Polman CH, Reingold SC, Banwell B, Clanet M, Cohen JA, Filippi M, Fujihara K, Havrdova E, Hutchinson M, Kappos L, et al. Diagnostic criteria for multiple sclerosis: 2010 revisions to the McDonald criteria. Ann Neurol. 2011;69:292–302. doi: 10.1002/ana.22366. [DOI] [PMC free article] [PubMed] [Google Scholar]
- 53.Chabas D, Strober J, Waubant E. Pediatric multiple sclerosis. Curr Neurol Neurosci Rep. 2008;8:434–441. doi: 10.1007/s11910-008-0067-1. [DOI] [PubMed] [Google Scholar]
- 54.Ghassemi R, Antel SB, Narayanan S, Francis SJ, Bar-Or A, Sadovnick AD, Banwell B, Arnold DL. Lesion distribution in children with clinically isolated syndromes. Ann Neurol. 2008;63:401–405. doi: 10.1002/ana.21322. [DOI] [PubMed] [Google Scholar]
- 55.Ghassemi R, Narayanan S, Banwell B, Sled JG, Shroff M, Arnold DL. Quantitative determination of regional lesion volume and distribution in children and adults with relapsing-remitting multiple sclerosis. PLoS One. 2014;9:e85741. doi: 10.1371/journal.pone.0085741. [DOI] [PMC free article] [PubMed] [Google Scholar]
- 56.Wingerchuk DM, Banwell B, Bennett JL, Cabre P, Carroll W, Chitnis T, de Seze J, Fujihara K, Greenberg B, Jacob A, et al. International consensus diagnostic criteria for neuromyelitis optica spectrum disorders. Neurology. 2015;85:177–189. doi: 10.1212/WNL.0000000000001729. [DOI] [PMC free article] [PubMed] [Google Scholar]
- 57.Vijayakumar K, Gunny R, Grunewald S, Carr L, Chong KW, DeVile C, Robinson R, McSweeney N, Prabhakar P. Clinical neuroimaging features and outcome in molybdenum cofactor deficiency. Pediatr Neurol. 2011;45:246–252. doi: 10.1016/j.pediatrneurol.2011.06.006. [DOI] [PubMed] [Google Scholar]
- 58.Sonam K, Khan NA, Bindu PS, Taly AB, Gayathri N, Bharath MM, Govindaraju C, Arvinda HR, Nagappa M, Sinha S, et al. Clinical and magnetic resonance imaging findings in patients with Leigh syndrome and SURF1 mutations. Brain Dev. 2014;36:807–812. doi: 10.1016/j.braindev.2013.10.012. [DOI] [PubMed] [Google Scholar]
- 59.Mirabelli-Badenier M, Morana G, Bruno C, Di Rocco M, Striano P, De Grandis E, Veneselli E, Rossi A, Biancheri R. Inferior olivary nucleus involvement in pediatric neurodegenerative disorders: does it play a role in neuroimaging pattern-recognition approach. Neuropediatrics. 2015;46:104–109. doi: 10.1055/s-0035-1544185. [DOI] [PubMed] [Google Scholar]
- 60.Tartaglione T, Izzo G, Alexandre A, Botto A, Di Lella GM, Gaudino S, Caldarelli M, Colosimo C. MRI findings of olivary degeneration after surgery for posterior fossa tumours in children: incidence, time course and correlation with tumour grading. Radiol Med. 2015;120:474–482. doi: 10.1007/s11547-014-0477-x. [DOI] [PubMed] [Google Scholar]
- 61.Goyal M, Versnick E, Tuite P, Cyr JS, Kucharczyk W, Montanera W, Willinsky R, Mikulis D. Hypertrophic olivary degeneration: metaanalysis of the temporal evolution of MR findings. AJNR Am J Neuroradiol. 2000;21:1073–1077. [PMC free article] [PubMed] [Google Scholar]
- 62.Tsutsumi S, Ito M, Yasumoto Y, Tabuchi T, Ogino I. The Virchow-Robin spaces: delineation by magnetic resonance imaging with considerations on anatomofunctional implications. Childs Nerv Syst. 2011;27:2057–2066. doi: 10.1007/s00381-011-1574-y. [DOI] [PubMed] [Google Scholar]
- 63.Grimm SA, Chamberlain MC. Brainstem glioma: a review. Curr Neurol Neurosci Rep. 2013;13:346. doi: 10.1007/s11910-013-0346-3. [DOI] [PubMed] [Google Scholar]
- 64.Garzón M, García-Fructuoso G, Guillén A, Suñol M, Mora J, Cruz O. Brain stem tumors in children and adolescents: single institutional experience. Childs Nerv Syst. 2013;29:1321–1331. doi: 10.1007/s00381-013-2137-1. [DOI] [PubMed] [Google Scholar]
- 65.Guillamo JS, Doz F, Delattre JY. Brain stem gliomas. Curr Opin Neurol. 2001;14:711–715. doi: 10.1097/00019052-200112000-00006. [DOI] [PubMed] [Google Scholar]
- 66.Nowak J, Seidel C, Pietsch T, Friedrich C, von Hoff K, Rutkowski S, Warmuth-Metz M. Ependymoblastoma of the brainstem: MRI findings and differential diagnosis. Pediatr Blood Cancer. 2014;61:1132–1134. doi: 10.1002/pbc.24915. [DOI] [PubMed] [Google Scholar]
- 67.Zagzag D, Miller DC, Knopp E, Farmer JP, Lee M, Biria S, Pellicer A, Epstein FJ, Allen JC. Primitive neuroectodermal tumors of the brainstem: investigation of seven cases. Pediatrics. 2000;106:1045–1053. doi: 10.1542/peds.106.5.1045. [DOI] [PubMed] [Google Scholar]
- 68.Bilaniuk LT, Molloy PT, Zimmerman RA, Phillips PC, Vaughan SN, Liu GT, Sutton LN, Needle M. Neurofibromatosis type 1: brain stem tumours. Neuroradiology. 1997;39:642–653. doi: 10.1007/s002340050484. [DOI] [PubMed] [Google Scholar]
- 69.Guillamo JS, Créange A, Kalifa C, Grill J, Rodriguez D, Doz F, Barbarot S, Zerah M, Sanson M, Bastuji-Garin S, et al. Prognostic factors of CNS tumours in Neurofibromatosis 1 (NF1): a retrospective study of 104 patients. Brain. 2003;126:152–160. doi: 10.1093/brain/awg016. [DOI] [PubMed] [Google Scholar]
- 70.Ullrich NJ, Raja AI, Irons MB, Kieran MW, Goumnerova L. Brainstem lesions in neurofibromatosis type 1. Neurosurgery. 2007;61:762–766; discussion 766-767. doi: 10.1227/01.NEU.0000298904.63635.2D. [DOI] [PubMed] [Google Scholar]
- 71.Hervey-Jumper SL, Singla N, Gebarski SS, Robertson P, Maher CO. Diffuse pontine lesions in children with neurofibromatosis type 1: making a case for unidentified bright objects. Pediatr Neurosurg. 2013;49:55–59. doi: 10.1159/000355417. [DOI] [PubMed] [Google Scholar]
- 72.Grois N, Fahrner B, Arceci RJ, Henter JI, McClain K, Lassmann H, Nanduri V, Prosch H, Prayer D. Central nervous system disease in Langerhans cell histiocytosis. J Pediatr. 2010;156:873–881, 881.e1. doi: 10.1016/j.jpeds.2010.03.001. [DOI] [PubMed] [Google Scholar]
- 73.Savardekar A, Tripathi M, Bansal D, Vaiphei K, Gupta SK. Isolated tumorous Langerhans cell histiocytosis of the brainstem: a diagnostic and therapeutic challenge. J Neurosurg Pediatr. 2013;12:258–261. doi: 10.3171/2013.6.PEDS13132. [DOI] [PubMed] [Google Scholar]
- 74.Prosch H, Grois N, Wnorowski M, Steiner M, Prayer D. Long-term MR imaging course of neurodegenerative Langerhans cell histiocytosis. AJNR Am J Neuroradiol. 2007;28:1022–1028. doi: 10.3174/ajnr.A0509. [DOI] [PMC free article] [PubMed] [Google Scholar]
- 75.Caldarelli M, Colosimo C, Di Rocco C. Intra-axial dermoid/epidermoid tumors of the brainstem in children. Surg Neurol. 2001;56:97–105. doi: 10.1016/s0090-3019(01)00542-0. [DOI] [PubMed] [Google Scholar]


