Abstract
Measurement of thiol-disulfide redox status is crucial for characterization of tumor physiology. The electron paramagnetic resonance (EPR) spectra of disulfide-linked dinitroxides are readily distinguished from those of the corresponding monoradicals that are formed by cleavage of the disulfide linkage by free thiols. EPR spectra can thus be used to monitor the rate of cleavage and the thiol redox status. EPR spectra of 1H,14N- and 2H,15N-disulfide dinitroxides and the corresponding monoradicals resulting from cleavage by glutathione have been characterized at 250 MHz, 1.04 GHz, and 9 GHz and imaged by rapid-scan EPR at 250 MHz.
Keywords: disulfide dinitroxide, disulfide cleavage, glutathione, image reconstruction, rapid-scan EPR, thiol redox status
Graphical Abstract
1. Introduction
A key parameter for understanding the physiology of heterogeneous tumor microenvironments is thiol redox status [1–5]. Nitroxide diradicals joined by a disulfide bond (-S-S-) can be cleaved by reaction with other molecules containing sulfhydryl groups to produce monoradicals. Cleavage of the S-S bond results in distinctive changes in the EPR (electron paramagnetic resonance) spectrum, thereby providing information on the redox status of the environment of the diradical probe [6, 7]. Most EPR studies of nitroxide diradicals have been performed at a microwave frequency of about 9.5 GHz (X-band) [7–10]. To achieve adequate depth penetration of the electromagnetic radiation for in vivo imaging, lower frequencies are required such as 1.0 GHz (L-band) or 250 MHz [11]. Recently EPR spectra have been reported for disulfide dinitroxides at ~1 GHz [7, 12]. We now report the frequency dependence of EPR spectra at 9.5 and 1.0 GHz, and 250 MHz of normoisotopic and 2H,15N-substituted disulfide dinitroxides that can be used to probe redox status.
Oximetric imaging at 250 MHz, a powerful tool for measuring local oxygen concentration in vivo, is based on changes in lineshapes or electron spin relaxation times of a relatively narrow EPR signal [13]. Monitoring the conversion of nitroxide diradical to the corresponding monoradical to determine redox status is enhanced by measurement of the full hyperfine-split EPR spectrum as a function of position in the sample. We have recently developed a new approach for EPR 2D spectral-spatial imaging with spectral widths up to 5.0 mT at 250 MHz [14] and demonstrated its application to imaging the full spectrum of spin-trapped hydroxyl radical [15]. In essence, each projection is a row in a matrix of information, which can be mathematically converted into a set of spectra at known spatial positions, which is a spectral-spatial image. Unlike the traditional filtered back-projection, this new method allows acquiring projections at selected gradients, which can be arbitrarily spaced - some closely spaced near zero for good spectral definition and some closely spaced at maximum gradient to define spatial resolution.
To enhance the signal-to-noise (S/N), projections are acquired by rapid-scan EPR. In rapid-scan EPR the magnetic field is scanned through resonance in a time that is short relative to electron spin relaxation times [16]. Deconvolution of the rapid-scan signal gives the absorption spectrum, which is equivalent to the first integral of the conventional first-derivative continuous wave (CW) spectrum. For a wide range of samples including rapidly-tumbling nitroxides in fluid solution [17], spin-trapped O2•− [18], the E′ center in irradiated fused quartz [19], paramagnetic centers in amorphous hydrogenated silicon [20], N@C60 diluted in C60 [20], and the neutral single substitutional nitrogen centers (NS0) in diamond [20], rapid-scan EPR provides substantial improvements in S/N relative to CW EPR for the same data acquisition time [16]. The improvement in S/N that can be obtained by recording the projections for EPR imaging at 250 MHz by rapid scan compared with CW EPR has been demonstrated for phantoms containing multiple nitroxide radicals [21]. To achieve about the same S/N for an image of the phantom required about 10 times as long for CW as for rapid scan [21].
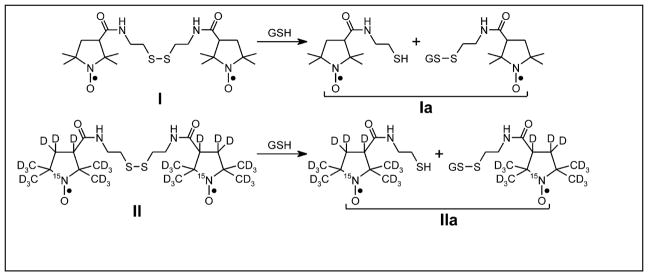
In this report we show images at 250 MHz of phantoms comprised of a diradical and the corresponding monoradical (Fig. 1) that take advantage of the sensitivity enhancement of rapid-scan EPR. The cleavage reactions are shown in Fig. 1. Developing the ability to characterize and image redox-sensitive diradicals at 250 MHz is an important first step towards in vivo monitoring of the thiol redox status of a tumor deep within an animal.
Figure 1.
Structures of disulfide dinitroxides I and II examined in this report. The cleaved monoradical forms of I and II are designated as Ia and IIa.
2. Methods
Disulfide dinitroxides I and II were synthesized as reported [22]. Stock solutions were prepared in DMSO (dimethylsulfoxide) for subsequent dilution with pH 7.2 Tris buffer. The DMSO in the final solutions was 1% for 0.5 mM solutions and 2% for 1 mM solutions of I or II. The temperature was 20 – 22° C unless otherwise noted.
2.1 250 MHz
Spectroscopy and imaging at 250 MHz (9 mT, 90 G) were performed on the previously described spectrometer [23]. Rapid sinusoidal scans were generated with a locally-designed coil driver [24] and 8.9 cm diameter Litz wire coils to ensure uniformity of the scanning field over the sample. A cross loop resonator [25, 26] was used to isolate the detection system from the excitation. The resonator and scan coils were mounted with vibration-isolating Sorbothane polymer (Sorbothane, Inc., Kent, Ohio) in a Nylon bracket. The Sorbothane was added to the resonator to damp motions that could contribute to the oscillating background signal generated by the rapidly changing magnetic fields. To monitor temperature a thermocouple was mounted within 2 – 3 cm of the active volume of the resonator.
Two geometries of phantoms were used for imaging. One phantom used a 16 mm OD quartz tube divided into three compartments with a 10 mm separation between the two outer compartments. Sample was present in the two outer compartments. Forty-one projections were acquired with 1 G/cm increments in gradient between 20 and −20 G/cm. Data acquisition parameters for images of II and IIa were B1 = 72 mG, 3.01 kHz scan frequency, 20 ns timebase, 65,536 points per projection, 40,000 averages, 53 s/projection. A second phantom consisted of two 5 mm OD quartz tubes, separated by a 5 mm Styrofoam spacer, supported in a 16 mm OD pyrex tube, which provided a 6 mm separation between the two solutions. Images of II as a function of time after addition of glutathione were acquired with 21 projections at increments of 2 G/cm between 20 and −20 G/cm. Data acquisition parameters were B1 = 72 mG, 8.856 kHz scan frequency, 10 ns timebase, 65,536 points per projection, 45,000 averages, 20 s/projection. The iron signal from the pyrex outer tube is sufficiently strong that a blank image was acquired with deionized water in both tubes and subtracted from each image of II and IIa to remove the g = 4 signal.
In the rapid-scan experiment the rapidly changing magnetic field generates a background signal at the fundamental scan frequency which was removed from the data as described previously [27]. Projections were collected for each image and reconstructed using the previously described algorithm [14, 26].
2.2 1.04 GHz
Rapid-scan and CW spectra at L-band (1.04 GHz) were recorded on a Bruker E540 Elexsys spectrometer using a locally-designed dielectric resonator. Sinusoidal scan widths were between 70 and 100 G [24]. For diradical I the scan frequency was 7.46 kHz and B1 was 34.5 mG. For diradical II and monoradicals Ia and IIa the scan frequency was 2.06 kHz and B1 was 61.4 mG.
2.3 X-band
X-band CW spectra were obtained with 100 kHz modulation frequency. T2 and T1 were measured by 2-pulse echo decay and inversion recovery, respectively, on an E580 Bruker spectrometer. Solutions were de-oxygenated by passing N2 gas over Teflon tubes that contained the solutions.
3. Results
3.1 Spectroscopy at 250 MHz, 1.0 and 9.6 GHz
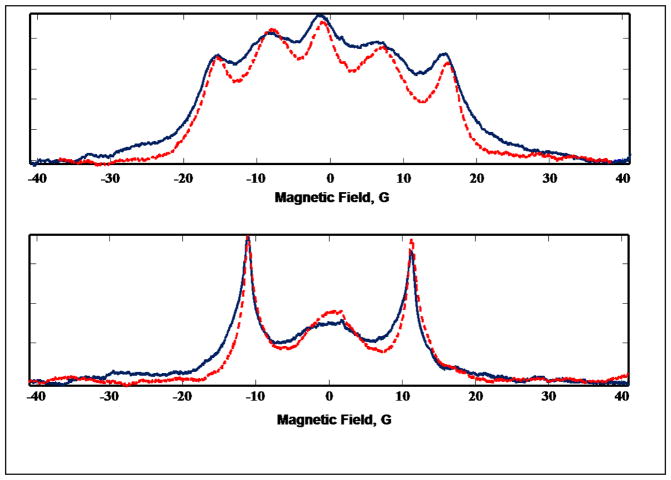
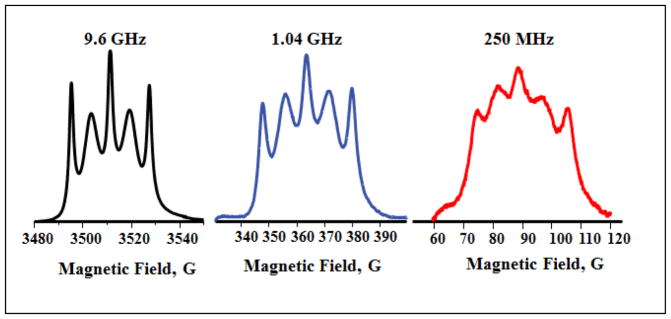
In I and II, the electron-electron exchange interaction between the two nitroxide moieties is not strong enough to fully average the hyperfine coupling to the two nitrogens. This intermediate exchange results in a 5-line spectrum for 1H,14N-containing (I = 1) diradical I in which lines 1, 3, and 5 are relatively sharp and lines 2 and 4 are broader (Fig. 2A), and a 3-line spectrum for 2H,15N-containing (I = ½) diradical II in which lines 1 and 3 are relatively sharp and line 2 is broader (Fig. 2C). For dinitroxides such as I and II in which there are several bonds between the two nitroxide rings, the exchange interaction is through space rather than through the intramolecular bond linkage [10]. The magnitude of the exchange interaction is strongly dependent on molecular conformation and increases with increasing frequency of collisions between the two nitroxide moieties. The collision frequency increases with increasing temperature, resulting in enhanced exchange interaction that narrows the EPR spectral lines. This is clearly illustrated when the temperature of the solution was raised from 19°C to 38°C (Fig. 3). The frequency dependence of linewidths can be described with a spectral density function [10] so linewidths are larger at lower frequency as shown in Fig. 4. Linewidths in the spectra of I, Ia, II, and IIa at the frequencies shown in Fig. 4 are summarized in Table S1.
Figure 2.
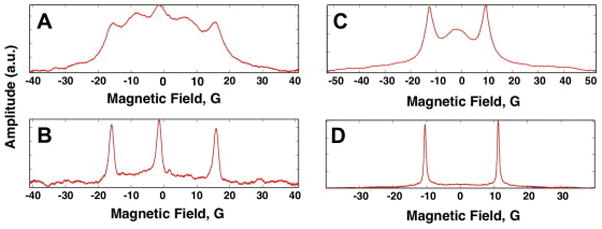
Absorption spectra for solutions of radicals acquired by rapid scan at 250 MHz. A) 0.5 mM I, B) 1 mM Ia, C) 0.5 mM II, and D) 1 mM IIa. Lines are numbered from low to high field. Ia and IIa were prepared by reaction of I (0.5 mM) or II (0.5 mM), respectively, with a two-fold excess of glutathione (1 mM).
Figure 3.
Deconvolved rapid-scan absorption spectra of I (top) and II (bottom) in air at 250 MHz at 19 °C (solid, blue) or 38 °C (dashed, red).
Figure 4.
Absorption spectra of diradical I obtained by CW (9.6 GHz) or rapid scan (1.04 GHz and 250 MHz).
The use of the disulfide diradicals to monitor redox status requires understanding of the spectral changes that accompany the cleavage reaction at 250 MHz. Reaction of I with glutathione produces monoradical Ia with the familiar 3-line hyperfine pattern (Fig. 1 and 2B). Reaction of II with glutathione gives IIa with the typical 2-line hyperfine pattern (Fig. 1 and 2D). Under our experimental conditions, reaction of I (0.5 mM) with glutathione (1.0 mM) goes to completion in about 3 hr at room temperature (ca. 20–22°C), and about 1 hr at 37°C. The kinetics of the reaction is bimolecular [22]. The intracellular concentration of glutathione in cytosol is estimated to be in the range of 1 – 10 mM [7], so rates of cleavage in vivo are expected to be faster than for these in vitro studies [22].
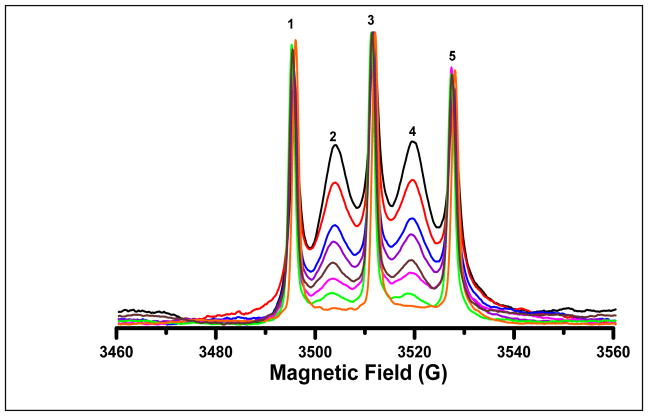
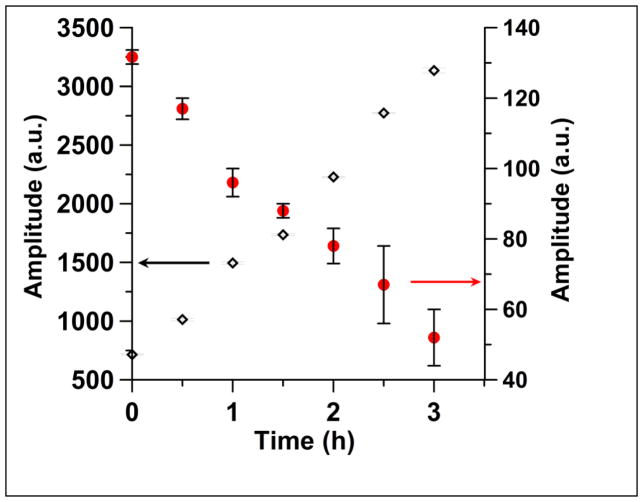
X-band absorption spectra taken during the course of the reaction of I with an equimolar concentration of glutathione at 20°C are shown in Fig. 5. The time dependence of peak amplitudes in the corresponding first-derivative spectra is shown in Fig. 6. The spectra in Fig. 5 are shown as the absorption spectra, because the slices through the spectral-spatial images at 250 MHz that are shown in Fig. 7 are absorption spectra, and because the broad lines that are characteristic of the diradical are more conspicuous in the absorption spectra than in the first derivatives. In Fig. 5 the spectra are scaled to constant amplitude for the largest peak to emphasize changes in lineshape. In the diradical spectrum line 1 corresponds to the mI = +1 14N nuclear spin state for both nitrogens, which is 1 of 9 possible combinations of nuclear spin states and therefore accounts for 1/9 of the signal intensity. In the monoradical spectrum, line 1 corresponds to the mI = +1 nuclear spin state for a single nitrogen and accounts for 1/3 of the signal intensity. Thus, conversion of diradical to monoradical results in a 3-fold intensity increase for line 1. During the conversion of diradical I to monoradical Ia the amplitude of line 1 was observed to increase by more than a factor of three (Fig. 6), because of the narrowing of the line that accompanies the conversion of diradical to monoradical. This observation is consistent with the prior report that the amplitude of lines 1 and 5 in the spectra of another disulfide diradical increased by more than a factor of three during the conversion of diradical to monoradical [7]. The double integral of the signal from one mole of diradical is equal to that for two moles of monoradical. The double integrals of the spectra recorded during the course of the disulfide cleavage reaction (Fig. 5) did not change during the course of the reaction, which indicates that reduction of the nitroxide moiety does not occur during the time of the cleavage reaction.
Figure 5.
Integrated X-band CW spectra at 20°C showing changes during the cleavage of dinitroxide I (0.5 mM) by glutathione (0.5 mM). Time 0 (
 ), 30 min (
 ), 60 min (
 ), 90 min (
 ), 120 min (
 ), 150 min (
 ), and 180 min (
 ) after adding glutathione. To obtain the limiting spectrum after 24 hr (
 ) the sample was stored at 4°C overnight. The spectra were scaled to constant amplitude for the highest peak.
Figure 6.
Time dependence of the peak-to-peak amplitudes of lines 1 (◇) and line 2 (●) in the first-derivative spectra after addition of glutathione (0.5 mM) to I (0.5 mM). The amplitude of line 1 increases by more than a factor of 3 as I is converted to Ia, because the linewidth of line 1 is narrower for Ia than for I. The error bars are three times the standard deviations calculated for three spectra recorded in rapid succession. The arrows indicate the y-axis scale that corresponds to each data set.
Figure 7.
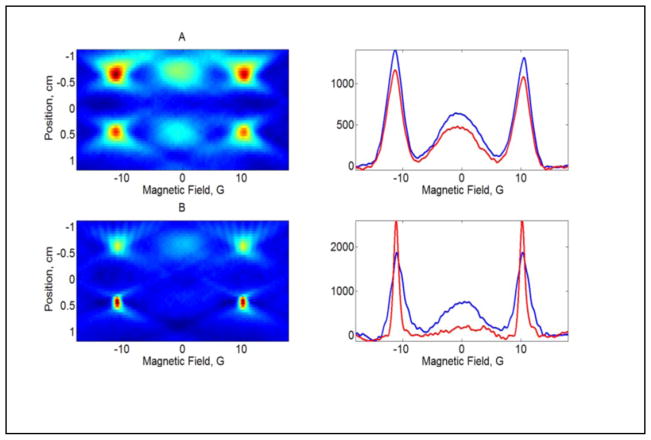
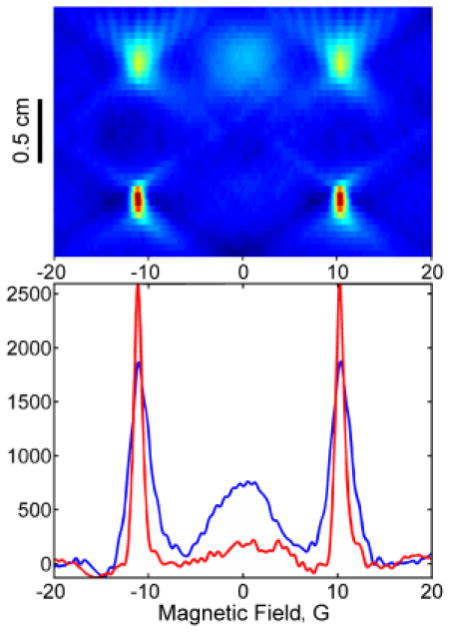
2D spectral-spatial images of II and IIa in a two-compartment phantom with a 10 mm spacer between compartments. A) Left: both compartments contain 0.5 mM diradical II; right: slices through the upper (blue) and lower (red) compartments of the image. B) Left: the upper compartment contains 0.5 mM II and the lower compartment contains 1 mM IIa, generated by the reaction of 0.5 mM II with 1 mM glutathione; right: slices through the upper (blue) and lower (red) compartments of the image.
3.2 Electron Spin Relaxation Times at X-band
To further characterize the disulfide diradicals and the corresponding monoradicals, electron spin relaxation times were measured at X-band. CW power saturation curves (Fig. S1) demonstrated that relaxation rates were significantly faster for diradical I than for monoradical Ia. Pulse EPR was used to directly measure T1 and T2 in solutions equilibrated with air or N2 (Table S2). The relaxation times for the exchange-broadened lines are too short to be measured with available equipment. The electron-electron exchange interaction also shortens the relaxation times for lines 1, 3, and 5 in the spectrum of I and lines 1 and 3 in the spectrum of II. Although pulsed EPR has been very effective for oximetric imaging based on trityl radicals that have relatively long spin relaxation times [28], the relatively long dead times of resonators at low frequency make it difficult to image radicals with shorter relaxation times. Rapid scan EPR is the preferred imaging modality for faster-relaxing species such as nitroxide radicals [16].
3.3 Imaging at 250 MHz
Two spectral-spatial images of 2H,15N-dinitroxide II in a two-compartment phantom are shown in Fig. 7. In one image (Fig. 7A), both compartments of the phantom were filled with II. In the second image (Fig. 7B) one compartment contained II, and the other compartment contained monoradical IIa obtained by reaction with glutathione (Fig. 7B). The two images represent the extremes of the redox reaction. An in vivo environment would have a mixture of II and IIa. The image and slices through the image clearly display the changes in relative concentrations of mono and diradical.
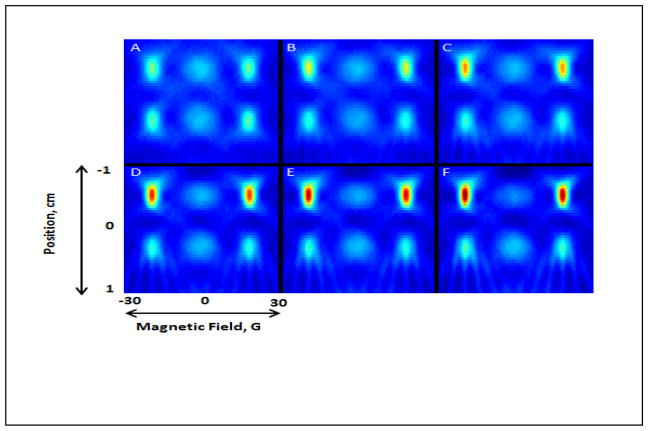
A key indicator of redox status is the rate of cleavage of the diradical. Fig. 8 displays the time dependence of images in a phantom with 6 mm separation between two tubes. After addition of glutathione to one of the tubes (under N2), images were collected to monitor the conversion of II to IIa. The ratio of the amplitudes of peaks 1 and 2 in the absorption spectrum changes from 1.6 at time zero to 4.9 at time = 107 min. The overall appearance of the images and the ratios of peak heights in slices through the tubes clearly show the progress of the reaction. The time dependence of slices through the image is shown in Fig. S3.
Figure 8.
250 MHz images at 30°C of a two-tube phantom with 6 mm separation between tubes. Initially both tubes contained 1 mM diradical II. At time = 0, 2 mM glutathione was added to the upper tube. The time at completion of data acquisition for each image was A) 0 min, B) 26 min, C) 43 min, D) 60 min, E) 76 min, and F) 107 min.
The substantial spectral changes between the diradicals and corresponding monoradicals provide well-defined metrics for monitoring redox status. The S/N of the rapid scan images demonstrates the feasibility of imaging the time dependence of the diradical cleavage. A 3D rapid-scan EPR image at 250 MHz of these diradicals in a tumor can be obtained in 35 s, which permits determination of the reaction kinetics in vivo [29]. With an octanol-water partition coefficient of Pow = 13.5, the diradical should permeate cell membranes and thus readily enter cells [22]. Preliminary results of the extension of the 2D imaging reconstruction method reported here to 4D have recently been reported [30]. These observations indicate that the disulfide diradicals will be useable for in vivo imaging of thiol redox status in cells.
Supplementary Material
Research Highlights.
EPR spectra of disulfide dinitroxide cleavage are indicators of thiol redox status
EPR spectra of dimers are readily distinguished from those of monomers
Thiol cleavage reactions in phantoms were monitored by EPR imaging at 250 MHz
Acknowledgments
Partial support of this work by NIH grants CA177744 (GRE and SSE), EB000557 (GRE and SSE), K25 EB016040 (MT), DA03672 (GMR) and P41 EB002034 to GMR and GRE, H. J. Halpern, PI, is gratefully acknowledged.
Footnotes
Publisher's Disclaimer: This is a PDF file of an unedited manuscript that has been accepted for publication. As a service to our customers we are providing this early version of the manuscript. The manuscript will undergo copyediting, typesetting, and review of the resulting proof before it is published in its final citable form. Please note that during the production process errors may be discovered which could affect the content, and all legal disclaimers that apply to the journal pertain.
References
- 1.Miething C, Scuoppo C, Bosbach B, Appelmann I, Nakitandwe J, Ma J, Wu G, Lintault L, Auer M, Premsrirut PK, Teruya-Feldstein J, Hicks J, Benveniste H, Speicher MR, Downing JR, Lowe SW. PTEN action in leukaemia dictated by the tissue microenvironment. Nature. 2014;510:402–406. doi: 10.1038/nature13239. [DOI] [PMC free article] [PubMed] [Google Scholar]
- 2.Vaupel P, Okunieff P, Neuringer LJ. Blood flow, tissue oxygenation, pH distribution, and energy metabolism of murine mammary adenocarcinomas during growth. Adv Exp Med Biol. 1989;248:835–845. doi: 10.1007/978-1-4684-5643-1_95. [DOI] [PubMed] [Google Scholar]
- 3.Brizel DM, Wasserman TH, Henke M, Strnad V, Rudat V, Monnier A, Schwege F, Zhang Russell J, Oster LW, Sauer R. Phase III randomized trial of amifostine as a radioprotector in head and neck cancer. J Clin Oncol. 2000;18:3339–3345. doi: 10.1200/JCO.2000.18.19.3339. [DOI] [PubMed] [Google Scholar]
- 4.Devi PU. Normal tissue protection in cancer therapy - Progress and prospects. Acta Oncologica. 1998;37:247–252. doi: 10.1080/028418698429531. [DOI] [PubMed] [Google Scholar]
- 5.Gatenby RA, Silva AS, Gillies RJ, Frieden BR. Adaptive therapy. Cancer Res. 2009;69:4894–4903. doi: 10.1158/0008-5472.CAN-08-3658. [DOI] [PMC free article] [PubMed] [Google Scholar]
- 6.Markham GD, Myers CB, Harris KAJ, Volin M, Jaffe EK. Spatial proximity and sequence localization of the reactive sulfhydryls of porphobilinogen synthase. Protein Sci. 1993;2:71–79. doi: 10.1002/pro.5560020107. [DOI] [PMC free article] [PubMed] [Google Scholar]
- 7.Roshchupkina GI, Bobko AA, Bratasz A, Reznikov VA, Kuppusamy P, Khramtsov VV. In vivo EPR measurement of glutathione in tumor-bearing mice using improved disulfide biradical probe. Free Rad Biol Med. 2008;45:312–320. doi: 10.1016/j.freeradbiomed.2008.04.019. [DOI] [PMC free article] [PubMed] [Google Scholar]
- 8.Rozantsev EG. Free Nitroxyl Radicals. Plenum Press; 1970. [Google Scholar]
- 9.Molin YN, Salikhov KM, Zamaraev KI. Spin Exchange: Principles and Applications in Chemistry and Biology. Springer-Verlag; Berlin: 1980. [Google Scholar]
- 10.Luckhurst GR. Biradicals as Spin Probes. In: Berliner LJ, editor. Spin Labeling: Theory and Applications. Vol. 4 Academic Press; 1976. [Google Scholar]
- 11.Halpern HJ, Spencer DP, van Polen J, Bowman MK, Nelson AC, Dowey EM, Teicher BA. Imaging radio frequency electron-spin-resonance spectrometer with high resolution and sensitivity for in vivo measurements. Rev Sci Instrum. 1989;60:1040–1050. [Google Scholar]
- 12.Bobko AA, Eubank TD, Voorhees JL, Efimova OV, Kirilyuk IA, Petryakov S, Trofimiov DG, Marsh CB, Zweier JL, Grigorev IA, Samouilov A, Khramtsov VV. In Vivo Monitoring of pH, Redox Status, and Glutathione Using L-Band EPR for Assessment of Therapeutic Effectiveness in Solid Tumors. Magn Reson Med. 2012;67:1827–1836. doi: 10.1002/mrm.23196. [DOI] [PMC free article] [PubMed] [Google Scholar]
- 13.Elas M, Bell R, Hleihel D, Barth ED, McFaul C, Haney CR, Bielanska J, Pustelny K, Ahn KH, Pelizzari CA, Kocherginsky M, Halpern HJ. Electron Paramagnetic Resonance Oxygen Image Hypoxic Fraction Plus Radiation Dose Strongly Correlates With Tumor Cure in FSa Fibrosarcomas. Int J Radiation Oncology Biol Phys. 2008;71:542–549. doi: 10.1016/j.ijrobp.2008.02.022. [DOI] [PMC free article] [PubMed] [Google Scholar]
- 14.Tseitlin M, Biller JR, Elajaili H, Khramtsov V, Dhimitruka I, Eaton GR, Eaton SS. New spectral-spatial imaging algorithm for full EPR spectra of multiline nitroxides and pH sensitive trityl radicals. J Magn Reson. 2014;245:150–155. doi: 10.1016/j.jmr.2014.05.013. [DOI] [PMC free article] [PubMed] [Google Scholar]
- 15.Biller JR, Tseitlin M, Mitchell DG, Yu Z, Buchanan LA, Elajaili H, Rosen GM, Kao JPY, Eaton SS, Eaton GR. Improved Sensitivity for Imaging Spin Trapped Hydroxy Radical at 250 MHz. Chem Phys Chem. 2015;16:528–531. doi: 10.1002/cphc.201402835. [DOI] [PMC free article] [PubMed] [Google Scholar]
- 16.Eaton SS, Quine RW, Tseitlin M, Mitchell DG, Rinard GA, Eaton GR. Rapid Scan Electron Paramagnetic Resonance. In: Misra SK, editor. Multifrequency Electron Paramagnetic Resonance: Data and Techniques. Wiley; 2014. pp. 3–67. [Google Scholar]
- 17.Mitchell DG, Quine RW, Tseitlin M, Eaton SS, Eaton GR. X-band Rapid-Scan EPR of Nitroxyl Radicals. J Magn Reson. 2012;214:221–226. doi: 10.1016/j.jmr.2011.11.007. [DOI] [PubMed] [Google Scholar]
- 18.Mitchell DG, Rosen GM, Tseitlin M, Symmes B, Eaton SS, Eaton GR. Use of Rapid-Scan EPR to Improve Detection Sensitivity for Spin-Trapped Radicals. Biophys J. 2013;105:338–342. doi: 10.1016/j.bpj.2013.06.005. [DOI] [PMC free article] [PubMed] [Google Scholar]
- 19.Mitchell DG, Quine RW, Tseitlin M, Meyer V, Eaton SS, Eaton GR. Comparison of Continuous Wave, Spin Echo, and Rapid Scan EPR of Irradiated Fused Quartz. Radiat Meas. 2011;46:993–996. doi: 10.1016/j.radmeas.2011.03.035. [DOI] [PMC free article] [PubMed] [Google Scholar]
- 20.Mitchell DG, Tseitlin M, Quine RW, Meyer V, Newton ME, Schnegg A, George B, Eaton SS, Eaton GR. X-Band Rapid-scan EPR of Samples with Long Electron Relaxation Times: A Comparison of Continuous Wave, Pulse, and Rapid-scan EPR. Mol Phys. 2013;111:2664–2673. [Google Scholar]
- 21.Biller JR, Tseitlin M, Quine RW, Rinard GA, Weismiller HA, Elajaili H, Rosen GM, Kao JP, Eaton SS, Eaton GR. Imaging of Nitroxides at 250 MHz using Rapid-Scan Electron Paramagnetic Resonance. J Magn Reson. 2014;242:162–168. doi: 10.1016/j.jmr.2014.02.015. [DOI] [PMC free article] [PubMed] [Google Scholar]
- 22.Legenzov EA, Sims SJ, Dirda NDA, Rosen GM, Kao JPY. Disulfide-linked dinitroxides for monitoring cellular thiol redox status through electron paramagnetic resonance spectroscopy. Biochemistry. 2015;54:6973–6982. doi: 10.1021/acs.biochem.5b00531. [DOI] [PubMed] [Google Scholar]
- 23.Quine RW, Rinard GA, Eaton SS, Eaton GR. Quantitative Rapid Scan EPR Spectroscopy at 258 MHz. J Magn Reson. 2010;205:23–27. doi: 10.1016/j.jmr.2010.03.012. [DOI] [PMC free article] [PubMed] [Google Scholar]
- 24.Quine RW, Mitchell DG, Eaton SS, Eaton GR. A Resonated Coil Driver for Rapid Scan EPR. Conc Magn Reson Magn Reson Engineer. 2012;41B:95–110. [Google Scholar]
- 25.Rinard GA, Quine RW, Biller JR, Eaton GR. A Wire Crossed-Loop-Resonator for Rapid Scan EPR. Concepts Magn Reson B Magn Reson Engineer. 2010;37B:86–91. doi: 10.1002/cmr.b.20161. [DOI] [PMC free article] [PubMed] [Google Scholar]
- 26.Biller JR, Tseitlin M, Quine RQ, Rinard GA, Weismiller HA, Elajaili H, Rosen GM, Kao JPY, Eaton SS, Eaton GR. Imaging of Nitroxides at 250 MHz using Rapid-Scan Electron Paramagnetic Resonance. J Magn Reson. 2014;242:162–168. doi: 10.1016/j.jmr.2014.02.015. [DOI] [PMC free article] [PubMed] [Google Scholar]
- 27.Tseitlin M, Mitchell DG, Eaton SS, Eaton GR. Corrections for sinusoidal background and non-orthogonality of signal channels in sinusoidal rapid magnetic field scans. J Magn Reson. 2012;223:80–84. doi: 10.1016/j.jmr.2012.07.023. [DOI] [PMC free article] [PubMed] [Google Scholar]
- 28.Mailer C, Sundramoorthy SV, Pelizzari CA, Halpern HJ. Spin echo spectroscopic electron paramagnetic resonance imaging. Magn Reson Med. 2006;55:904–912. doi: 10.1002/mrm.20849. [DOI] [PubMed] [Google Scholar]
- 29.Epel B, Sundramoorthy SV, Krzykowska-Serda M, Maggio M, Tseytlin M, Khramtzov VK, Eaton GR, Rosen GM, Kao JP, Halpern HJ. 250 MHz in vivo Rapid Scan Images of pH and Thiol Reductive Status; 57th Rocky Mountain Conference on Magnetic Resonance; Snowbird, Utah. 2015; p. abstract 209. [Google Scholar]
- 30.Tseytlin M, Epel B, Krzykowska-Serda M, Maggio M, Khramtzov VK, Eaton GR, Eaton SS, Rosen GM, Kao JP, Halpern HJ. Full Spectrum Rapid Scan 4D Spectral-Spatial EPR Imaging with Nitroxide Probes at 250 MHz; 57th Annual Rocky Mountain Conference on Magnetic Resonance; Snowbird, Utah . 2015; p. abstract 242. [Google Scholar]
Associated Data
This section collects any data citations, data availability statements, or supplementary materials included in this article.


