Abstract
Background: We tested the hypothesis that extracorporeal shock wave (ECSW) therapy can effectively protect sciatic nerve (SN) from diabetes mellitus (DM)-induced neuropathy in leptin-deficient (ob/ob) mice. Methods and results: Eighteen-week C57BL/6 mice (n=8) served as age-matched controls (group 1) and ob/ob mice (n=16) were categorized into DM (group 2) and DM + ECSW (0.12 mJ/mm2 for 4 times of 200 impulses at 3-week intervals) (group 3). The animals were sacrificed two weeks post-ECSW. In vitro results showed that the protein expressions of oxidative stress (NOX-1, NOX-2, oxidized protein), inflammation (MMP-9, TNF-α, iNOS), apoptosis (Bax, cleaved caspase-3, & PARP), and DNA-damage marker (γ-H2AX) were significantly higher in RT4-D6P2T (schwannoma cell line) treated by menadione (25 µM) compared with control group and were significantly reversed after ECSW (0.12 mJ/mm2, 200 impulses) (all p<0.001). mRNA expressions of inflammation (MMP-9, TNF-α, iNOS), oxidative stress (NOX-1, NOX-2) and apoptosis (Bax, caspase-3) in SN were significantly higher in group 2 than in group 1 and were significantly reversed in group 3, whereas the mRNA expressions of anti-oxidants (HO-1, NQO1) progressively increased from group 1 to group 3 (all p<0.001). Cellular expressions of F4/80+, CD14+, γ-H2AX+ cells, and number of vacuolar formation in SN showed a pattern identical to that of inflammation markers among all groups (all p<0.001). Microscopic findings of Schwann cells and myelin-sheath scores, and number of eNOS+ cells in SN showed a reversed pattern compared to that of inflammation among all groups (all p<0.001). Conclusions: ECSW therapy protected SN against DM-induced neuropathy.
Keywords: Diabetic neuropathy, extracorporeal shock wave, oxidative stress, inflammation
Introduction
Diabetes mellitus (DM), a globally growing disease, is a very important public health issue worldwide [1,2]. Today, there are up to 382 million people living with diabetes [3]. Moreover, an estimated number of cases exceeding 316 million globally with impaired glucose tolerance are at high risk of developing the disease. The number is expected to reach a staggering 471 million by 2035 [3]. Additionally, by the end of 2013, up to USD 548 billion have been spent on the healthcare of DM patients [3]. Of particular importance is that despite the state-of-the-art advanced pharmacological development and new therapeutic refinement [4], there are still more than 5.1 million DM patients died (i.e., by the end of 2013) of DM or DM-related pathological conditions such as cardiovascular and cerebrovascular diseases or peripheral arterial occlusive disease [3]. Accordingly, treatment of DM remains a formidable challenge to clinicians.
Undoubtedly, DM-related complications, such as diabetic neuropathy, diabetic retinopathy, and diabetes-associated autonomic dysfunction remain important issues among physicians and other healthcare providers [5]. Intriguingly, although satisfactory control of diabetes has been accepted as the best way to avoid complications, there is no effective treatment for diabetic complications (e.g., diabetic neuropathy) once they occur.
Extracorporeal shock wave (ECSW) has been originally developed for the treatment of lithotripsy. Interestingly, growing data have shown that ECSW therapy is effective for improving acute interstitial cystitis [6], chronic tendinitis, and delayed fracture healing with promising results [7-9]. The underlying mechanisms have been suggested to be mainly through the relief of painful sensations and the suppression of inflammatory reactions and oxidative stress [6-12]. Accordingly, we hypothesized that (1) sciatic nerve might be damaged in the setting of type 2 DM in 18-week-old leptin-deficient (ob/ob) mice, and (2) ECSW might effectively attenuate DM-induced diabetic neuropathy.
Materials and methods
Ethics
All animal experimental procedures were approved by the Institute of Animal Care and Use Committee at Kaohsiung Chang Gung Memorial Hospital (Affidavit of Approval of Animal Use Protocol No. 2014012001) and performed in accordance with the Guide for the Care and Use of Laboratory Animals [The Eighth Edition of the Guide for the Care and Use of Laboratory Animals (NRC 2011)].
Animals were housed in an Association for Assessment and Accreditation of Laboratory Animal Care International (AAALAC)-approved animal facility in our hospital with controlled temperature and light cycle (24°C and 12/12 light cycle).
Animal grouping and measurement of blood sugar level for confirming diabetic status
Pathogen-free, 18-week-old adult male leptin-deficient (ob/ob) mice (i.e., obese with type 2 DM) (n=20) weighing 45-50 g (Charles River Technology, BioLASCO Taiwan Co. Ltd., Taipei, Taiwan) were randomly divided into two groups, including (1) diabetes mellitus (DM), and (2) DM + ECSW. In addition, age-matched (AM) adult male C57BL/6 (WT) mice (n=10) served as AM controls (i.e., AMC).
The procedure and protocol of measuring blood glucose level were based on our previous report [13]. Briefly, after 12-hour fasting, the blood glucose level of each ob/ob and WT mouse was checked once at the age of 18 weeks between 8:00-9:00 a.m. using a blood glucose monitor (ACCU-CHEK-Active; Roche).
The results showed that the blood glucose level was higher than 320 gm/dL in ob/ob mice and less than 105 gm/dL in WT mice. Besides, the timing of 18 weeks was chosen for the present study not only because of the presence of diabetic neuropathy as early as 11-week-old ob/ob mice as reported in a previous study [14], but also because of the need for serving the purpose of the present study to mimic the timing of diabetic neuropathy in the clinical setting.
Rationale of ECSW energy dosage
The procedure, protocol and application of ECSW energy dosage for the treatment of the diabetic neuropathy of sciatic nerve were based on our recent reports [6,11,12] with minimal modification. Briefly, ECSW 200 impulses at 0.12 mJ/mm2 each time was applied to the skin surface above the femoral areas of the 18-week old animals at the beginning of 1st, 2nd, 3rd, and 4th consecutive weeks. All animals were anesthetized by inhalational of 2.0% isoflurane, and placed in a supine position on a warming pad at 37°C for ECSW treatment. Animals in each group were sacrificed 2 weeks later after completion of ECSW therapy (i.e., at the age of 23 weeks). The sciatic nerves of each animal were harvested for individual study.
In vitro study for determining the suppressive effect of ECSW on expressions of inflammation, apoptosis, and oxidative stress markers
To elucidate the impact of ECSW on inflammation, apoptosis, and oxidative stress, RT4-D6P2T cells (schwannoma cell line) (Bioresource Collection and Research Center, Hsinchu, Taiwan) were first cultured in DMEM culture medium for 2 days with or without subsequent ECSW treatment (0.12 mJ/mm2/impulse for 200 impulses). After ECSW treatment, the cells were cultured with menadione (25 µM) for 30 minutes. The cells were then washed with PBS and then continuously cultured for 24 hours after ECSW treatment before being collected for individual study.
Western blot analysis
The procedure was based on our recent report [15,16]. In details, equal amounts (40 µg) of protein extracts were loaded and separated by SDS-PAGE using 12% acrylamide gradients. After electrophoresis, the separated proteins were transferred electrophoretically to a polyvinylidene difluoride (PVDF) membrane (Amersham Biosciences, Freiburg, Germany). Non-specific sites were blocked by incubation of the membrane in blocking buffer [5% nonfat dry milk in T-TBS (TBS containing 0.05% Tween 20)] overnight. The membranes were incubated with the indicated primary antibodies [Caspase 3 (1: 1000, Cell Signaling, Danvers, MA, USA), poly (ADP-ribose) polymerase (PARP) (1:1000, Cell Signaling), Bax (1:1000, Abcam, Cambridge, MA, USA), matrix metalloproteinase (MMP)-9 (1:5000, Abcam), tumor necrotic factor (TNF)-α (1:1000, Cell Signaling), nuclear factor (NF)-κB (1:600, Abcam), endothelial nitric oxide synthase (eNOS) (1:1000, Abcam), inducible nitric oxide synthase (iNOS) (1:500, Abcam), Bcl-2 (1:1000, Cell Signaling), NOX-1 (1:1500, Sigma-Aldrich, St. Louis, Mo, USA), NOX-2 (1:750, Sigma-Aldrich), and γ-H2AX (1:1000, Cell Signaling)] for 1 hour at room temperature. Horseradish peroxidase-conjugated anti-rabbit immunoglobulin IgG (1:2000, Cell Signaling) was used as the secondary antibody for one-hour incubation at room temperature. The washing procedure was repeated eight times within an hour, and immunoreactive bands were visualized by enhanced chemiluminescence (ECL; Amersham Biosciences) after exposure to Biomax L film (Kodak, Rochester, NY, USA). For the purpose of quantification, ECL signals were digitized using Labwork software (UVP, Waltham, MA, USA).
Measurement of oxidative stress reaction in sciatic nerve
The Oxyblot Oxidized Protein Detection Kit was purchased from Chemicon (S7150). The procedure was according to our recent study [15,16]. DNPH derivatization was carried out on 6 μg of protein for 15 minutes according to manufacturer’s instructions. One-dimensional electrophoresis was carried out on 12% SDS/polyacrylamide gel after DNPH derivatization. Proteins were transferred to nitrocellulose membranes which were then incubated in the primary antibody solution (anti-DNP 1:150) for 2 hours, followed by incubation with secondary antibody solution (1:300) for one hour at room temperature. The washing procedure was repeated eight times within 40 minutes. Immunoreactive bands were visualized by enhanced chemiluminescence (ECL) which was then exposed to Biomax L film (Fuji, Tokyo, Japan). For quantification, ECL signals were digitized using Labwork software (UVP). On each gel, a standard control sample was loaded.
Real-time quantitative PCR analysis
Real-time polymerase chain reaction (RT-PCR) was conducted using LightCycler TaqMan Master (Roche, Mannheim, Germany) in a single capillary tube according to the manufacturer’s guidelines for individual component concentrations as previously reported [6,16]. Forward and reverse primers were each designed based on individual exon of the target gene sequence to avoid amplifying genomic DNA.
During PCR, the probe was hybridized to its complementary single-strand DNA sequence within the PCR target. As amplification occurred, the probe was degraded due to the exonuclease activity of Taq DNA polymerase, thereby separating the quencher from reporter dye during extension. During the entire amplification cycle, light emission increased exponentially. A positive result was determined by identifying the threshold cycle value at which reporter dye emission appeared above background.
Immunohistochemical and immunofluorescent studies
The procedures and protocols for immunohistochemical (IHC) and immunofluorescent (IF) examinations were also described previously [17,18]. Briefly, for IHC staining, rehydrated paraffin sections were first treated with 3% H2O2 for 30 minutes and incubated with Immuno-Block reagent (BioSB, Santa Barbara, CA, USA) for 30 minutes at room temperature. Sections were then incubated with primary antibodies specifically against CD14 and eNOS at 4°C overnight. Irrelevant antibodies and mouse control IgG were used as controls. IF staining was performed using appropriate primary antibody for the examination of F4/80, while irrelevant antibodies were used as controls. For functional vessel evaluation, 150 µg tetramethyl rhodamine isothiocyanate (TRITC)-bandeiraea simplicifolia (BS) 1-lectin (Sigma-Aldrich) was injected via the tail vein 1 h before harvesting the tissue. Three sections of nerve specimens were analyzed in each mouse. For quantification, three randomly selected high power fields (HPFs, 200× for IHC and IF studies) were analyzed in each section. The percentage of positively-stained cells per HPFs for each animal was then determined. For negative control experiments, the primary antibodies were omitted. The sections were counterstained with 4’, 6-Diamidino-2-phenylindole (DAPI) (dilution 1/500) (Sigma-Aldrich) to identify cellular nuclei that reflected the cell number.
Procedure and protocol for measurement of reactive oxygen species (ROS) in sciatic nerve using H2DCFDA dye for staining of sciatic nerve 30 minutes prior to euthanize the animals
The procedure and protocol were based on our previous report [19]. For determining the fluorescent intensity of ROS in sciatic nerve, six additional animals were utilized in each study group. In details, by the end of study period (i.e., 30 min prior to the animal to be euthanized), mice were anesthetized with 2% isoflurane and 150 µg of CM-H2DCFDA (Life Technologies Molecular Probes) (100 μg of H2DCFDA was dissolved in 200 µl PBS) was intravenously administered for each animal. The sciatic nerve was harvested 30 min after CM-H2DCFDA injection and was immediately frozen in liquid nitrogen, and cryostat sections (5 μm) were cut in a cabinet maintained at -20°C. Serial frozen sections were fixed with 4% paraformaldehyde/phosphate buffered saline (PBS) at 4°C for 5 minutes. Sections were washed in PBS and then co-stained with DAPI for fluorescence microscopy analysis.
All sections were examined under fluorescent microscope under a magnification of 200x. Both captured fluorescence and gray photos were assessed by using DP controller 2.1.1.183 (Olympus). Gray photos for measuring the fluorescence intensity were processed by using Image J 1.37v (National Institutes of Health, USA). Three gray photos from each section were randomly obtained, giving a total of nine photos for each animal. As compared with the area of increased fluorescence intensity (IFI), the baseline fluorescence intensity (BFI) [arbitrary unit/400x high-power field (HPF)] was defined as that in myocardium without H2DCFDA. Six BFI areas were measured from each gray photo, from which three BFI areas were randomly chosen. The mean IFI and mean BFI were then calculated. The ratio of IFI to the BFI was determined as the relative fluorescence intensity.
Statistical analysis
Quantitative data are expressed as means ± SD. Statistical analyses were performed using SAS statistical software for Windows version 8.2 (SAS Institute, Cary, NC) to conduct ANOVA followed by Bonferroni multiple-comparison post hoc test. A probability value of less than 0.05 was considered statistically significant.
Results
Inhibitory effect of ECSW on inflammatory reaction, generation of oxidative stress, and apoptosis in RT4-D6P2T cells
As expected, the results of in vitro studies demonstrated that the protein expressions of TNF-α (Figure 1A), NF-κB (Figure 1B), and iNOS (Figure 1C), three indicators of inflammation, did not differ between control group and control + ECSW-treated group. These findings suggest that ECSW treatment did not elicit inflammatory reaction. However, these three biomarkers were significantly higher in menadione-treated group than those in the controls and were significantly reversed after ECSW therapy. On the other hand, the protein expression of eNOS (Figure 1D), an index of anti-inflammation as well as integrity of endothelial function and angiogenesis, was significantly increased in menadione-treated group and further significantly increased in menadione + ECSW-treated group. These findings imply that ECSW possesses anti-inflammatory property. Additionally, RT4-D6P2T cells had intrinsic capacity of eNOS production in response to menadione stimulation.
Figure 1.
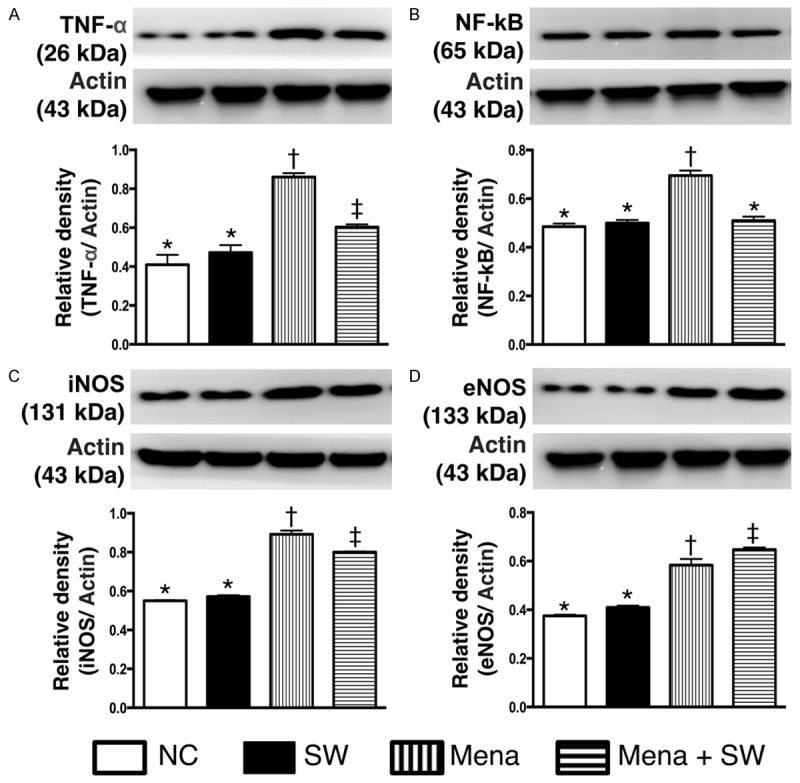
Protein expressions of inflammatory biomarkers undergoing with and without menadione and shock wave treatment (n=6). A. Protein expression of tumor necrosis factor (TNF)-α. * vs. other group with different symbols, p<0.001. B. Protein expression of nuclear factor (NF)-κB. * vs. other group with different symbols, p<0.001. C. Protein expression of inducible nitric oxide synthase (iNOS). * vs. other group with different symbols, p<0.001. D. Protein expression of endothelial nitric oxide synthase (eNOS). * vs. other group with different symbols, p<0.001. All statistical analyses using one-way ANOVA, followed by Bonferroni multiple comparison post hoc test. Symbols (*, †, ‡) indicate significance (at 0.05 level). NC=normal control; SW=shock wave; Mena=menadione.
Consistently, in vitro study showed that the expression of oxidized protein (Figure 2A), an indicator of oxidative stress, and the protein expressions of NOX-1 (Figure 2B) and NOX-2 (Figure 2C), two indices of reactive oxygen species (ROS), were not different between control group and control + ECSW-treated group. These findings, therefore, indicate that ECSW therapy did not augment the generation of ROS and oxidative stress. Conversely, these three biomarkers were significantly increased in menadione-treated group compared with those in the NC group and were significantly reversed after ECSW therapy. These findings supported our hypothesis that ECSW could attenuate the generation of ROS and oxidative stress.
Figure 2.
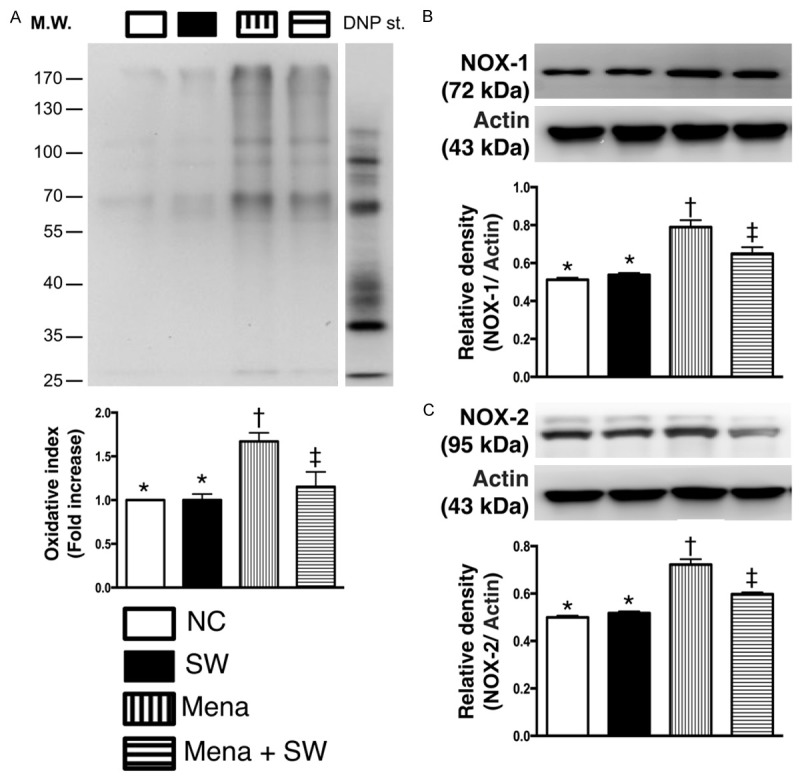
Protein expressions of oxidative stress biomarkers undergoing with and without menadione and shock wave treatment (n=6). A. Oxidized protein expression. * vs. other group with different symbols, p<0.001. (Note: left and right lanes shown on the upper panel represent protein molecular weight marker and control oxidized molecular protein standard, respectively). DNP=1-3 dinitrophenylhydrazone. B. Protein expression of NOX-1. * vs. other group with different symbols, p<0.01. C. Protein expression of NOX-2. * vs. other group with different symbols, p<0.01. All statistical analyses using one-way ANOVA, followed by Bonferroni multiple comparison post hoc test. Symbols (*, †, ‡) indicate significance (at 0.05 level). NC=normal control; SW=shock wave; Mena=menadione.
Furthermore, the protein expressions of Bax (Figure 3A), cleaved caspase 3 (Figure 3B) and cleaved PARP (Figure 3C), three indicators of apoptosis, exhibited no difference between control group and control + ECSW-treated group. These findings once more suggest that ECSW treatment did not enhance apoptosis. However, the expressions of these three parameters were significantly augmented in menadione-treated group compared to that in normal controls and were significantly reversed after ECSW treatment. Additionally, the protein expression of γ-H2AX (Figure 3D), a DNA damage marker, displayed a pattern similar to that of apoptosis among the four groups. Conversely, the protein expression of Bcl-2 (Figure 3E), an index of anti-apoptosis, showed an opposite pattern compared to that of apoptosis among the four groups. These findings again reinforce our hypothesis that ECSW is capable of inhibiting apoptosis and DNA damage.
Figure 3.
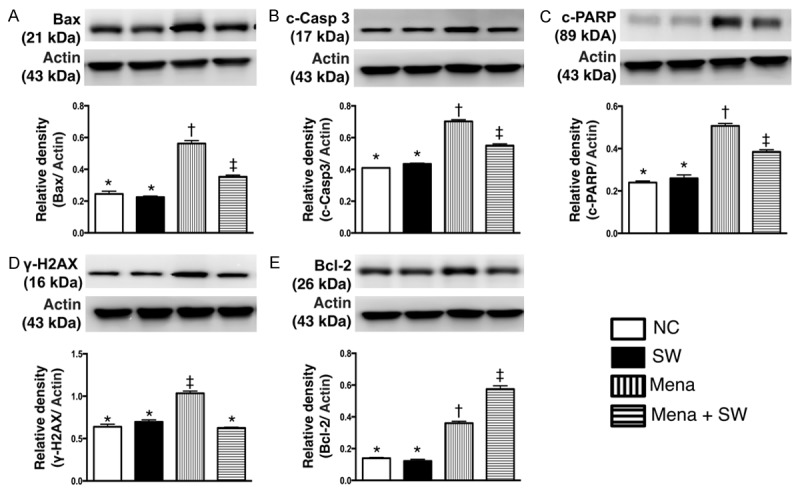
Protein expression of apoptotic, DNA-damaged and anti-apoptotic biomarkers undergoing with and without menadione and shock wave treatment (n=6). A. Protein expression of Bax. * vs. other group with different symbols, p<0.001. B. Protein expression of cleaved caspase 3 (c-Casp 3). * vs. other group with different symbols, p<0.001. C. Protein expression of cleaved poly (ADP-ribose) polymerase (c-PARP). * vs. other group with different symbols, p<0.001. D. Protein expression of γ-H2AX. * vs. other group with different symbols, p<0.01. E. Protein expression of Bcl-2. * vs. other group with different symbols, p<0.001. All statistical analyses using one-way ANOVA, followed by Bonferroni multiple comparison post hoc test. Symbols (*, †, ‡) indicate significance (at 0.05 level). NC=normal control; SW=shock wave; Mena=menadione.
Morphological observation and histopathological changes of sciatic nerve 2 weeks after ECSW treatment (Figure 4)
Figure 4.
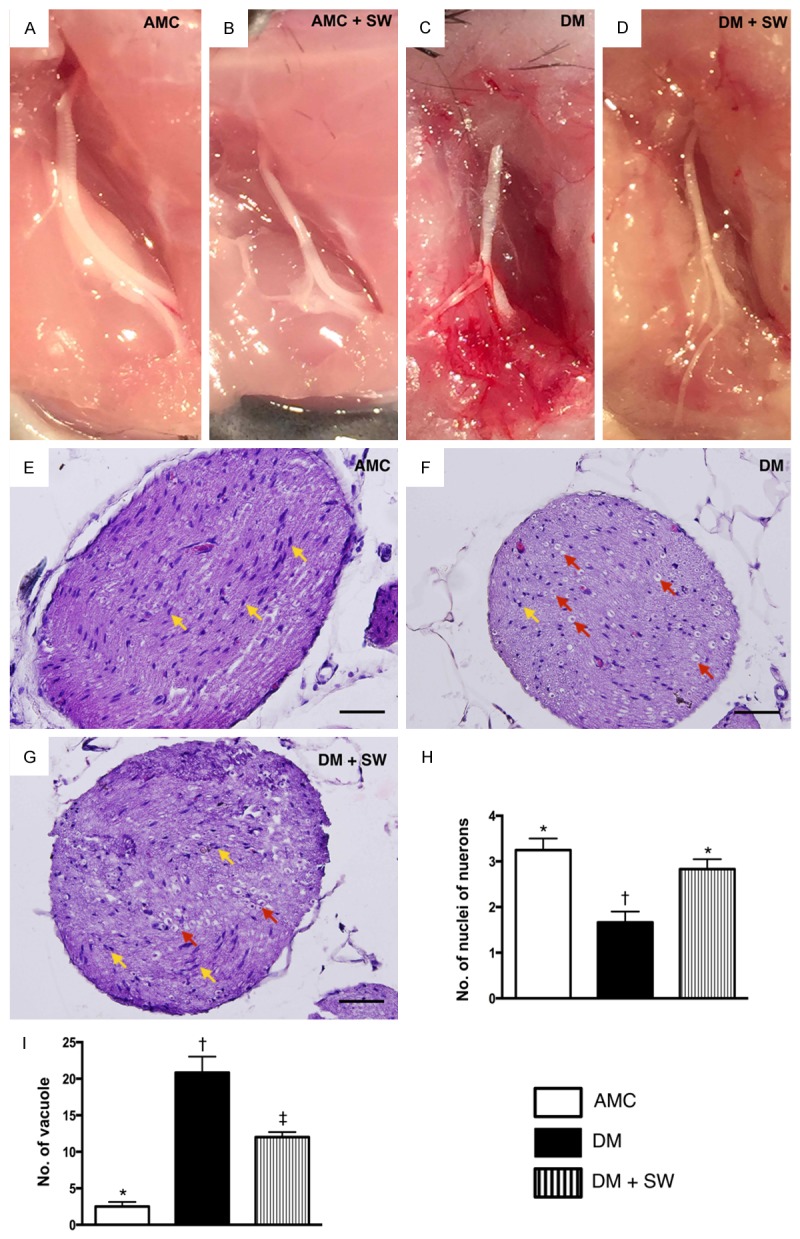
Morphologic appearance of sciatic nerve 2 weeks after extracorporeal shock wave (ECSW) treatment (n=10). A-D. Gross anatomical study demonstrated that the sciatic nerve in AMC + SW, DM and DM + SW groups was grossly intact comparable to that in the AMC group. These findings suggest that the energy dosage of ECSW did not affect the anatomical integrity of sciatic nerve. E-G. Illustrating the microscopic (400x) histopathological finding of sciatic nerve among the three groups of the animals. H. Analytic results of number of nuclei (yellow arrows), * vs. other group with different symbols, p<0.001. I. Analytic results of number of vacuole (red arrows), * vs. other group with different symbols, p<0.0001. The scale bars in right lower corner represent 20 µm. All statistical analyses using one-way ANOVA, followed by Bonferroni multiple comparison post hoc test. Symbols (*, †) indicate significance (at 0.05 level). AMC=aged matched control; DM=diabetes mellitus; SW=shock wave.
Grossly anatomical (Figure 4A-D) observation identified that the sciatic nerves in sham control (i.e., AMC + ECSW), DM and DM + ECSW groups were intact and did not differ as compared to that of the age-matched control (AMC) group. These findings suggest that the energy dosage of ECSW to be used in the present study did not affect the anatomical integrity of sciatic nerve.
H&E staining (Figure 4E-G) showed that the number of nuclei of neurons (Figure 4H) was significantly lower in the DM group than that in the other two groups, and significantly lower in the DM-ECSW group than that in AMC group. The number of vacuole formation around the nucleus (Figure 4I), on the other hand, displayed a pattern opposite to that of the number of nuclei in the sciatic nerve.
Regulatory function of ECSW on mRNA expressions in sciatic nerve 2 weeks after treatment (Figure 5)
Figure 5.
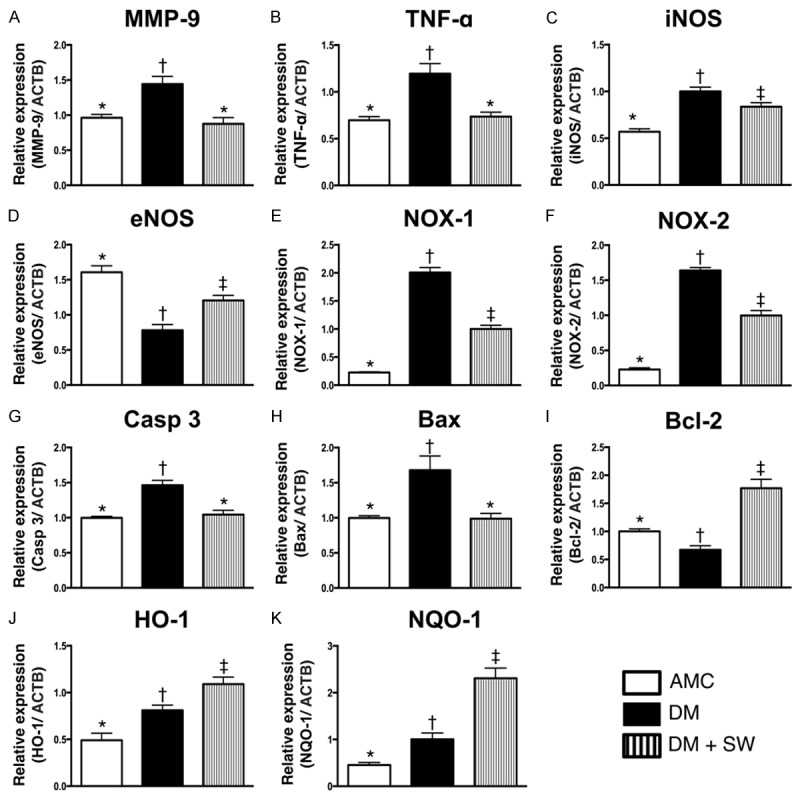
Gene expressions in sciatic nerve 2 weeks after ECSW treatment (n=10). A. The mRNA expressions of matrix metalloproteinase (MMP)-9. * vs. other group with different symbols, p<0.001. B. The mRNA expression of tumor necrosis factor (TNF)-α. * vs. other group with different symbols, p<0.001. C. The mRNA expression of inducible nitric oxide synthase (iNOS). * vs. other group with different symbols, p<0.001. D. The mRNA expression of endothelial nitric oxide synthase (eNOS). * vs. other group with different symbols, p<0.001. E. The mRNA expression of NOX-1. * vs. other group with different symbols, p<0.0001. F. The mRNA expression of NOX-2. * vs. other group with different symbols, p<0.0001. G. The mRNA expression of caspase (Casp) 3. * vs. other group with different symbols, p<0.01. H. The mRNA expression of Bax. * vs. other group with different symbols, p<0.001. I, C. The mRNA expression of Bcl-2. * vs. other group with different symbols, p<0.001. J. The mRNA expression of heme oxygenase (HO)-1. * vs. other group with different symbols, p<0.001. K. The mRNA expression of NAD(P)H quinone oxidoreductase (NQO1). * vs. other group with different symbols, p<0.0001. All statistical analyses using one-way ANOVA, followed by Bonferroni multiple comparison post hoc test. Symbols (*, †, ‡) indicate significance (at 0.05 level). AMC=aged matched control; DM=diabetes mellitus; SW=shock wave.
The mRNA expressions of MMP-9 and TNF-α, two indicators of inflammation, were significantly higher in DM group than those in AMC and DM-ECSW groups, but it showed no difference between the latter two groups. In addition, the mRNA expression of iNOS, another pro-inflammation biomarker, was significantly higher in DM group than that in AMC and DM-ECSW groups, and significantly higher in DM-ECSW group than that in AMC group. On the other hand, the mRNA expression of eNOS, an indicator of anti-inflammation and intact endothelial function, showed an opposite pattern compared to that of iNOS among the three groups.
The mRNA expressions of NOX-1 and NOX-2, two indices of oxidative stress, exhibited a pattern identical to that of iNOS.
The mRNA expressions of caspase 3 and Bax, two apoptotic biomarkers, displayed an identical pattern compared to that of inflammation among the three groups. On the other hand, the mRNA expression of Bcl-2, an anti-apoptotic biomarker, was significantly lower in DM group than that in the other two groups and significantly lower in the AMC group than that in the DM-ECSW group.
The mRNA expressions of heme oxygenease (HO)-1 and NAD(P)H quinone oxidoreductase (NQO1), two indices of anti-oxidants, were significantly lower in the AMC group than that in the other two groups, and significantly lower in the DM group than that in the DM-ECSW group. These findings not only indicate the intrinsic response of sciatic nerve to diabetic stimulation, but also imply that ECSW could enhance anti-oxidative protection against diabetic neuropathy.
ECSW-elicited augmentation of the expressions of myelin sheath and myelin basic protein in sciatic nerve 2 weeks after treatment (Figure 6)
Figure 6.
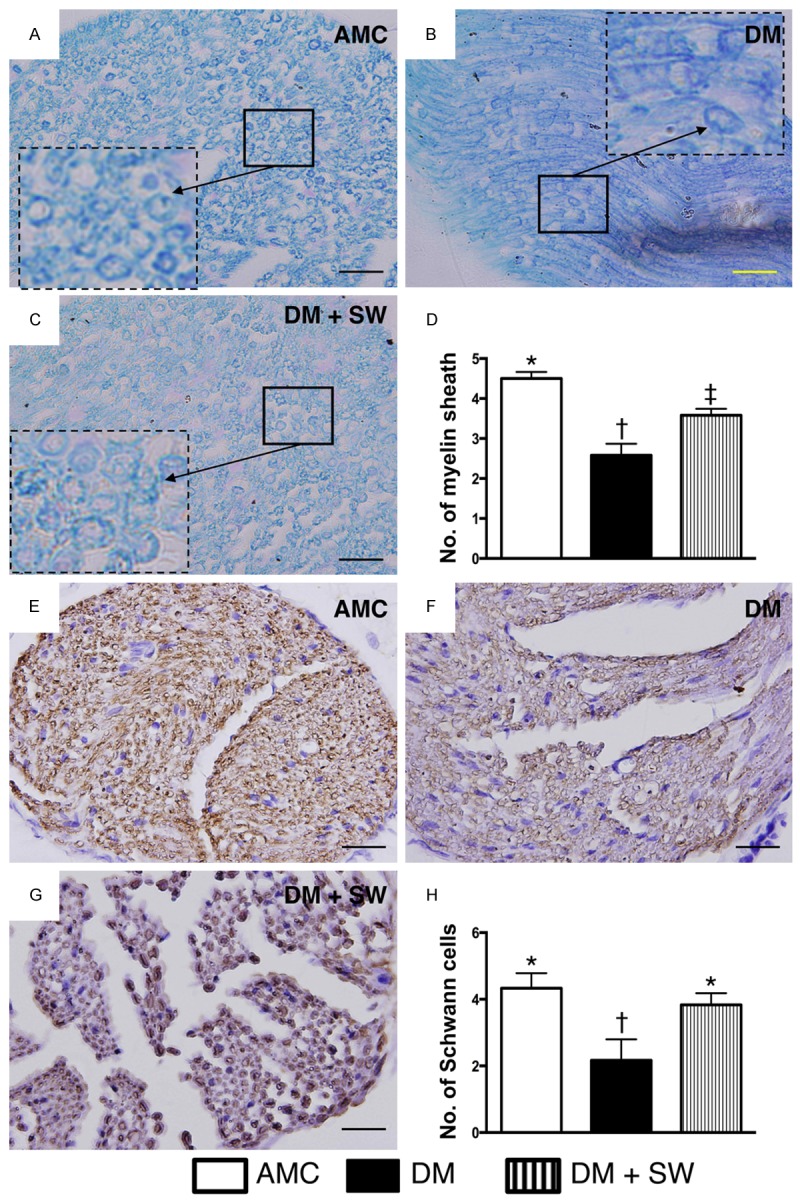
ECSW therapy protected myelin sheath and Schwann cells against diabetic mellitus damage in sciatic nerve (n=10). (A-C) Illustrating the microscopic finding (400x) of Kleihauer-Betke (KB) staining for identifying the number of myelin sheath (black arrows). Smaller solid-line square was magnified as lager dotted-line square for clear identification of myelin sheath in three groups (i.e., A-C), respectively. (D) Statistic analysis for the number of myelin sheath in three groups, * vs. other group with different symbols, p<0.001. (E-G) Illustrating the microscopic finding (400x) of immunohistochemical staining (i.e., staining of myelin basic protein) for identification of number of Schwann cells (dark-gray color) in sciatic nerve. (H) Statistic analysis for the number of Schwann cell in three groups, * vs. other group with different symbols, p<0.001. The scale bars in right lower zcorner represent 20 µm. All statistical analyses using one-way ANOVA, followed by Bonferroni multiple comparison post hoc test. Symbols (*, †, ‡) indicate significance (at 0.05 level). AMC=aged matched control; DM=diabetes mellitus; SW=shock wave.
Kleihauer-Betke (KB) staining (i.e., acid elusion test) demonstrated that the number of myelin sheath was significantly lower in the DM group than that in AMC and DM-ECSW groups, and significantly lower in DM-ECSW group than that in AMC group. Additionally, staining of myelin basic protein showed that the number of positively strained myelin sheath of Schwann cells displayed a pattern identical to that of KB staining among the three groups.
ECSW-induced vascular endothelialization and enhancement of eNOS expression 2 weeks after treatment (Figure 7)
Figure 7.
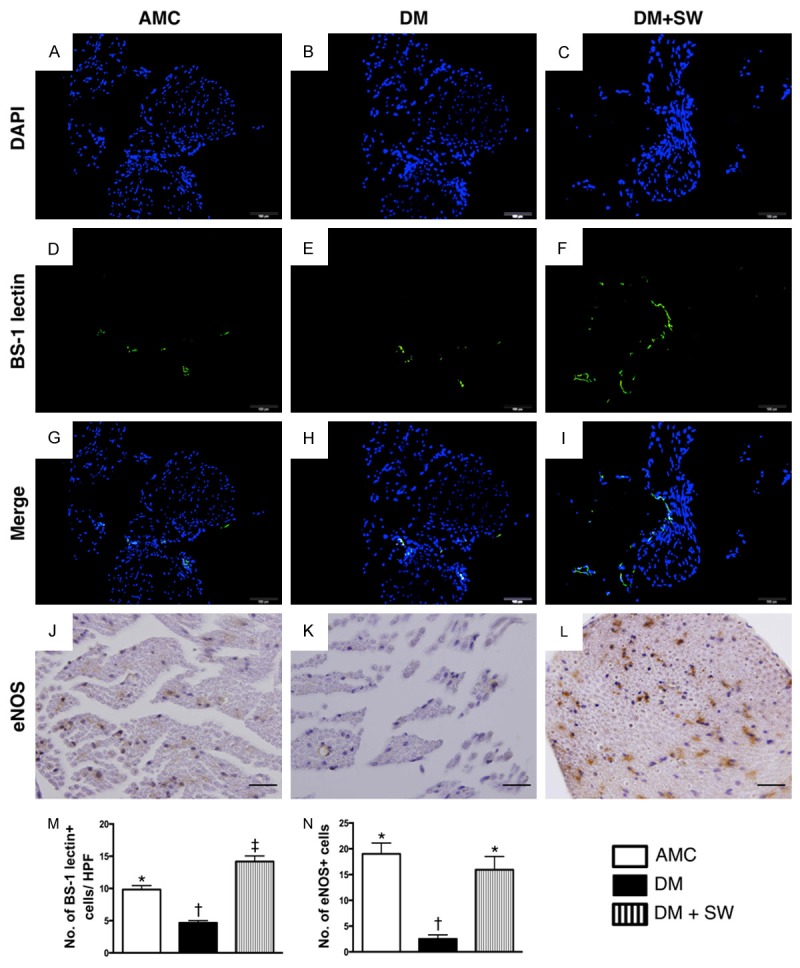
ECSW therapy augmented the expression of angiogenesis within the sciatic nerve (n=10). (A-H) Illustrating immunofluorecent (IF) microscopic findings (400x), including DAPI (A-C), Bandeirea simplicifolia agglutinin-1 (BS-1) lectin IF staining (D-F) and merge (G to H) for the identification of vascular endothelialization surrounding the sciatic nerve. (M) Statistic analysis for the number of BS-1 lectin+ cells in three groups, * vs. other group with different symbols, p<0.001. (J-L) Illustrating the microscopic findings (400x) of immunohistochemical staining for identifying the number of eNOS+ cells in sciatic nerve (gray color). (N) Statistic analysis for the number of eNOS+ cells in three groups, * vs. other group with different symbols, p<0.001. The scale bars in right lower corner represent 20 µm. All statistical analyses using one-way ANOVA, followed by Bonferroni multiple comparison post hoc test. Symbols (*, †, ‡) indicate significance (at 0.05 level). AMC= aged matched control; DM=diabetes mellitus; SW=shock wave. HPF=high-power field.
The Bandeirea simplicifolia agglutinin-1 (BS-1) lectin IF staining for the identification of vascular endothelium surrounding the sciatic nerve showed that the number of endothelial cells was significantly lower in the DM group than that in AMC and DM-ECSW groups, and significantly lower AMC group than in the DM-ECSW group. Moreover, IHC staining revealed that the changes in the number of eNOS+ cells, an indictor of angiogenesis/vasorelaxation, showed a pattern identical to that of BS-1 lectin staining among the three groups.
Suppressive effect of ECSW on the inflammatory cell infiltration in sciatic nerve 2 weeks after treatment (Figure 8)
Figure 8.
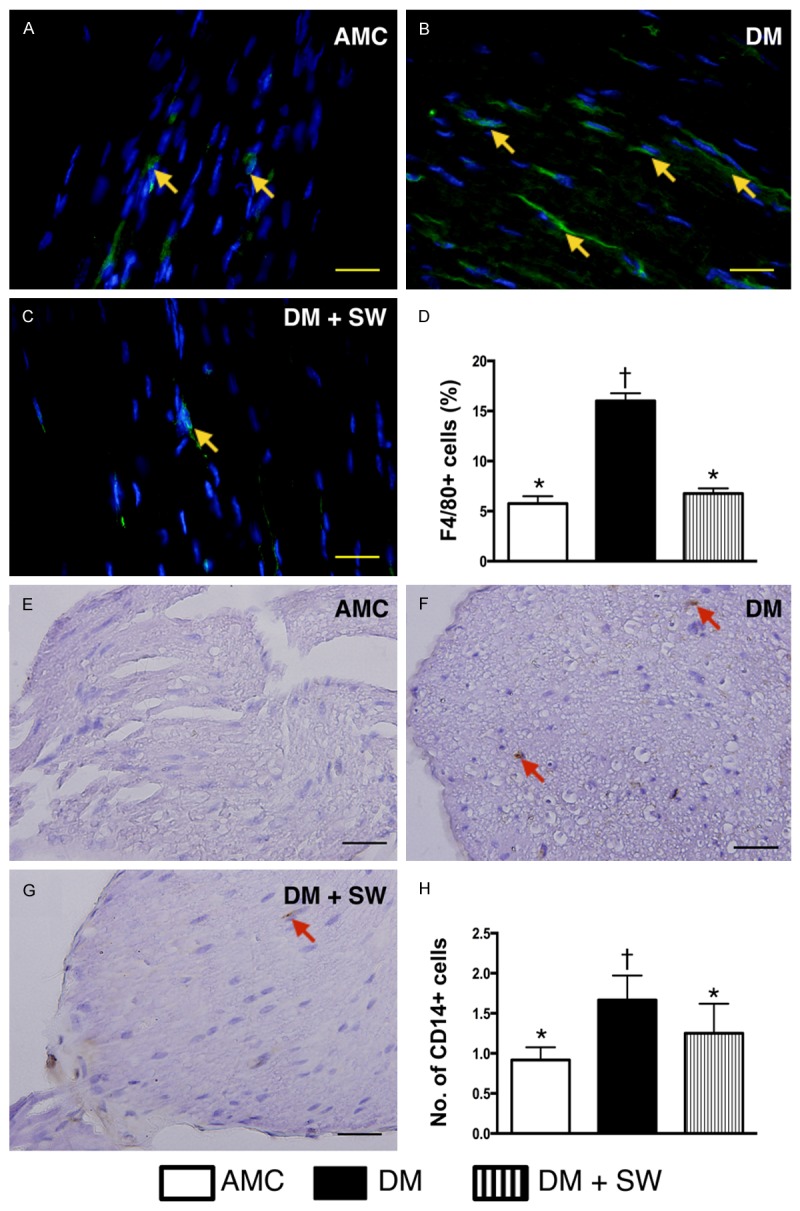
ECSW therapy suppressed the inflammatory cell infiltration in sciatic nerve (n=10). A-C. Illustration of immunofluorescent microscopic (400x) finding of F4/80+ cells (yellow arrows) in sciatic nerve. D. Analytical result of number of F4/80+ cells, * vs. other group with different symbols, p<0.001. E-G. Illustration of imunohistochemical microscopic (400x) finding of CD14+ cells (red arrows) in sciatic nerve. H. Analytical result of number of CD14+ cells, * vs. other group with different symbols, p<0.001. The scale bars in right lower corner represent 20 µm. All statistical analyses using one-way ANOVA, followed by Bonferroni multiple comparison post hoc test. Symbols (*, †) indicate significance (at 0.05 level). AMC=aged matched control; DM=diabetes mellitus; SW=shock wave.
The IF microscopy showed that the number of F4/80+ cells, an indicator of macrophage infiltration in sciatic nerve, was significantly higher in the DM group than that in the other two groups, and significantly higher in DM-ECSW groups than that in AMC group. Additionally, IHC staining demonstrated that changes in the number of infiltrating CD14+ cells in sciatic nerve, another pro-inflammation biomarker, exhibited a pattern similar to that of F4/80+ cells among the three groups.
The expression of fluorescent intensity of reactive oxygen species was markedly suppressed in sciatic nerve 2 weeks after ECSW treatment (Figure 9)
Figure 9.
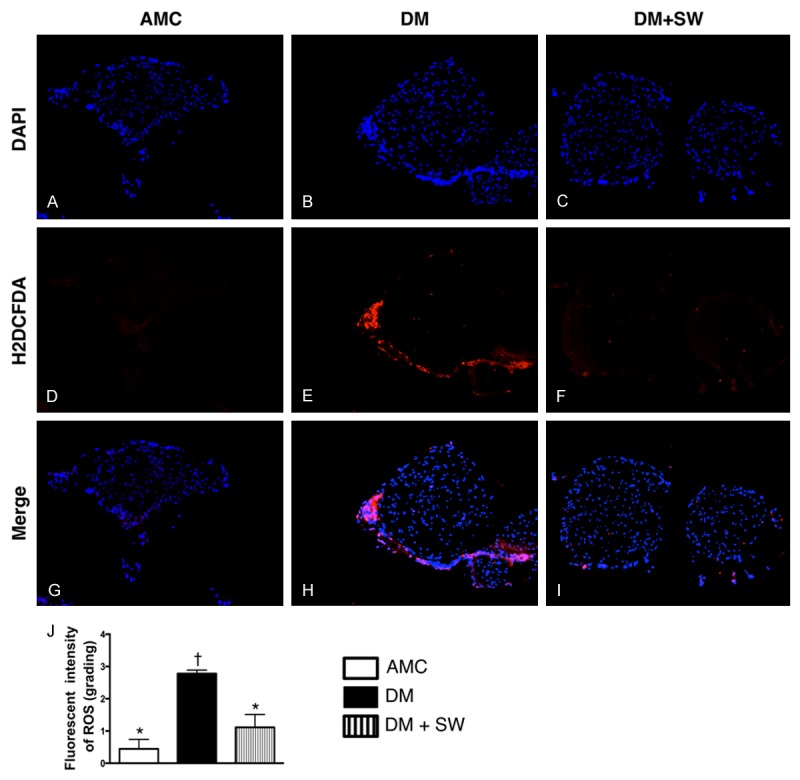
ECSW therapy suppressed the expression of ROS in sciatic never of live mice (n=10). (A-I) Immunofluorescent microscopic findings (200x), including DAPI (A-C), 2’,7’-dichlorodihydrofluorescin diacetate (H2DCFDA) stain (D-F) and merge (G-I) for identifying the reactive oxygen species (ROS) generation (green color) in sciatic nerve. (J) Analytic results of fluorescent intensity, p<0.0001, * vs. other groups with different symbols (*, †). Scale bars in right lower corner represent 50 µm. All statistical analyses using one-way ANOVA, followed by Bonferroni multiple comparison post hoc test. Symbols (*, †) indicate significance (at 0.05 level). AMC=aged matched control; DM=diabetes mellitus; SW=shock wave.
To assess the role of ECSW therapy in ROS expression in sciatic nerve, the fluorescent intensity was quantified using H2DCFDA labeling of sciatic nerve. As expected, the relative fluorescence intensity was significantly increased in DM group than in AMC and DM-ECSW groups, and significantly higher in DM-ECSW group than in AMC group.
ECSW therapy effectively suppressed the expression of γ-H2AX in sciatic nerve (Figure 10)
Figure 10.
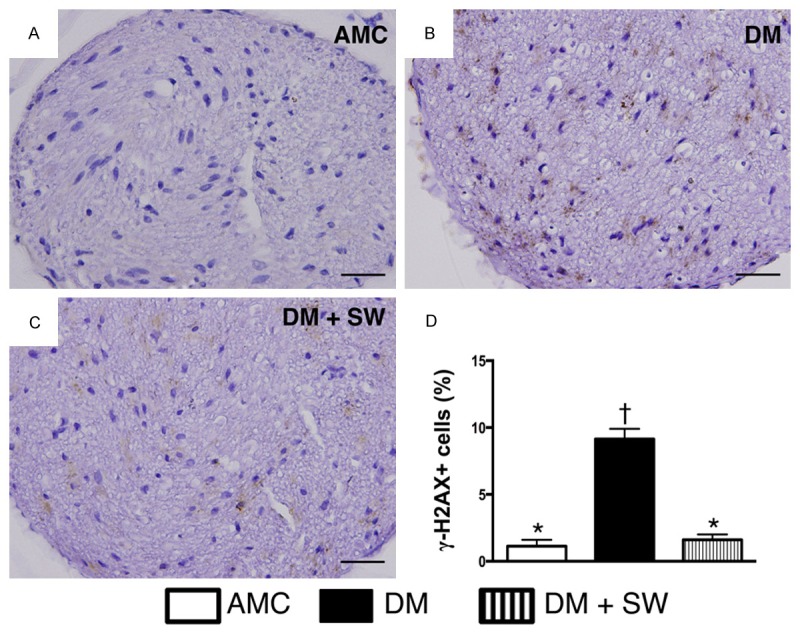
ECSW therapy attenuated the expression of DNA damaged biomarker in sciatic nerve (n=10). A-C. Microscopic finding (400x) of immunohistochemical (IHC) staining for identification of γ-H2AX (gray color). D. Analytic results of IHC, p<0.0001, * vs. other groups with different symbols (*, †). Scale bars in right lower corner represent 20 µm. All statistical analyses using one-way ANOVA, followed by Bonferroni multiple comparison post hoc test. Symbols (*, †) indicate significance (at 0.05 level). AMC=aged matched control; DM=diabetes mellitus; SW=shock wave.
The result of IHC staining showed that the number of γ-H2AX in the sciatic nerve, an indicator of DNA damaged biomarker, was significantly higher in DM group than in DM-ECSW and AMC groups, and significantly higher in DM-ECSW group than in AMC group.
Discussion
This study, which investigated the neural protective effect of ECSW against DM-associated neuropathy, yielded several striking implications. First, diabetic neuropathy was identified in leptin-deficient (ob/ob) mice. Second, in vitro and in vivo studies showed that ECSW treatment inhibited inflammation as well as reactive oxygen species generation and oxidative stress. Third, ECSW therapy protected sciatic nerve from diabetic neuropathy.
One important finding in the present study is that not only did ECSW treatment markedly inhibit inflammatory reaction and the generation of oxidative stress in cultured schwannoma cells, but it also substantially attenuated apoptosis and DNA damage. Consistently, the expressions of anti-inflammatory and anti-apoptotic biomarkers were significantly upregulated in the cultured schwannoma cells after ECSW therapy. Interestingly, the findings are consistent with those of our recent report demonstrating that ECSW treatment effectively suppressed lipopolysaccharide (LPS)-induced inflammation and oxidative stress in bone marrow-derived mononuclear cells [12]. Of importance is that, as compared with control group, ECSW did not elicit adverse effects both on the cultured cells and the anatomical integrity of sciatic nerve. Accordingly, these findings suggest that ECSW with 200 impulses at 0.12 mJ/mm2 is a safe and effective treatment regimen in the present experimental setting.
Another important finding in the present study is that the number of myelin sheath and the number of vacuole formation around the nuclei of neurons were substantially higher in 23-week-old leptin-deficient (ob/ob) mice than those in the age-matched WT mice. Conversely, the number of nuclei of neurons in sciatic nerve was significantly reduced in ob/ob mice compared to that in WT mice. These findings supported that diabetic neuropathy was already present in ob/ob mice and elicited the damage to the sciatic nerve (i.e., diabetic neuropathy). Indeed, previous study has demonstrated the presence of diabetic neuropathy in 11-week-old ob/ob mice [14]. Importantly, these parameters were significantly reversed in ob/ob mice after ECSW treatment, suggesting that ECSW therapy protected the sciatic nerve against diabetic neuropathy.
Our previous study has shown that inflammation and oxidative stress were remarkably enhanced in obese mice with hyperglycemia [20]. An essential finding in the present study is that the mRNA expressions of pro-inflammation biomarkers and the generation of oxidative stress were remarkably augmented in sciatic nerve of ob/ob mice. Accordingly, significant infiltration of inflammatory cells was noted in the sciatic nerves of these animals. Our findings in the current study, therefore, reinforce those of our previous study [20]. Furthermore, another essential finding in the present study is that, as compared with the WT controls, the mRNA expression of pro-apoptosis markers in sciatic nerve in ob/ob mice was notably enhanced, whereas those of anti-inflammation and endogenous anti-oxidative markers were notably suppressed. However, these molecular (i.e., gene expressions) and cellular (i.e., inflammatory cells) perturbations in sciatic nerve were significantly reversed in ob/ob mice after ECSW treatment. These findings again support that ECSW effectively protected the sciatic nerve from apoptosis possibly through the suppression of inflammation and oxidative stress.
Associations among endothelial dysfunction, obesity, and diabetes mellitus have been extensively investigated [21-23]. The principal finding in the present study is that, as compared with the WT controls, the numbers of endothelial cells and eNOS+ cells were notably reduced in the sciatic nerve of ob/ob mice. The finding, therefore, may explain the predisposition of ob/ob mice to diabetic neuropathy. Of distinctive importance is that the numbers of endothelial cells and eNOS+ cells were significantly enhanced in ob/ob mice after ECSW therapy. Such endothelium-enhancing effect may also partly account for ECSW-elicited protective effect against diabetes-associated neural damage.
Study limitation
This study has limitations. First, without sensory or motor examination of the sciatic nerve, the results of this study did not provide information on functional recovery from diabetic neuropathy in ob/ob mice after ECSW treatment. Second, despite extensive work in the present study, the exact mechanism underlying the observed protective effects of ECSW against diabetic neuropathy remains unclear.
In conclusion, the results of the present study demonstrated that ECSW treatment effectively ameliorated diabetic neuropathy in a murine experimental setting. This finding may imply the therapeutic potential of ECSW in clinical diabetic neuropathy.
Acknowledgements
This study was supported by a program grant from Chang Gung Memorial Hospital, Chang Gung University (Grant number: CMRPG-891521).
Disclosure of conflict of interest
The authors report no conflict of interest.
Author’s contribution
YLC, SFK and HKY participated in the design of the study, data acquisition and analysis as well as drafting the manuscript. KHC, TCY, THH, SYC, PHDfd, MST and CHC were responsible for the laboratory assay and troubleshooting. YLC, THH, HWC, KCL and HKY participated in data acquisition, analysis, and interpretation. SFK and HKY conceived of the study, and participated in its design and coordination and helped to draft the manuscript. All authors read and approved the final manuscript.
References
- 1.Lin WH, Hsu CH, Chen HF, Liu CC, Li CY. Mortality of patients with type 2 diabetes in Taiwan: a 10-year nationwide follow-up study. Diabetes Res Clin Pract. 2015;107:178–186. doi: 10.1016/j.diabres.2014.09.021. [DOI] [PubMed] [Google Scholar]
- 2.Neumann A, Schoffer O, Norstrom F, Norberg M, Klug SJ, Lindholm L. Health-related quality of life for pre-diabetic states and type 2 diabetes mellitus: a cross-sectional study in Vasterbotten Sweden. Health Qual Life Outcomes. 2014;12:150. doi: 10.1186/s12955-014-0150-z. [DOI] [PMC free article] [PubMed] [Google Scholar]
- 3.IDF. Diabetes Atlas. Online version of IDF Diabetes Atlas: http://www.idf.org/diabetesatlas. ISBN: 2-930229-85-3: International Diabetes Federation, 2013.
- 4.Holzmann MJ, Rathsman B, Eliasson B, Kuhl J, Svensson AM, Nystrom T, Sartipy U. Longterm prognosis in patients with type 1 and 2 diabetes mellitus after coronary artery bypass grafting. J Am Coll Cardiol. 2015;65:1644–1652. doi: 10.1016/j.jacc.2015.02.052. [DOI] [PubMed] [Google Scholar]
- 5.Barn R, Waaijman R, Nollet F, Woodburn J, Bus SA. Predictors of barefoot plantar pressure during walking in patients with diabetes, peripheral neuropathy and a history of ulceration. PLoS One. 2015;10:e0117443. doi: 10.1371/journal.pone.0117443. [DOI] [PMC free article] [PubMed] [Google Scholar]
- 6.Chen YT, Yang CC, Sun CK, Chiang HJ, Chen YL, Sung PH, Zhen YY, Huang TH, Chang CL, Chen HH, Chang HW, Yip HK. Extracorporeal shock wave therapy ameliorates cyclophosphamide-induced rat acute interstitial cystitis though inhibiting inflammation and oxidative stress-in vitro and in vivo experiment studies. Am J Transl Res. 2014;6:631–648. [PMC free article] [PubMed] [Google Scholar]
- 7.Rompe JD, Decking J, Schoellner C, Nafe B. Shock wave application for chronic plantar fasciitis in running athletes. A prospective, randomized, placebo-controlled trial. Am J Sports Med. 2003;31:268–275. doi: 10.1177/03635465030310021901. [DOI] [PubMed] [Google Scholar]
- 8.Rompe JD, Zoellner J, Nafe B. Shock wave therapy versus conventional surgery in the treatment of calcifying tendinitis of the shoulder. Clin Orthop Relat Res. 2001:72–82. doi: 10.1097/00003086-200106000-00010. [DOI] [PubMed] [Google Scholar]
- 9.Wang L, Qin L, Lu HB, Cheung WH, Yang H, Wong WN, Chan KM, Leung KS. Extracorporeal shock wave therapy in treatment of delayed bone-tendon healing. Am J Sports Med. 2008;36:340–347. doi: 10.1177/0363546507307402. [DOI] [PubMed] [Google Scholar]
- 10.Aicher A, Heeschen C, Sasaki K, Urbich C, Zeiher AM, Dimmeler S. Low-energy shock wave for enhancing recruitment of endothelial progenitor cells: a new modality to increase efficacy of cell therapy in chronic hind limb ischemia. Circulation. 2006;114:2823–2830. doi: 10.1161/CIRCULATIONAHA.106.628623. [DOI] [PubMed] [Google Scholar]
- 11.Shao PL, Chiu CC, Yuen CM, Chua S, Chang LT, Sheu JJ, Sun CK, Wu CJ, Wang CJ, Yip HK. Shock wave therapy effectively attenuates inflammation in rat carotid artery following endothelial denudation by balloon catheter. Cardiology. 2010;115:130–144. doi: 10.1159/000262331. [DOI] [PubMed] [Google Scholar]
- 12.Sheu JJ, Lee FY, Yuen CM, Chen YL, Huang TH, Chua S, Chen YL, Chen CH, Chai HT, Sung PH, Chang HW, Sun CK, Yip HK. Combined therapy with shock wave and autologous bone marrow-derived mesenchymal stem cells alleviates left ventricular dysfunction and remodeling through inhibiting inflammatory stimuli, oxidative stress & enhancing angiogenesis in a swine myocardial infarction model. Int J Cardiol. 2015;193:69–83. doi: 10.1016/j.ijcard.2015.03.044. [DOI] [PubMed] [Google Scholar]
- 13.Sheu JJ, Chang LT, Chiang CH, Sun CK, Chang NK, Youssef AA, Wu CJ, Lee FY, Yip HK. Impact of diabetes on cardiomyocyte apoptosis and connexin43 gap junction integrity: role of pharmacological modulation. Int Heart J. 2007;48:233–245. doi: 10.1536/ihj.48.233. [DOI] [PubMed] [Google Scholar]
- 14.Drel VR, Mashtalir N, Ilnytska O, Shin J, Li F, Lyzogubov VV, Obrosova IG. The leptin-deficient (ob/ob) mouse: a new animal model of peripheral neuropathy of type 2 diabetes and obesity. Diabetes. 2006;55:3335–3343. doi: 10.2337/db06-0885. [DOI] [PubMed] [Google Scholar]
- 15.Yeh KH, Sheu JJ, Lin YC, Sun CK, Chang LT, Kao YH, Yen CH, Shao PL, Tsai TH, Chen YL, Chua S, Leu S, Yip HK. Benefit of combined extracorporeal shock wave and bone marrow-derived endothelial progenitor cells in protection against critical limb ischemia in rats. Crit Care Med. 2012;40:169–177. doi: 10.1097/CCM.0b013e31822d74d0. [DOI] [PubMed] [Google Scholar]
- 16.Yip HK, Chang YC, Wallace CG, Chang LT, Tsai TH, Chen YL, Chang HW, Leu S, Zhen YY, Tsai CY, Yeh KH, Sun CK, Yen CH. Melatonin treatment improves adipose-derived mesenchymal stem cell therapy for acute lung ischemia-reperfusion injury. J Pineal Res. 2013;54:207–221. doi: 10.1111/jpi.12020. [DOI] [PubMed] [Google Scholar]
- 17.Sun CK, Lee FY, Kao YH, Chiang HJ, Sung PH, Tsai TH, Lin YC, Leu S, Wu YC, Lu HI, Chen YL, Chung SY, Su HL, Yip HK. Systemic combined melatonin-mitochondria treatment improves acute respiratory distress syndrome in the rat. J Pineal Res. 2015;58:137–150. doi: 10.1111/jpi.12199. [DOI] [PubMed] [Google Scholar]
- 18.Sun CK, Leu S, Hsu SY, Zhen YY, Chang LT, Tsai CY, Chen YL, Chen YT, Tsai TH, Lee FY, Sheu JJ, Chang HW, Yip HK. Mixed serum-deprived and normal adipose-derived mesenchymal stem cells against acute lung ischemia-reperfusion injury in rats. Am J Transl Res. 2015;7:209–231. [PMC free article] [PubMed] [Google Scholar]
- 19.Sung PH, Sun CK, Ko SF, Chang LT, Sheu JJ, Lee FY, Wu CJ, Chua S, Yip HK. Impact of hyperglycemic control on left ventricular myocardium. A molecular and cellular basic study in a diabetic rat model. Int Heart J. 2009;50:191–206. doi: 10.1536/ihj.50.191. [DOI] [PubMed] [Google Scholar]
- 20.Wang HT, Liu CF, Tsai TH, Chen YL, Chang HW, Tsai CY, Leu S, Zhen YY, Chai HT, Chung SY, Chua S, Yen CH, Yip HK. Effect of obesity reduction on preservation of heart function and attenuation of left ventricular remodeling, oxidative stress and inflammation in obese mice. J Transl Med. 2012;10:145. doi: 10.1186/1479-5876-10-145. [DOI] [PMC free article] [PubMed] [Google Scholar]
- 21.Chen YL, Chang CL, Sun CK, Wu CJ, Tsai TH, Chung SY, Chua S, Yeh KH, Leu S, Sheu JJ, Lee FY, Yen CH, Yip HK. Impact of obesity control on circulating level of endothelial progenitor cells and angiogenesis in response to ischemic stimulation. J Transl Med. 2012;10:86. doi: 10.1186/1479-5876-10-86. [DOI] [PMC free article] [PubMed] [Google Scholar]
- 22.Paneni F, Costantino S, Battista R, Castello L, Capretti G, Chiandotto S, Scavone G, Villano A, Pitocco D, Lanza G, Volpe M, Luscher TF, Cosentino F. Adverse epigenetic signatures by histone methyltransferase Set7 contribute to vascular dysfunction in patients with type 2 diabetes mellitus. Circ Cardiovasc Genet. 2015;8:150–158. doi: 10.1161/CIRCGENETICS.114.000671. [DOI] [PubMed] [Google Scholar]
- 23.Pek SL, Tavintharan S, Wang X, Lim SC, Woon K, Yeoh LY, Ng X, Liu J, Sum CF. Elevation of a novel angiogenic factor, leucine-rich-alpha2-glycoprotein (LRG1), is associated with arterial stiffness, endothelial dysfunction, and peripheral arterial disease in patients with type 2 diabetes. J Clin Endocrinol Metab. 2015;100:1586–1593. doi: 10.1210/jc.2014-3855. [DOI] [PubMed] [Google Scholar]


