Abstract
Rationale: Subglottic edema and acquired subglottic stenosis are potentially airway-compromising sequelae in neonates following endotracheal intubation. At present, no imaging modality is capable of in vivo diagnosis of subepithelial airway wall pathology as signs of intubation-related injury.
Objectives: To use Fourier domain long-range optical coherence tomography (LR-OCT) to acquire micrometer-resolution images of the airway wall of intubated neonates in a neonatal intensive care unit setting and to analyze images for histopathology and airway wall thickness.
Methods: LR-OCT of the neonatal laryngotracheal airway was performed a total of 94 times on 72 subjects (age, 1–175 d; total intubation, 1–104 d). LR-OCT images of the airway wall were analyzed in MATLAB. Medical records were reviewed retrospectively for extubation outcome.
Measurements and Main Results: Backward stepwise regression analysis demonstrated a statistically significant association between log(duration of intubation) and both laryngeal (P < 0.001; multiple r2 = 0.44) and subglottic (P < 0.001; multiple r2 = 0.55) airway wall thickness. Subjects with positive histopathology on LR-OCT images had a higher likelihood of extubation failure (odds ratio, 5.9; P = 0.007). Longer intubation time was found to be significantly associated with extubation failure.
Conclusions: LR-OCT allows for high-resolution evaluation and measurement of the airway wall in intubated neonates. Our data demonstrate a positive correlation between laryngeal and subglottic wall thickness and duration of intubation, suggestive of progressive soft tissue injury. LR-OCT may ultimately aid in the early diagnosis of postintubation subglottic injury and help reduce the incidences of failed extubation caused by subglottic edema or acquired subglottic stenosis in neonates.
Clinical trial registered with www.clinicaltrials.gov (NCT 00544427).
Keywords: optical coherence tomography, neonate, diagnostic imaging, intubation injury, subglottic stenosis
At a Glance Commentary
Scientific Knowledge on the Subject
In the neonatal population, airway-compromising subglottic edema and acquired subglottic stenosis are potentially life-threatening sequelae of short- and long-term endotracheal intubation, respectively. At present, no technology is capable of in vivo diagnostic imaging of subepithelial markers of subglottic injury. Optical coherence tomography (OCT) is a novel, minimally invasive imaging modality that acquires micrometer-resolution cross-sectional images of biologic tissue.
What This Study Adds to the Field
We constructed a swept source Fourier domain long-range OCT (LR-OCT) system to image the laryngotracheal airway in intubated neonates in a neonatal intensive care unit setting. LR-OCT images revealed substructural changes within the subglottic mucosa and submucosa. Quantitative image analysis demonstrated a positive correlation between duration of intubation and airway wall thickness in the larynx and subglottis, suggestive of progressive soft tissue injury. LR-OCT may ultimately serve as a means for critical care specialists to monitor the intubated neonatal airway for early histopathologic markers of subglottic injury and potentially reduce the incidences of airway-compromising subglottic edema and acquired subglottic stenosis.
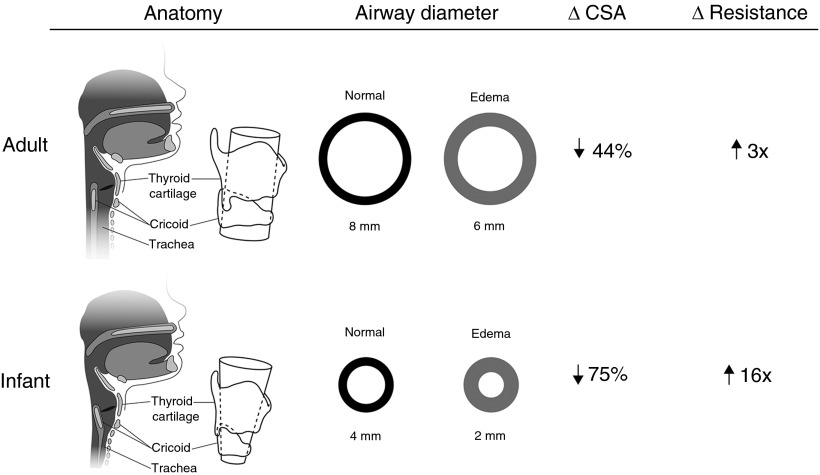
Subglottic injury following endotracheal intubation of the neonate presents a significant diagnostic challenge for the neonatologist and otolaryngologist (1). The neonatal subglottis is uniquely predisposed to postintubation mucosal edema and ischemia because of the friable subglottic mucosa and intraluminal constriction by the complete cricoid ring (Figure 1) (2, 3). Occult subglottic inflammation may manifest as airway-compromising edema within minutes of extubation, often necessitating emergent reintubation. Meanwhile, an estimated 1–2% of intubated neonates develop irreversible fibrosis during the course of long-term intubation (1, 4, 5). Many of these cases remain undiagnosed until life-threatening, high-grade subglottic stenosis (SGS) is identified during surgical endoscopy.
Figure 1.
Comparative cross-sectional anatomy and airflow of mature pediatric and adult versus neonatal upper airways. One millimeter of circumferential subglottic edema in the adult and infant upper airways causes 44% and 75% reduction in cross-sectional area (CSA), respectively. Resistance to laminar airflow increases by a factor of 3 in adults and by a factor of 16 in infants.
At present, no standardized imaging modality is capable of definitive, in vivo diagnosis of subglottic edema and subepithelial precursors of fibrosis. The predictive value of the endotracheal tube (ETT) air leak test for postextubation reactive edema and stridor in neonates is disputed (6, 7). Computed tomography exposes neonates to ionizing radiation (8) and, along with magnetic resonance imaging, lacks adequate spatial resolution to characterize microanatomy (9, 10). Direct laryngoscopy with bronchoscopy (DLB) remains the gold standard for diagnosis of SGS, but is limited to a surface view of the mucosa. Furthermore, DLB of the neonate involves substantial risk for hypoxia and loss of a secure airway, and is therefore not tenable as a screening measure or serial evaluation technique for neonatal subglottic disease.
Optical coherence tomography (OCT) is a minimally invasive diagnostic imaging modality that acquires high-resolution (10–15 μm) cross-sectional images of biologic tissue with up to 1- to 2-mm optical penetration depth (11). OCT evaluation and measurement of airway wall microanatomy has been validated with comparative computed tomography (12) and histology (13–17). Previous reports describe OCT imaging of postintubation subglottic injury in ex vivo animal models (17, 18) and intubated neonates (19). However, these early OCT systems were limited by slow speeds (0.33 Hz) and near-contact imaging (17, 19), or radial scanning with short working distances (<5 mm) (18). Fourier domain long-range OCT (LR-OCT, or “anatomic” OCT) features greater diagnostic sensitivity and higher imaging speeds (25–50 Hz) than early time-domain OCT systems (20, 21) and extended axial range up to 30 mm, allowing for endoscopic, 360° mapping of the intraluminal geometry of the upper airway (22–27). Our group recently demonstrated the feasibility of LR-OCT imaging of subglottic injury in the intubated rabbit airway (28) and normal subglottic microanatomy in intubated pediatric patients (ages 2–16 yr) in the operating room (29), setting the stage for the current study.
We constructed an LR-OCT system to image the intubated neonatal airway in the neonatal intensive care unit (NICU) setting. The objectives of this study were to use LR-OCT to characterize the microarchitecture of the neonatal subglottis and to quantify changes in airway wall morphology with prolonged intubation. This is the first prospective study of in vivo LR-OCT imaging of the neonatal airway. Some of the results of this study have been previously reported in an abstract (30).
Methods
Subjects
We conducted a prospective clinical trial to evaluate LR-OCT of the laryngotracheal airway in intubated neonates (n = 72). The inclusion criteria included any newborn admitted to the NICU who required endotracheal intubation for mechanical ventilation. Patients less than 28 weeks gestational age (GA) and less than 5 days old were excluded, given the risk of intraventricular hemorrhage in preterm neonates with respiratory distress syndrome. Patient GA at birth, post-menstrual age (PMA; GA plus chronologic age), weight, total duration of intubation, and ETT size were recorded for each case. At completion of the study, medical records were retrospectively reviewed for extubation outcome, number of prior intubation attempts, history of traumatic intubations, gastroesophageal reflux, and DLB results (if performed). This study was approved by the human subjects Institutional Review Boards at the University of California Irvine and CHOC Children’s Hospital of Orange County. All subjects’ families provided written informed consent for participation.
LR-OCT System
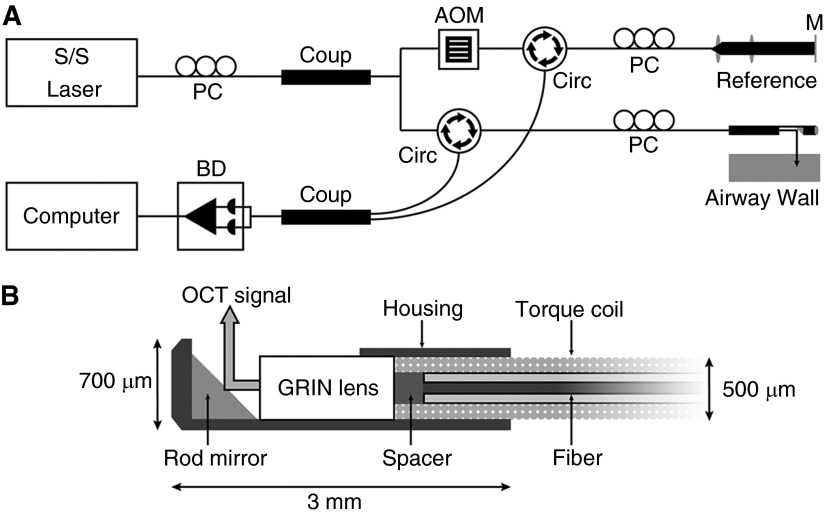
Specifications for the LR-OCT system, mechanical stage, probes, and details on image generation are described in the literature (25) and online supplement. The LR-OCT system (Figure 2A) used a near-infrared swept source laser (central wavelength 1,310 nm) and achieved an axial resolution of approximately 10 μm and full axial range of diameters up to 25 mm. Flexible, side-view fiberoptic OCT probes were constructed with an outer diameter of 0.7 mm and an active working distance of 5 mm (Figure 2B). Probes were mechanically rotated (25 Hz) and retracted (3.125 mm/s) along the longitudinal axis of the airway to acquire two-dimensional cross-sectional images of the airway wall that were generated and displayed in real-time on a computer.
Figure 2.
Schematics of long-range optical coherence tomography (OCT) system (A) and cross-section of the distal cap of a 0.7-mm outer diameter scanning probe (B). AOM = acoustooptic modulator; BD = balance detector; Circ = circulator; Coup = coupler; GRIN = gradient refractive index; M = mirror; PC = polarization controller; S/S = swept source.
LR-OCT Imaging
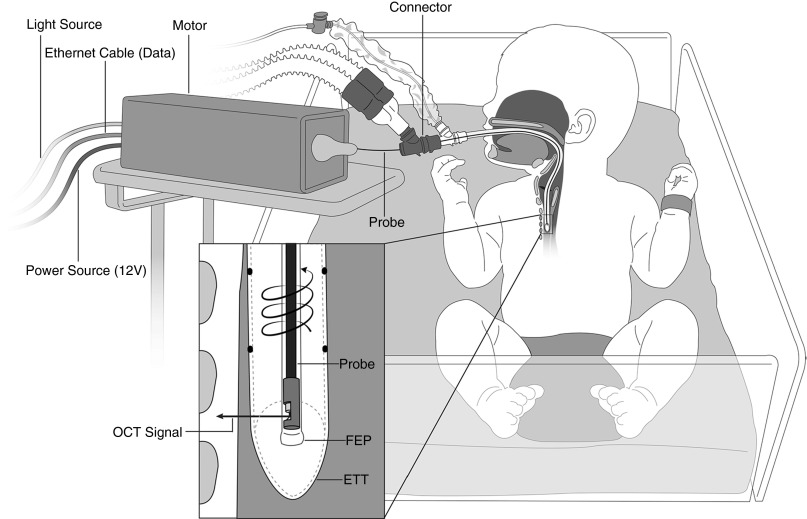
Details of image acquisition methodology are provided in the online supplement. Bedside LR-OCT was conducted in the NICU (Figure 3). Interruption of mechanical ventilation and changes to ventilator settings were not required. Patients were imaged in native prone or supine positions and no additional sedative or analgesic medications were administered. NICU nursing staff and a respiratory therapist were always present at bedside to assist with airway management. Optical probes were housed inside a distally sealed, transparent sheath (1.17-mm outer diameter) and inserted through the ETT via an external ventilator circuit connector. The probe was rotated and retracted within the stationary sheath, starting in the proximal trachea and ending in the supraglottis. A single scan of the laryngotracheal airway was completed in approximately 20 seconds, after which the probe was readvanced in the sheath to acquire one to two additional data sets. When clinically feasible, serial imaging was conducted in patients who remained intubated greater than 4 consecutive days.
Figure 3.
Bedside long-range (LR) optical coherence tomography (OCT) of the intubated neonatal airway. A 0.7-mm outer diameter OCT probe (75–80 cm length) is housed in a transparent sheath (1.17-mm outer diameter) and proximally connected to a combined motor unit. The probe is inserted through an external Y-connector and advanced inside the endotracheal tube. LR-OCT signal is reflected at 90° and penetrates the airway wall perpendicular to the tissue plane. Data are acquired in a retrograde, helical pattern as the probe undergoes high-speed 360° rotation and retraction through the upper airway. ETT = endotracheal tube; FEP = fluorinated ethylene propylene.
Image Segmentation and Micrometry
The airway wall segmentation and measurement methods have been described in detail (31); similar software-based airway tissue measurement has been validated in previous OCT studies (12–17). A single optimal data set from each LR-OCT case was selected based on signal-to-noise ratio, clarity of tissue contours, and soft tissue substructural resolution. Distinct topographic features (e.g., laryngeal ventricles, vocal folds, cartilage) were identified to divide each data set into three anatomic groups: larynx, subglottis, and proximal trachea. In each two-dimensional cross-sectional LR-OCT image frame, the mucosa and submucosa (hereafter referred to as the “airway wall”) were segmented by tracing the luminal surface and the submucosa-perichondrium interface using a drawing tablet (Intuos 5; Wacom, Vancouver, WA) and software coded in MATLAB (MathWorks, Natick, MA). Using the thickness of the ETT as a measurement reference and accounting for the refractive indices of light in biologic tissue and plastic, airway wall thickness was automatically calculated for the segmented tissue and averaged over the subset of images within the respective anatomic group (31).
Statistical Analysis
Forty-eight subjects with at least one high-quality, analyzable data set were included in the statistical analysis; only the first analyzable data set from serially imaged subjects was included. Univariate associations between intubation days, patient characteristics (GA, PMA, and weight) and airway wall thickness of the larynx, subglottis, and trachea were explored using Pearson correlations. Associations between intubation duration, PMA, ETT size and subject weight (independent variables), and airway wall thickness (dependent variable) were investigated using stepwise linear regression analysis with a backward stepping procedure. Intubation duration was significantly left-skewed. Based on skewness on the hypothesis that intubation duration and airway wall thickness had a nonlinear association, both intubation duration and a log transformation of intubation duration were included in the stepwise models. Given that preterm and term neonates were included in the study, PMA was the most appropriate indicator of subject age and was used instead of GA and chronologic age. There were no significant interactions between weight and intubation duration, therefore interaction effects were not included in the final regression models. Associations between independent variables, OCT data (pathology, thickness), and clinical outcome were investigated using univariate (chi-square tests and Student’s t tests) and multivariate (logistic regression) methods. Data from a subgroup of serially imaged subjects (n = 12) are described separately in the online supplement using descriptive statistics; associations between intubation duration and airway wall thickness were investigated using stepwise linear regression models.
Post hoc power analysis demonstrated greater than or equal to 90% power to detect an increase in R2 of greater than or equal to 0.13 for the independent variable intubation duration after adjusting for one additional independent variable (weight; R2 = 0.31) using an F test (α = 0.05). Thus, with a sample size of 48, power was 90% to detect the association between intubation duration and both larynx and subglottis wall thickness. Statistical analysis was performed using SYSTAT v13.0 (San Jose, CA).
Results
LR-OCT was performed a total of 94 times on 72 subjects (ages, 1–175 d; weight, 620–4,625 g). Forty-two (58%) males and 30 females were included. Forty-eight subjects had at least one high-quality data set that permitted image analysis. Demographics for these 48 subjects are summarized in Table 1; description of the full sample (n = 72) is presented in the online supplement (see Table E1 in the online supplement). Subjects excluded because of poor-quality data did not differ significantly from those with high-quality data with respect to GA, PMA, weight, or ETT size. Ninety-three of 94 procedures were completed without complication. One premature neonate with a history of transient apneic episodes experienced a brief apneic spell during the study that lasted approximately 10 seconds, resolved spontaneously with return to baseline blood oxygen saturation, and did not require any resuscitative efforts.
Table 1.
Demographics for 48 Subjects Included in Multivariate Regression Analysis*
| Variable | Intubation ≤7 d (n = 25) |
Intubation ≥8 d (n = 23) |
Total LR-OCT Cases (n = 48) |
||||||
|---|---|---|---|---|---|---|---|---|---|
| n (%) | Mean | SD | n (%) | Mean | SD | n (%) | Mean | SD | |
| Intubation duration, d | 3.20 | 2.12 | 30.30 | 24.41 | 16.19 | 21.65 | |||
| GA, wk | 30.36 | 5.80 | |||||||
| Age, d | 7.16 | 10.10 | 41.78 | 37.36 | 23.75 | 31.80 | |||
| Weight, g | 2439.60 | 1216.46 | 2232.39 | 1257.65 | 2340.31 | 1227.58 | |||
| ETT size | |||||||||
| 2.5 | 5 (20) | 7 (30.4) | 12 (25) | ||||||
| 3.0 | 14 (56) | 10 (43.5) | 24 (50) | ||||||
| 3.5 | 6 (64) | 6 (26.1) | 12 (25) | ||||||
Definition of abbreviations: ETT = endotracheal tube; GA = gestational age; LR-OCT = long-range optical coherence tomography.
Forty-eight of 72 subjects had at least one analyzable data set. For subjects with at least two analyzable data sets, only the first analyzable data set was included in the regression models.
Image Analysis
Sixty-seven data sets from 48 subjects featured adequate signal-to-noise ratio and optical penetration depth to permit image analysis. In these cases, the layered soft tissue architecture (epithelium, basement membrane, lamina propria, and submucosa) and structural features, such as mucosal glands, perichondrium, and cartilage, were identified. Basis for exclusion of 27 data sets included low signal-to-noise ratio and/or low back-reflected signal strength, factors that correlate with the quality of the probe optical assembly (Figure 2B). Additional factors that negatively impacted image quality included signal interference from the opaque material of some ETTs, and image distortion and artifact caused by precession and friction of the probe within the sheath as torque is transduced from the rotational motor. Data quality was not correlated with any clinical independent variable.
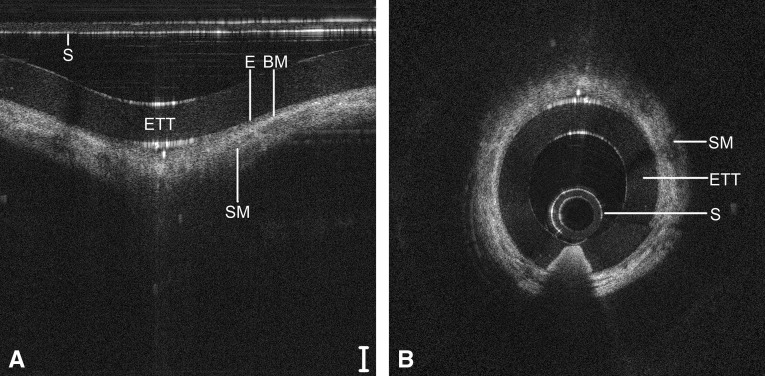
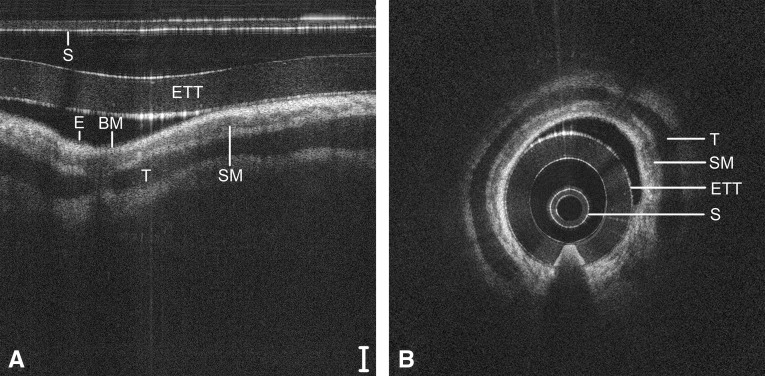
A guide to reading OCT images based on signal intensity is provided in the online supplement. Representative LR-OCT images of the neonatal larynx (Figure 4), subglottis (Figure 5), and trachea (Figure 6) are depicted in Cartesian (raw data) and polar (anatomically correct) coordinates. These images were acquired from a 1-day-old neonate (2,439 g), intubated a total of 2 hours. In Figures 5 and 6, the signal intensity of the epithelium (light-gray pixelation) is less than that of the underlying lamina propria, demarcating a tissue plane representative of the basement membrane. In the subglottis (Figure 5) and trachea (Figure 6), a loss of optical signal is noted within the cricoid and tracheal rings, respectively, because of the combined effect of scattering at the perichondrium and absorption by the cartilage.
Figure 4.
Long-range optical coherence tomography image of the neonatal larynx, represented in a select region of Cartesian coordinates (A) and polar coordinates (B). Noise bands digitally removed for image clarity. Scale bar = 500 μm. ETT = endotracheal tube; S = sheath; SM = submucosa; VF = free edge of vocal fold.
Figure 5.
Long-range optical coherence tomography image of the neonatal subglottis, represented in a select region of Cartesian coordinates (A) and polar coordinates (B). Noise bands digitally removed for image clarity. Scale bar = 500 μm. BM = basement membrane; E = epithelium; ETT = endotracheal tube; S = sheath; SM = submucosa.
Figure 6.
Long-range optical coherence tomography image of the neonatal trachea, represented in a select region of Cartesian coordinates (A) and polar coordinates (B). Noise bands digitally removed for image clarity. Scale bar = 500 μm. BM = basement membrane; E = epithelium; ETT = endotracheal tube; S = sheath; SM = submucosa; T = tracheal cartilage.
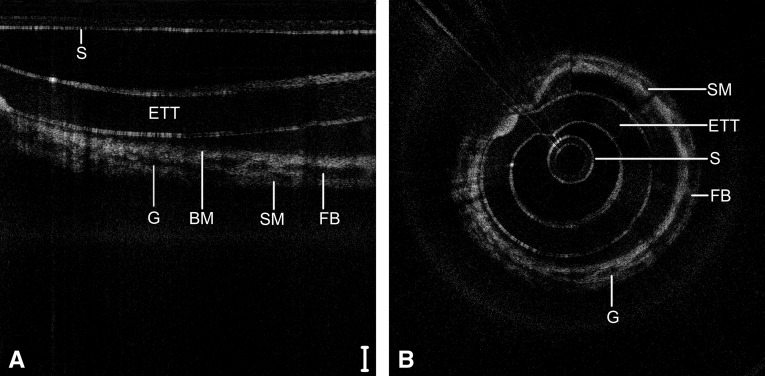
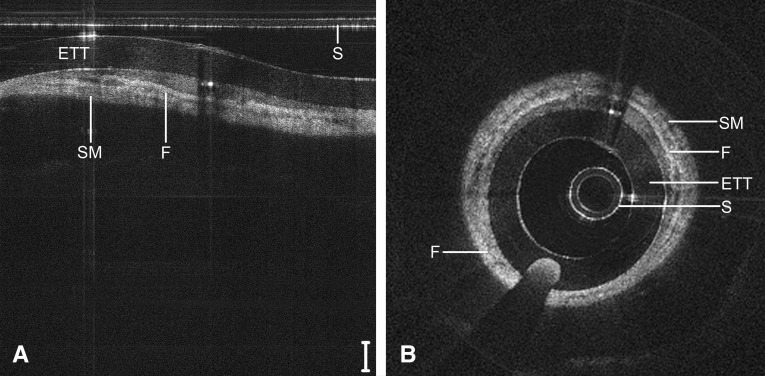
Figure 7 depicts the subglottis of a 9-day-old neonate (4,480 g) intubated since birth, including repeat airway instrumentation from two failed extubation trials. Signal heterogeneity and focal regions of signal hypointensity within the submucosa indicate seromucinous glandular dilatation and the onset of inflammatory edema. Larger regions of near-black optical density suggest fluid accumulation within the submucosa. Figure 8 depicts the subglottis of a 104-day-old child (2,640 g) intubated continuously since birth. In this case, a dense, homogenous optical signal is evident throughout the airway wall, indicative of high signal backscattering and suggestive of fibrosis and maturation of scar tissue.
Figure 7.
Long-range optical coherence tomography image of the neonatal subglottis following 9 days of intubation, represented in a select region of Cartesian coordinates (A) and polar coordinates (B). Noise bands digitally removed for image clarity. Scale bar = 500 μm. BM = basement membrane; ETT = endotracheal tube; FB = fluid bar; G = glandular structures; S = sheath; SM = submucosa.
Figure 8.
Long-range optical coherence tomography image of the neonatal subglottis following 104 days of continuous intubation, represented in a select region of Cartesian coordinates (A) and polar coordinates (B). Noise bands digitally removed for image clarity. Scale bar = 500 μm. ETT = endotracheal tube; F = fibrosis; S = sheath; SM = submucosa.
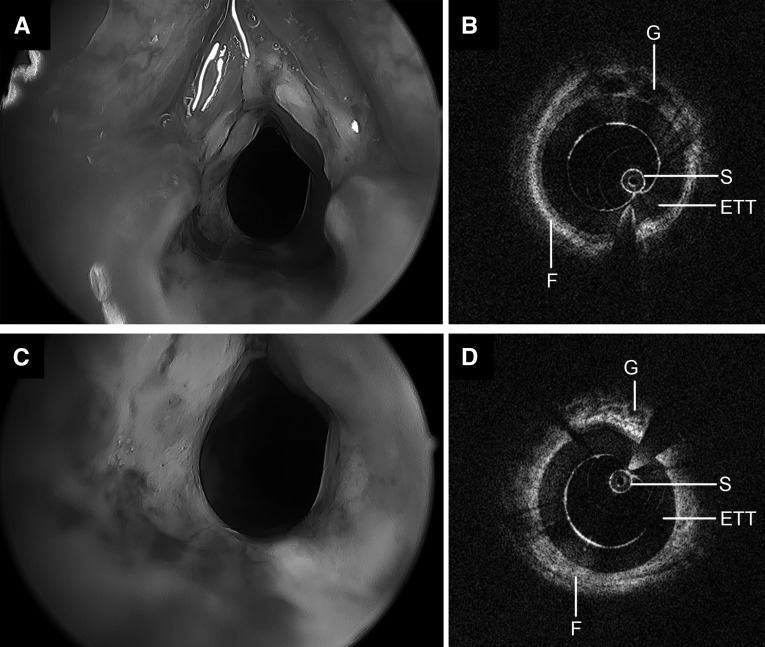
A 153-day-old child (4,562 g), intubated a total of 42 days with a history of postextubation stridor after two failed extubation attempts underwent LR-OCT and DLB (Figure 9). Intraoperative findings were consistent with significant edema throughout the larynx and subglottis and circumferential grade 2 SGS. LR-OCT images depicted a thick, circumferential layer of hyperintense tissue deep to the mucosa with focal regions of glandular activity throughout the airway wall.
Figure 9.
Operative bronchoscopy and long-range optical coherence tomography images of a neonatal airway following 42 days of intubation, including two failed extubation attempts. Significant edema and granulation, circumferential laryngeal stenosis (A), and grade 2 subglottic stenosis (C) are noted on endoscopy. Long-range optical coherence tomography of the larynx (B) and subglottis (D) demonstrates a thick, hyperintense submucosa with focal patches of hypointensity. ETT = endotracheal tube; F = fibrosis; G = glandular structures; S = sheath.
Tissue Micrometry
A Pearson correlation matrix is presented in the online supplement (see Table E2), describing relationships between clinical independent variables and laryngeal, subglottic, and tracheal wall thickness. Intubation duration was significantly correlated with laryngeal (P = 0.019) and subglottic (P = 0.001) airway wall thickness only. Patient weight was significantly correlated with airway wall thickness from all three anatomic groups. In backward stepwise regression analysis, patient weight and log intubation duration were significantly associated with airway wall thickness for the larynx (P < 0.001 for each; multiple r2 = 0.44) and subglottis (P < 0.0031 for each; multiple r2 = 0.55), whereas weight alone was significantly associated with trachea wall thickness (P < 0.001; multiple r2 = 0.55) (Table 2).
Table 2.
Stepwise Multivariate Linear Regression Models for Airway Wall Thickness
| Dependent Variable | Independent Variable | Coefficient | SE | Student’s t Test | P Value | 95% Confidence Limits |
|
|---|---|---|---|---|---|---|---|
| Lower | Upper | ||||||
| Larynx wall thickness | Constant | 447.65 | 40.50 | 11.05 | <0.0005 | 366.08 | 529.23 |
| Weight | 0.06 | 0.01 | 5.06 | <0.0005 | 0.04 | 0.09 | |
| LOG intubation days | 36.67 | 11.50 | 3.19 | 0.003 | 13.52 | 59.83 | |
|
F test for regression: P < 0.001 | |||||||
| Multiple r = 0.664 | |||||||
| Subglottis wall thickness | Constant | 432.48 | 41.11 | 10.521 | <0.0005 | 349.69 | 515.28 |
| Weight | 0.07 | 0.01 | 5.637 | <0.0005 | 0.05 | 0.10 | |
| LOG intubation days | 57.80 | 11.67 | 4.954 | <0.0005 | 34.30 | 81.30 | |
|
F test for regression: P < 0.001 | |||||||
| Multiple r = 0.744 | |||||||
| Trachea wall thickness | Constant | 481.78 | 32.39 | 14.876 | <0.0005 | 416.59 | 546.97 |
| Weight | 0.05 | 0.01 | 3.83 | <0.0005 | 0.02 | 0.07 | |
| LOG intubation days | |||||||
|
F test for regression: P < 0.001 | |||||||
| Multiple r = 0.492 | |||||||
n = 48.
After adjusting for patient weight, log intubation duration contributed an additional 0.13 to the overall multiple r2 = 0.44 for prediction of larynx wall thickness and an additional 0.24 to the overall multiple r2 = 0.55 for prediction of subglottis wall thickness. PMA and ETT size were not significantly associated with airway wall thickness in backward stepwise analysis. Figure 10 depicts models of the relationship between wall thickness and duration of intubation; linear regression lines were computed at the average weight for all patients. Statistical analysis of data from 12 of 17 serially imaged subjects with at least two analyzable data sets are included in the online supplement.
Figure 10.
Associations between laryngeal (A), subglottic (B), and tracheal (C) airway wall thickness (y-axis) and total duration of intubation plotted on a logarithmic scale (x-axis). Data points represent mean measurements from 48 long-range optical coherence tomography cases. Linear regression lines (dashed line) are plotted at the mean patient weight.
Retrospective Review
Thirteen (76%) of 17 subjects who failed extubation after LR-OCT imaging and 11 (35%) of 31 subjects with successful extubation had signs of submucosal edema on LR-OCT images. Subjects with pathology on LR-OCT had a higher likelihood of failing extubation (odds ratio, 5.9; P = 0.007). Increased intubation duration (P = 0.005) and PMA (P = 0.028) were significantly associated with increased risk of extubation failure; weight was nonsignificantly associated with extubation outcome (P = 0.168). Too few subjects had history of traumatic intubation or gastroesophageal reflux to conclusively evaluate associations. Mean laryngeal (P = 0.010) and subglottic (P = 0.002) wall thickness were significantly greater in subjects who failed extubation (Table 3). In multivariate logistic regression analysis, duration of intubation was the most important predictor of extubation failure; airway wall thickness was not associated with extubation outcome after adjusting for PMA, weight, intubation duration, and pathology on LR-OCT.
Table 3.
Univariate and Multivariate Logistic Regression Analysis of Associations between Airway Wall Thickness and Extubation Outcome
| Successful Extubation (n = 31) |
Failed Extubation (n = 17) |
Unadjusted P Value | Multivariate Analysis |
||||||
|---|---|---|---|---|---|---|---|---|---|
| Adjusted OR* | 95% Confidence Interval |
P Value* | |||||||
| Mean | SD | Mean | SD | Lower Limit | Upper Limit | ||||
| Subglottis thickness | 665.5 | 135.7 | 808.7 | 158.6 | 0.002 | 1.002 | 0.995 | 1.009 | 0.576 |
| Larynx thickness | 632.3 | 122.8 | 738.9 | 145.2 | 0.010 | 1.003 | 0.995 | 1.010 | 0.466 |
| Trachea thickness | 576.3 | 123.4 | 620.2 | 103.1 | 0.218 | 1.002 | 0.995 | 1.009 | 0.539 |
Definition of abbreviations: OCT = optical coherence tomography; OR = odds ratio.
Associations between independent variables, OCT data (pathology, thickness), and clinical outcome were investigated using univariate (chi-square tests and Student’s t tests) and multivariate (logistic regression) methods.
Adjusted for gestational age at imaging, weight, intubation days, and pathology on OCT.
Discussion
This study demonstrates the feasibility and efficacy of LR-OCT to evaluate and measure airway wall microanatomy of intubated neonates in a NICU setting. LR-OCT images revealed substructural changes within the subglottic mucosa and submucosa, suggestive of progressive airway wall injury and remodeling. Regression analysis demonstrated a correlation between duration of intubation and airway wall thickness in the larynx and subglottis. LR-OCT-based evaluation and quantification of subglottic microanatomy may ultimately aid neonatal and pediatric critical care specialists in identifying intubation-related injury that may progress to airway stenosis and prevent successful extubation.
Tissue Morphology and Analysis
Multivariate linear regression models demonstrated a clear association between duration of intubation and laryngeal and subglottic airway wall thickness. Airway wall thickening may allude to the development of postintubation edema and progression of injury. Although the pathophysiology of intubation-related subglottic injury is well documented (1, 32–34), SGS is often coupled with laryngeal edema, which may progress to posterior glottic stenosis (35–37). Posterior angulation of the trachea and posterior displacement of the ETT by the base-of-tongue and epiglottis presses the ETT against the medial surface of the arytenoid cartilages, cricoarytenoid joints, and posterior commissure, predisposing these structures to mucosal edema and ischemia. We noted no correlation between intubation duration and tracheal wall thickness, a logical outcome considering the greater intraluminal cross-sectional area of the trachea and the relative elasticity of the incomplete, C-shaped cartilaginous rings compared with the cricoid.
Laryngeal and subglottic wall thickness demonstrated a better fit with the logarithmic transformation of intubation days (Figure 10) than with a linear model. However, differences in the predictive values of both models were small and therefore it is difficult to ascertain the true pattern of morphologic change. Given the rarity of neonates requiring long-term intubation in recent years, we lack adequate statistical power to divide our sample into short- and long-term intubation groups and detect significant differences in linear regression slopes. However, our preliminary results suggest that the rate of increase of laryngeal and subglottic wall thickness may be greater in the acute and subacute inflammatory phase (first ∼72 h) than in the chronic phase. We postulate that early soft tissue expansion secondary to edema and hyperemia may ultimately plateau because of spatial restrictions from the rigid ETT intraluminally and the cricoid. As tissue enters the proliferative and remodeling phases, the lamina propria and submucosa may undergo less volumetric change, with more changes in matrix composition as fibrosis ensues.
Retrospective data demonstrate a higher likelihood of extubation failure with positive substructural findings on LR-OCT images. Although 35% of successfully extubated subjects were noted to have submucosal edema on LR-OCT, the degree of injury in these subjects may not have been causative of airway compromise. Although intubation days was the only significant predictor of extubation outcome in multivariate analysis after adjusting for covariates (Table 3), the high association between intubation days and laryngeal and subglottic wall thickness (Table 2) underscores the predictive capacity of LR-OCT-based measurements.
LR-OCT Advantages
The novelty and potential of LR-OCT lies in the ability to serially image the intubated neonatal airway and to evaluate clinically silent progression of disease during the course of intubation. Given the wide variability in each child’s response to intubation and the multitude of risk factors involved (e.g., history of traumatic or repeated intubation, size of ETT, prematurity, presence of concurrent gastroesophageal reflux) (38–41), a generalized clinical model of acquired SGS may not be applicable to all intubated neonates. Hence, serial imaging of each airway would allow clinicians to monitor for edema or fibrosis and make individualized airway management decisions. Early recognition and quantification of edematous change may alert critical care specialists to consider downsizing the ETT or, if feasible, switching to noninvasive ventilation. This may ultimately help decrease the frequencies of extubation failure and reintubation in children, events that are associated with prolonged ICU admission (42, 43) and additional risk of airway injury. Furthermore, LR-OCT may help reduce the incidence of acquired SGS by identifying early tissue remodeling before the development of irreversible airway cicatrization.
Study Limitations
Although the ETT does distort native airway shape and limits estimating airway cross-sectional geometry, it does not alter imaging of the substructural microanatomy of the airway wall (19, 29). Given that the ETT is the primary inciting factor for SGS in intubated neonates, OCT imaging of the intubated airway provides the first in vivo documentation of the natural development and progression of SGS. We also acknowledge that the airway wall may be compressed by the ETT and that thickness measurements acquired here are not representative of a healthy, nonintubated airway. However, the change in thickness from baseline and rate of change in the first 72 hours of intubation may be more clinically relevant data to the clinician than the true thickness of the airway wall.
A limiting factor in this study was image quality and consistency. Twenty-seven of 94 data sets were discarded because of unfavorable signal-to-noise ratio and/or inadequate optical penetration depth. OCT probes are custom assembled under microscopy, lending to variability in the distal optical assembly (Figure 2B) between different probes and, consequently, variability in signal strength and image quality. To improve probe quality and longevity, we continuously optimized our probe assembly protocol and achieved greater than 90% data yield in the final one-third of our sample. Additionally, high-speed rotation of probes through a tortuous path causes fine precession of the distal probe tip and mechanical wear-and-tear on the optical assembly. These factors cause motion artifact and progressively diminish image quality with repeat probe use, respectively. Friction between the probe coil and the inner surface of the sheath also results in image distortion as the probe recoils within the sheath.
Future Work
As the current technology evolves, several improvements are necessary for LR-OCT to serve as a clinically useful diagnostic modality for evaluation of the intubated airway. First, further refinement and standardization of probe assembly is necessary to achieve optimal resolution to reliably define mucosal substructure. Just as non-LR-OCT systems underwent extensive research and optimization for clinical cardiovascular imaging (44, 45), LR-OCT must follow a similar technological development curve before application in pulmonary imaging. Second, the offline tissue segmentation and measurement methods used in this study are labor intensive, and may require up to 45–60 minutes of analysis per data set (31). Automated algorithms for tissue recognition and segmentation would expedite data analysis and permit real-time quantification of airway morphology.
In this study, 17 subjects underwent repeat imaging at different time points. This is the first report of serial, high-resolution imaging of the intubated neonatal airway. Further studies with larger numbers of serially imaged neonates are warranted to evaluate the degree of pathologic variability among subjects and to better understand the clinical course of SGS. Ultimately, we anticipate that extrapolation of serial LR-OCT data may provide predictive models for the rate of disease progression and extubation outcome, and aid in individualized management of the intubated airway.
Conclusions
LR-OCT is a safe, minimally invasive, and potentially practical technology for in vivo diagnostic imaging of the intubated neonatal airway. LR-OCT yields high-resolution images of the airway wall to allow for characterization of subglottic microanatomy and quantification of airway wall morphology. We believe this study demonstrates the potential for LR-OCT as a means to monitor the intubated neonatal airway for subglottic edema and precursors of acquired SGS and to aid in neonatal airway management.
Acknowledgments
Acknowledgment
The authors thank the patients and their families for their participation in this study. They also thank the medical staff at University of California Irvine Medical Center and at CHOC Children’s Hospital of Orange County for their efforts in recruiting families and assisting their otolaryngology and neonatology teams. They thank Bryan Lemieux for his medical illustrations.
Footnotes
Supported by National Institutes of Health/NHLBI grants 1-R01-HL103764-01 and 1-R01-HL105215-01.
Author Contributions: Study design and concept, G.S.A., Z.C., and B.J.-F.W. Acquisition of data, G.K.S., G.S.A., M.W., A.E.H., J.C.J., Y.Q., F.L., A.W., L.C., V.D., J.P.C., C.C.U., K.H., N.P., and B.J.-F.W. Analysis and interpretation of data, G.K.S., G.S.A., E.S., A.E.H., Y.Q., and B.J.-F.W. Statistical analysis, G.K.S. and K.E.O. Study supervision, G.S.A., K.H., N.P., V.D., J.P.C., C.C.U., Z.C., and B.J.-F.W. G.K.S., K.E.O., G.S.A., and B.J.-F.W. had full access to all of the data and take responsibility for the integrity of the data and accuracy of the data analysis. All authors have read, edited, and authorized the final version of the manuscript.
This article has an online supplement, which is accessible from this issue's table of contents at www.atsjournals.org
Originally Published in Press as DOI: 10.1164/rccm.201501-0053OC on July 27, 2015
Author disclosures are available with the text of this article at www.atsjournals.org.
References
- 1.Hawkins DB. Pathogenesis of subglottic stenosis from endotracheal intubation. Ann Otol Rhinol Laryngol. 1987;96:116–117. doi: 10.1177/000348948709600126. [DOI] [PubMed] [Google Scholar]
- 2.Sherman JM, Lowitt S, Stephenson C, Ironson G. Factors influencing acquired subgottic stenosis in infants. J Pediatr. 1986;109:322–327. doi: 10.1016/s0022-3476(86)80395-x. [DOI] [PubMed] [Google Scholar]
- 3.Holzki J, Laschat M, Puder C. Iatrogenic damage to the pediatric airway. Mechanisms and scar development. Paediatr Anaesth. 2009;19:131–146. doi: 10.1111/j.1460-9592.2009.03003.x. [DOI] [PubMed] [Google Scholar]
- 4.Choi SS, Zalzal GH. Changing trends in neonatal subglottic stenosis. Otolaryngol Head Neck Surg. 2000;122:61–63. doi: 10.1016/S0194-5998(00)70145-8. [DOI] [PubMed] [Google Scholar]
- 5.Walner DL, Loewen MS, Kimura RE. Neonatal subglottic stenosis--incidence and trends. Laryngoscope. 2001;111:48–51. doi: 10.1097/00005537-200101000-00009. [DOI] [PubMed] [Google Scholar]
- 6.Wratney AT, Benjamin DK, Jr, Slonim AD, He J, Hamel DS, Cheifetz IM. The endotracheal tube air leak test does not predict extubation outcome in critically ill pediatric patients. Pediatr Crit Care Med. 2008;9:490–496. doi: 10.1097/PCC.0b013e3181849901. [DOI] [PMC free article] [PubMed] [Google Scholar]
- 7.Mhanna MJ, Zamel YB, Tichy CM, Super DM. The “air leak” test around the endotracheal tube, as a predictor of postextubation stridor, is age dependent in children. Crit Care Med. 2002;30:2639–2643. doi: 10.1097/00003246-200212000-00005. [DOI] [PubMed] [Google Scholar]
- 8.Brenner DJ, Hall EJ. Computed tomography--an increasing source of radiation exposure. N Engl J Med. 2007;357:2277–2284. doi: 10.1056/NEJMra072149. [DOI] [PubMed] [Google Scholar]
- 9.Dame Carroll JR, Chandra A, Jones AS, Berend N, Magnussen JS, King GG. Airway dimensions measured from micro-computed tomography and high-resolution computed tomography. Eur Respir J. 2006;28:712–720. doi: 10.1183/09031936.06.00012405. [DOI] [PubMed] [Google Scholar]
- 10.Tzeng YS, Hoffman E, Cook-Granroth J, Maurer R, Shah N, Mansour J, Tschirren J, Albert M. Comparison of airway diameter measurements from an anthropomorphic airway tree phantom using hyperpolarized 3He MRI and high-resolution computed tomography. Magn Reson Med. 2007;58:636–642. doi: 10.1002/mrm.21285. [DOI] [PMC free article] [PubMed] [Google Scholar]
- 11.Huang D, Swanson EA, Lin CP, Schuman JS, Stinson WG, Chang W, Hee MR, Flotte T, Gregory K, Puliafito CA, et al. Optical coherence tomography. Science. 1991;254:1178–1181. doi: 10.1126/science.1957169. [DOI] [PMC free article] [PubMed] [Google Scholar]
- 12.Coxson HO, Quiney B, Sin DD, Xing L, McWilliams AM, Mayo JR, Lam S. Airway wall thickness assessed using computed tomography and optical coherence tomography. Am J Respir Crit Care Med. 2008;177:1201–1206. doi: 10.1164/rccm.200712-1776OC. [DOI] [PMC free article] [PubMed] [Google Scholar]
- 13.Mahmood U, Hanna NM, Han S, Jung WG, Chen Z, Jordan B, Yershov A, Walton R, Brenner M. Evaluation of rabbit tracheal inflammation using optical coherence tomography. Chest. 2006;130:863–868. doi: 10.1378/chest.130.3.863. [DOI] [PubMed] [Google Scholar]
- 14.Kaiser ML, Rubinstein M, Vokes DE, Ridgway JM, Guo S, Gu M, Crumley RL, Armstrong WB, Chen Z, Wong BJ. Laryngeal epithelial thickness: a comparison between optical coherence tomography and histology. Clin Otolaryngol. 2009;34:460–466. doi: 10.1111/j.1749-4486.2009.02005.x. [DOI] [PMC free article] [PubMed] [Google Scholar]
- 15.Lee SW, Heidary AE, Yoon D, Mukai D, Ramalingam T, Mahon S, Yin J, Jing J, Liu G, Chen Z, et al. Quantification of airway thickness changes in smoke-inhalation injury using in-vivo 3-D endoscopic frequency-domain optical coherence tomography. Biomed Opt Express. 2011;2:243–254. doi: 10.1364/BOE.2.000243. [DOI] [PMC free article] [PubMed] [Google Scholar]
- 16.Lee AM, Kirby M, Ohtani K, Candido T, Shalansky R, MacAulay C, English J, Finley R, Lam S, Coxson HO, et al. Validation of airway wall measurements by optical coherence tomography in porcine airways. PLoS One. 2014;9:e100145. doi: 10.1371/journal.pone.0100145. [DOI] [PMC free article] [PubMed] [Google Scholar]
- 17.Karamzadeh AM, Jackson R, Guo S, Ridgway JM, Wong HS, Ahuja GS, Chao MC, Liaw LH, Chen Z, Wong BJ. Characterization of submucosal lesions using optical coherence tomography in the rabbit subglottis. Arch Otolaryngol Head Neck Surg. 2005;131:499–504. doi: 10.1001/archotol.131.6.499. [DOI] [PubMed] [Google Scholar]
- 18.Lin JL, Yau AY, Boyd J, Hamamoto A, Su E, Tracy L, Heidari AE, Wang AH, Ahuja G, Chen Z, et al. Real-time subglottic stenosis imaging using optical coherence tomography in the rabbit. JAMA Otolaryngol Head Neck Surg. 2013;139:502–509. doi: 10.1001/jamaoto.2013.2643. [DOI] [PMC free article] [PubMed] [Google Scholar]
- 19.Ridgway JM, Su J, Wright R, Guo S, Kim DC, Barretto R, Ahuja G, Sepehr A, Perez J, Sills JH, et al. Optical coherence tomography of the newborn airway. Ann Otol Rhinol Laryngol. 2008;117:327–334. [PMC free article] [PubMed] [Google Scholar]
- 20.Choma M, Sarunic M, Yang C, Izatt J. Sensitivity advantage of swept source and Fourier domain optical coherence tomography. Opt Express. 2003;11:2183–2189. doi: 10.1364/oe.11.002183. [DOI] [PubMed] [Google Scholar]
- 21.Leitgeb R, Hitzenberger C, Fercher A. Performance of Fourier domain vs. time domain optical coherence tomography. Opt Express. 2003;11:889–894. doi: 10.1364/oe.11.000889. [DOI] [PubMed] [Google Scholar]
- 22.Armstrong JJ, Leigh MS, Sampson DD, Walsh JH, Hillman DR, Eastwood PR. Quantitative upper airway imaging with anatomic optical coherence tomography. Am J Respir Crit Care Med. 2006;173:226–233. doi: 10.1164/rccm.200507-1148OC. [DOI] [PubMed] [Google Scholar]
- 23.Williamson JP, Armstrong JJ, McLaughlin RA, Noble PB, West AR, Becker S, Curatolo A, Noffsinger WJ, Mitchell HW, Phillips MJ, et al. Measuring airway dimensions during bronchoscopy using anatomical optical coherence tomography. Eur Respir J. 2010;35:34–41. doi: 10.1183/09031936.00041809. [DOI] [PubMed] [Google Scholar]
- 24.Williamson JP, McLaughlin RA, Noffsinger WJ, James AL, Baker VA, Curatolo A, Armstrong JJ, Regli A, Shepherd KL, Marks GB, et al. Elastic properties of the central airways in obstructive lung diseases measured using anatomical optical coherence tomography. Am J Respir Crit Care Med. 2011;183:612–619. doi: 10.1164/rccm.201002-0178OC. [DOI] [PubMed] [Google Scholar]
- 25.Jing J, Zhang J, Loy AC, Wong BJ, Chen Z. High-speed upper-airway imaging using full-range optical coherence tomography. J Biomed Opt. 2012;17:110507. doi: 10.1117/1.JBO.17.11.110507. [DOI] [PMC free article] [PubMed] [Google Scholar]
- 26.Wijesundara K, Zdanski C, Kimbell J, Price H, Iftimia N, Oldenburg AL. Quantitative upper airway endoscopy with swept-source anatomical optical coherence tomography. Biomed Opt Express. 2014;5:788–799. doi: 10.1364/BOE.5.000788. [DOI] [PMC free article] [PubMed] [Google Scholar]
- 27.Chou L, Batchinsky A, Belenkiy S, Jing J, Ramalingam T, Brenner M, Chen Z. In vivo detection of inhalation injury in large airway using three-dimensional long-range swept-source optical coherence tomography. J Biomed Opt. 2014;19:36018. doi: 10.1117/1.JBO.19.3.036018. [DOI] [PMC free article] [PubMed] [Google Scholar]
- 28.Ajose-Popoola O, Hamamoto A, Wang A, Su E, Nguyen T, Chen Z, Jing J, Ahuja G, Wong B. Imaging early subglottic edema using 3D Fourier domain optical coherence tomography: pilot investigations in the New Zealand white rabbit [abstract] Presented at the American Society of Pediatric Otolaryngology 2014 Spring Meeting. May 16–18, 2014, Las Vegas, NV. F118.
- 29.Volgger V, Sharma GK, Jing JC, Peaks YA, Loy AC, Lazarow F, Wang A, Qu Y, Su E, Chen Z, et al. Long-range Fourier domain optical coherence tomography of the pediatric subglottis. Int J Pediatr Otorhinolaryngol. 2015;79:119–126. doi: 10.1016/j.ijporl.2014.11.019. [DOI] [PMC free article] [PubMed] [Google Scholar]
- 30.Sharma G, Ahuja G, Lazarow F, Wang A, Jing J, Hamamoto A, Pham N, Dhar V, Uy C, Chen Z, et al. In vivo high-speed optical coherence tomography of the neonatal subglottis for early identification of subglottic stenosis [abstract] Presented at the American Society of Pediatric Otolaryngology 2014 Spring Meeting. May 16–18, 2014, Las Vegas, NV. [Google Scholar]
- 31.Su E, Sharma GK, Chen J, Nguyen TD, Wang A, Ahuja GS, Chen Z, Wong BJ. Analysis and digital 3D modeling of long-range Fourier-domain optical coherence tomography images of the pediatric subglottis. Proc SPIE. 2014;8926:89262J. [Google Scholar]
- 32.Whited RE. A study of endotracheal tube injury to the subglottis. Laryngoscope. 1985;95:1216–1219. doi: 10.1288/00005537-198510000-00014. [DOI] [PubMed] [Google Scholar]
- 33.Hawkins DB. Glottic and subglottic stenosis from endotracheal intubation. Laryngoscope. 1977;87:339–346. doi: 10.1288/00005537-197703000-00006. [DOI] [PubMed] [Google Scholar]
- 34.Reidenbach MM, Schmidt HM. Anatomical aspects of postintubational subglottic stenosis. Clin Anat. 1995;8:273–280. doi: 10.1002/ca.980080406. [DOI] [PubMed] [Google Scholar]
- 35.Bogdasarian RS, Olson NR. Posterior glottic laryngeal stenosis. Otolaryngol Head Neck Surg (1979) 1980;88:765–772. doi: 10.1177/019459988008800625. [DOI] [PubMed] [Google Scholar]
- 36.Whited RE. Posterior commissure stenosis post long-term intubation. Laryngoscope. 1983;93:1314–1318. doi: 10.1002/lary.1983.93.10.1314. [DOI] [PubMed] [Google Scholar]
- 37.Irving RM, Bailey CM, Evans JN. Posterior glottic stenosis in children. Int J Pediatr Otorhinolaryngol. 1993;28:11–23. doi: 10.1016/0165-5876(93)90142-p. [DOI] [PubMed] [Google Scholar]
- 38.Gomes Cordeiro AM, Fernandes JC, Troster EJ. Possible risk factors associated with moderate or severe airway injuries in children who underwent endotracheal intubation. Pediatr Crit Care Med. 2004;5:364–368. doi: 10.1097/01.PCC.0000128894.59583.66. [DOI] [PubMed] [Google Scholar]
- 39.Thiagarajan RR, Bratton SL, Martin LD, Brogan TV, Taylor D. Predictors of successful extubation in children. Am J Respir Crit Care Med. 1999;160:1562–1566. doi: 10.1164/ajrccm.160.5.9810036. [DOI] [PubMed] [Google Scholar]
- 40.Wheeler D. Life-threatening diseases of the upper respiratory tract. Wheeler D, Wong H, Shanley T, editors. Pediatric critical care medicine, Volume 2: respiratory, cardiovascular and central nervous systems, 2 ed. New York, NY: Springer; 2014. pp. 19–41. [Google Scholar]
- 41.Walner DL, Stern Y, Gerber ME, Rudolph C, Baldwin CY, Cotton RT. Gastroesophageal reflux in patients with subglottic stenosis. Arch Otolaryngol Head Neck Surg. 1998;124:551–555. doi: 10.1001/archotol.124.5.551. [DOI] [PubMed] [Google Scholar]
- 42.Kurachek SC, Newth CJ, Quasney MW, Rice T, Sachdeva RC, Patel NR, Takano J, Easterling L, Scanlon M, Musa N, et al. Extubation failure in pediatric intensive care: a multiple-center study of risk factors and outcomes. Crit Care Med. 2003;31:2657–2664. doi: 10.1097/01.CCM.0000094228.90557.85. [DOI] [PubMed] [Google Scholar]
- 43.Pereira KD, Smith SL, Henry M. Failed extubation in the neonatal intensive care unit. Int J Pediatr Otorhinolaryngol. 2007;71:1763–1766. doi: 10.1016/j.ijporl.2007.07.018. [DOI] [PubMed] [Google Scholar]
- 44.Jang IK, Bouma BE, Kang DH, Park SJ, Park SW, Seung KB, Choi KB, Shishkov M, Schlendorf K, Pomerantsev E, et al. Visualization of coronary atherosclerotic plaques in patients using optical coherence tomography: comparison with intravascular ultrasound. J Am Coll Cardiol. 2002;39:604–609. doi: 10.1016/s0735-1097(01)01799-5. [DOI] [PubMed] [Google Scholar]
- 45.Yabushita H, Bouma BE, Houser SL, Aretz HT, Jang IK, Schlendorf KH, Kauffman CR, Shishkov M, Kang DH, Halpern EF, et al. Characterization of human atherosclerosis by optical coherence tomography. Circulation. 2002;106:1640–1645. doi: 10.1161/01.cir.0000029927.92825.f6. [DOI] [PubMed] [Google Scholar]


