Abstract
Splicing patterns in human immunodeficiency virus type 1 (HIV-1) are maintained through cis regulatory elements that recruit antagonistic host RNA-binding proteins. The activity of the 3′ acceptor site A7 is tightly regulated through a complex network of an intronic splicing silencer (ISS), a bipartite exonic splicing silencer (ESS3a/b), and an exonic splicing enhancer (ESE3). Because HIV-1 splicing depends on protein-RNA interactions, it is important to know the tertiary structures surrounding the splice sites. Herein, we present the NMR solution structure of the phylogenetically conserved ISS stem loop. ISS adopts a stable structure consisting of conserved UG wobble pairs, a folded 2X2 (GU/UA) internal loop, a UU bulge, and a flexible AGUGA apical loop. Calorimetric and biochemical titrations indicate that the UP1 domain of heterogeneous nuclear ribonucleoprotein A1 binds the ISS apical loop site-specifically and with nanomolar affinity. Collectively, this work provides additional insights into how HIV-1 uses a conserved RNA structure to commandeer a host RNA-binding protein.
Keywords: alternative splicing, calorimetry, heterogeneous nuclear ribonucleoprotein (hnRNP), human immunodeficiency virus (HIV), nuclear magnetic resonance (NMR), phylogenetics
Introduction
Human immunodeficiency virus type 1 (HIV-1)2 requires controlled synthesis of its protein complement for persistent infection and successful virion production. Genome expression is tightly regulated at the levels of transcription, splicing, mRNA nuclear export, and translation (1). RNA polymerase II-dependent transcription yields a 9-kilobase (kb) polycistronic transcript that undergoes multiple rounds of alternative splicing to produce upward of 100 different viral mRNAs that are classified by their intron composition: unspliced, incompletely spliced (4 kb), and completely spliced (2 kb) (2, 3). During early phase HIV-1 replication, cytoplasmic levels of the 2-kb transcripts predominate to encode Tat, Rev, and Nef. Accumulation of unspliced and 4-kb transcripts coincides with the transition to late phase replication and expression of Gag, Gag/Pol, Vpr, Vif, and Env/Vpu. Thus, HIV-1 splicing pathways are essential components of the viral replication cycle and represent new targets for therapeutic intervention (3, 4).
The identities of HIV-1 transcripts are determined by the combinatorial use of several 5′ donor and 3′ acceptor splice sites. Efforts to understand mechanisms of HIV-1 splicing reveal that all of the acceptor sites and splice donors D2–D4 are suboptimal due to non-consensus core splicing signals (4, 5). Proper spliced ratios are therefore established via auxiliary cis RNA features, collectively known as splicing regulatory elements. Splicing regulatory elements function either as enhancers or silencers of splicing by recruiting host proteins belonging to the serine-arginine-rich (SR) and hnRNP families, respectively. Splicing regulatory element location (intronic or exonic) influences how frequently a given splice site is utilized, thereby making it difficult to determine general rules of the mechanisms that regulate alternative splicing (6).
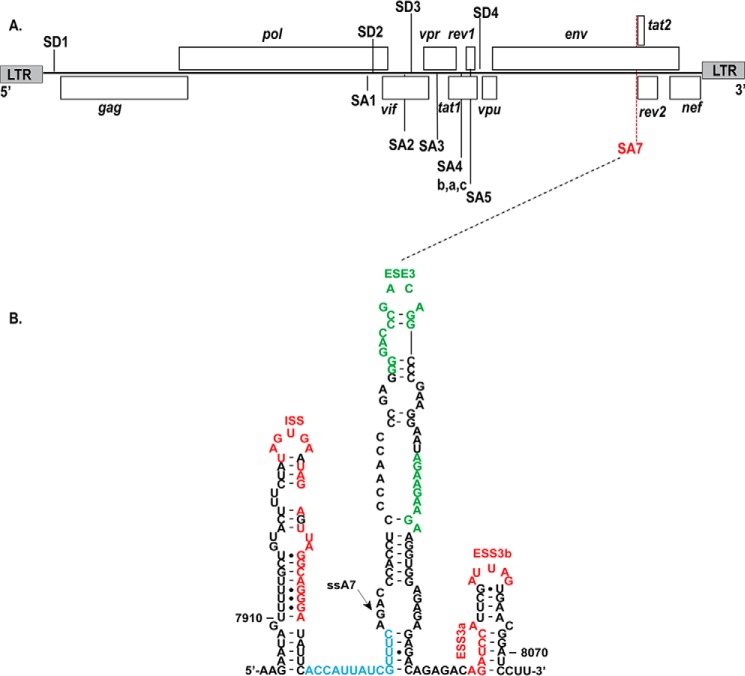
Splicing from site D4 to A7 removes the Rev-responsive element, which leads to the accumulation of 2-kb transcripts that exit the nucleus in a Rev-independent manner. The extent of splicing to site A7 (ssA7) is tightly regulated through a complex network of three splicing regulatory elements: an intronic splicing silencer (ISS), a bipartite exonic splicing silencer (ESS3a/b), and an exonic splicing enhancer (ESE3) (7–11). RNA secondary structure probing revealed that the isolated ssA7 locus folds into a conserved domain consisting of three stem loops where the ISS, ESE3, and ESS3 elements reside within single strand loop regions (Fig. 1). Cellular proteins hnRNP A1 and SRSF1 (ASF/SF2) were identified as the trans repressor and activator of ssA7 by forming complexes with their respective silencer and enhancer elements (12, 13). Interactions between hnRNP A1 and ssA7 effectively block early spliceosome assembly, whereas SRSF1 counteracts the block by stabilizing U2AF loading at the 3′ splice site (5, 7, 8).
FIGURE 1.
A, genetic landscape of the HIV-1 genome highlighting the nine open reading frames along with donor and acceptor splice sites. B, the experimentally determined RNA secondary structure (HIV-1Bru) surrounding site A7 reveals that its cis regulatory elements localize to three stem loops: SL1, intron splicing silencer (red); SL2, exonic splicing enhancer 3 (green); and SL3, exonic splicing silencer 3a/b (red). The polypyrimidine tract is colored blue, and the arrow points to the location of splice site A7. LTR, long terminal repeat.
To better understand the structural basis of ssA7 regulation, we previously determined the solution NMR structure of the ESS3 stem loop (SL3ESS3) and more recently elucidated its mode of interaction with the UP1 domain of hnRNP A1 (14–16). UP1 binds site-specifically to an AG dinucleotide motif of the SL3ESS3 apical loop (16). Secondary structure probing of the isolated ssA7 locus revealed that the ISS element folds into a stem loop structure with an exposed AGUGA apical loop (Fig. 1); however, a recent SHAPE model of the entire HIV-1 genome showed that the AGUGA sequence is involved in base pairing to form a short helix (17). Because the accurate position of the AGUGA silencer element is key to understanding its function on ssA7, we determined the NMR solution structure of the isolated ISS stem loop (SL1ISS) and characterized its interactions with UP1. Our structural studies reveal that SL1ISS folds into a stable structure with an exposed AGUGA apical loop that binds UP1 specifically and with high affinity.
Experimental Procedures
Nucleotide sequences (excluding recombinants) comprising the ISS element were derived from the Los Alamos HIV sequence database (www.hiv.lanl.gov/content/sequence/HIV/mainpage.html) for HIV-1 group M subtypes (21 total) for which at least 10 sequences had been submitted. Sequences for individual subtypes were aligned in Geneious using the ClustalW multiple sequence alignment algorithm (18). Consensus sequences and logos for individual subtypes were generated also using Geneious based on the majority nucleotide present at each site. This alignment was then used for the calculation of the mean evolutionary distance and inference of a maximum likelihood phylogenetic tree using 1,000 bootstrap replicates in Mega v5.2 (19). The maximum composite likelihood method (20) was used for distance calculation, whereas the Hasegawa-Kishino-Yano model (21) with γ-distributed rate variation among sites was chosen for tree reconstruction based on the likelihood ratio test of log likelihood values for each nested model provided using the model test also implemented in Mega.
Preparation of ISS Constructs
Three ISS constructs of different sizes were used in this study: a 53-nt SL1ISS (7904–7955) construct, a 33-nt SL1ISS-33 (7915–7945) construct, and a 25-nt SL1ISS-25 (7920–7940) construct where numbering corresponds to native residues of HIV-1Bru. The RNA samples were in vitro transcribed from synthetic DNA templates (Integrated DNA Technologies) as described previously (15). For NMR studies, 13C-, 15N-, and 2H-labeled rNTPs were purchased from Cambridge Isotope Laboratories. Following synthesis, the RNA samples were purified by denaturing PAGE (8–16% depending on size), electroeluted, and loaded onto a HiPrep 16/60 Sephacryl S-100 column (GE Healthcare) to desalt and remove soluble acrylamide. RNA samples for NMR analysis were exchanged into 5 mm K2HPO4 (pH 6.5) and 90% H2O, 10% D2O or 100% D2O using a Millipore Amicon® Ultra-15 centrifugal device. RNA samples prepared for calorimetry and analytical size exclusion chromatography were exchanged into 10 mm K2HPO4 (pH 6.5), 120 mm KCl, 10 mm NaCl, 0.5 mm EDTA, 1 mm tris(2-carboxyethyl)phosphine.
Folding studies were carried out by heating the samples under dilute conditions to 95 °C for 3 min followed by snap cooling on ice. Native polyacrylamide gels were run to check the conformational homogeneity. Independent of the length of the RNA fragment, the predominant species (>95%) migrated as a monomer under dilute RNA concentrations. However, under high RNA (excess of 150 μm) and high salt concentrations, we observed slower migrating species for SL1ISS and SL1ISS-33. Therefore, all NMR experiments were carried out using RNA concentrations that ranged from 80 to 120 μm and in low ionic strength buffer. Single conformers were resolved under very dilute RNA concentrations, and high ionic strength conditions were used for calorimetric and size exclusion titrations. Theoretical molar extinction coefficients were calculated using the Nanodrop 2000 calculation tool.
NMR Data Acquisition, Processing, and Analysis
Two-dimensional NMR experiments were carried out using Bruker Avance (800- and 900-MHz) high field NMR spectrometers equipped with cryogenically cooled, HCN triple resonance probes and a z axis pulsed field gradient accessory. To check RNA conformational homogeneity and purity, one-dimensional 1H NMR experiments were performed using a Bruker Avance III HD (500 MHz) equipped with the Prodigy broadband cryoprobe. All NMR data were processed by NMRPipe/NMRDraw (22) and analyzed using the software NMRView J (23). Exchangeable 1H spectra were measured at 288 K with the Watergate NOESY (τm = 250 ms) pulse sequence. The Watergate NOESY experiment was collected on an [2H]AC-selectively labeled SL1ISS sample. Non-exchangeable protons were assigned following well established procedures. 1H-1H NOESY (τm = 250 ms) and 1H-1H TOCSY (τm = 75 ms) spectra were recorded in 100% D2O at 298 K on SL1ISS, SL1ISS-33, and SL1ISS-25 samples labeled with different combinations of deuterated rNTPs including equimolar rNTPs, rRTP (3′,4′,5′,5″) and rYTP (5,3′,4′,5′,5″). 1H-13C heteronuclear multiple quantum coherence spectra were recorded for the different ISS constructs to verify NOE assignments. Chemical shift assignments were determined for all aromatic protons and ribose positions H1′-H2′.
Residual dipolar couplings (RDCs) were measured using 1H-13C TROSY HSQC experiments (24) for both isotropic and anisotropic (ASLA Biotech, Pf1 bacteriophage at ∼5 mg/ml) 13C-selectively labeled SL1ISS constructs in 100% D2O, 5 mm K2HPO4 (pH 6.5). RDC values were determined by taking the difference in 1JCH couplings under anisotropic and isotropic conditions.
Structure Calculations
Distance restraints used in structure calculations were extracted from 1H-1H NOESY (τm = 250 ms) spectra collected on full-length SL1ISS constructs prepared with different combinations of 2H-labeled rNTPs. The smaller constructs (SL1ISS-33 and SL1ISS-25) were used only to aid in chemical shift assignments. Restraint boundaries were defined qualitatively by the intensity of the NOE and grouped into strong (1.8–3.0 Å), medium (2.5–4.5 Å), weak (3.5–6.0 Å), and very weak (3.5–7.5 Å) bins. Very weak distance restraints were only applied for residues from the apical and bulge loops. Sugar pucker restraints were extracted from analysis of H1′-H2′ TOCSY cross-peak intensities. Medium to strong TOCSY cross-peaks were observed for three of the five nucleotides (7930–7932) in the apical loop. Additionally, the bulge loop uridines (7923–7924) showed moderate H1′-H2′ TOCSY peaks. These residues were therefore allowed to sample both C2′-endo and C3′-endo conformations. All other residues have C3′-endo sugar puckers. A-form distance restraints involving H8/H6 to H3′-H4′ were included based on observed NOE interactions between H8/H6 and H1′-H2′ and knowledge of the sugar puckers.
Standard A-form backbone dihedral angle restraints (±20°) were applied to all residues except 7923, 7924, and 7930–7932. Finally, the glycosidic angle was restrained to be anti (180 ± 90°) for all residues except G7930 and G7932, which were restrained in a syn (0 ± 90°) conformation as evident by a downfield C8 chemical shift (see below).
Hydrogen bond and planarity (Xplor-NIH only; 20 kcal/mol Å2) restraints were applied for all WC and UG base pairs that were consistent with one-dimensional 1H chemical shifts, 15N chemical shifts (1H-15N HSQC), and NOE cross-peak patterns derived from 1H-1H NOESY spectra collected in H2O and D2O. Loose hydrogen bond restraints were applied to residues involved in the 2X2 internal loop based on NOE cross-peak patterns (see below).
Initial SL1ISS structures (256) were calculated in Xplor-NIH 2.34 (25) as described previously (15) with the exception that the second stage gentle folding was not used (26); instead, the 10 lowest energy structures from Xplor-NIH were further refined in AMBER12 using the ff99bsc0χOL3 force field and Particle Mesh Ewald Molecular Dynamics. The structures were prepared for simulation in AMBER using xLeap. In both minimization and production runs, the SL1ISS constructs were simulated in implicit solvent using the pairwise generalized Born model (27, 28) with a 10 mm salt concentration along with a 24-Å cutoff for non-bonded interactions and a 10-Å cutoff for calculation of the Born radii.
The structures were first minimized over 4,000 steps using 2,000 steps of steepest descent followed by 2,000 steps of conjugate gradient. After minimization, 20 production runs were performed with 1 ns of simulation time (500,000 steps of 2 fs each). During this refinement step, the temperature was increased from 0 to 300 K over 100 ps, held at 300 K for 800 ps, and decreased from 300 to 0 K over 100 ps. NMR restraints were included at a constant weight (20 kcal mol−1 Å−1) for inter- and intranucleotide distances along with hydrogen bonding restraints. RDCs were implemented in the calculations as single value restraints containing weak weighting coefficients (0.1) (29). The alignment tensor was determined in AMBER by first fitting the tensor to the Xplor-NIH input structure. The initial tensor components were then simultaneously optimized along with the atomic coordinates. Langevin dynamics with a collision frequency of 1 ps−1 was used for temperature control, and SHAKE was used to constrain bonds involving hydrogen. The final 10 lowest energy structures were visualized in PyMOL (30), and quality assessments were performed using MolProbity (31).
Size Exclusion Chromatography in Line with Small Angle X-ray Scattering (SEC-SAXS) Analysis of SL1ISS
SEC-SAXS experiments were performed on SL1ISS (5 mm MES, 10 mm KCl (pH 6.5)) at BioCAT (beamline 18-ID, Advanced Photon Source). Data were collected and processed as described previously (16) with the exception of an extended detector q range (q ∼ 0.005–0.38 Å−1). Initial molecular reconstructions were performed in Primus (32) from the ATSAS (33) program suite. Guinier fitting was used to test for aggregation and estimate the radius of gyration (Rg) (Rg × q < 1.3), and the curve was fit to generate the pair distance distribution P(r) plot using GNOM (34). Initial ab initio models were created using DAMMIF (35) where 20 independent models were generated. The models were aligned and averaged using DAMAVER (36), and the most probable model from the average was generated using damfilt.
The final molecular envelope was calculated using DAMMIN (37) in slow mode. To reduce degeneracy among the models, a method similar to that used by Fang et al. (38) was implemented where a parallelepiped starting volume in DAMMIN was utilized with starting dimensions ∼20 Å greater than the initial damfilt model. Using the same GNOM output for initial reconstruction, 20 models were generated followed by alignment and averaging by DAMAVER. The damstart model generated by DAMAVER underwent a final refinement using DAMMIN in expert mode, producing a final molecular envelope with a χ2 value of 0.97 to the experimental data.
Incorporation of SAXS Molecular Reconstruction during AMBER Refinement
The resulting SAXS molecular envelope was used as a shape constraint in AMBER 12 using the EMAP module (39). The molecular envelope was fit to the lowest energy NMR-derived structure using SUPCOMB (40), allowing for an enantiomer search with the SAXS reconstruction. A 5-Å volumetric map was written from the SAXS ab initio bead model using the EMAP module. The simulation protocol was identical to the method described above with the addition that the SAXS molecular reconstruction was incorporated in the simulation (alongside NOE and RDC restraints) with a constraining constant (cmap) of 0.01 kcal/g. The SAXS refined structure and lowest energy NMR structure were compared with the experimental scattering curve in CRYSOL (41) and visualized in PyMOL (25).
UP1 Expression and Purification
The C-terminal His6-tagged UP1 protein was prepared as described previously (15).
Analytical Size Exclusion Chromatographic Titrations
Chromatographic titrations were carried out using a Superdex 200 10/300 GL column (GE Healthcare). The SL1ISS-33 RNA was prepared as described above. Each sample contained 5 μm RNA dissolved in binding buffer (10 mm K2HPO4, 120 mm KCl,10 mm NaCl, 0.5 mm EDTA, 5 mm DTT (pH 6.5)). Four samples were prepared for analysis: free SL1ISS-33 and UP1-SL1ISS-33 at 0.5:1, 1:1, and 2:1 molar ratios. 100 μl of each sample was loaded onto the analytical column and run at a constant flow rate of 0.5 ml/min.
Calorimetric Titrations of UP1
Calorimetric titration studies were carried out at 25 °C using a VP-ITC calorimeter (MicroCal, LLC) with the SL1ISS-33 and SL1ISS-25 RNA oligonucleotides. Each RNA sample was prepared by diluting to a concentration of 2.5 μm in binding buffer (10 mm K2HPO4, 120 mm KCl, 10 mm NaCl, 0.5 mm EDTA, 1 mm tris(2-carboxyethyl)phosphine (pH 6.5)). C-terminal His6-tagged UP1 protein was prepared for the titration studies by exchanging it in the same binding buffer as used for RNA sample preparation using the Amicon Ultra-4 centrifugal filter devices. The UP1 protein (∼50 μm) was titrated into ∼1.4 ml of 2.5 μm RNA over 36 injections of 8 μl each. Prior to fitting to a 1:1 binding isotherm in Origin v7.0, the raw data were corrected for heats of dilution by subtracting the average of the last eight values of the titration curve.
NMR Titrations of UP1-SL1ISS-25
TROSY HSQC titrations were carried out using 13C-selectively labeled SL1ISS-25 constructs and unlabeled UP1. Spectra were collected at four different molar ratios (protein:RNA), 0.25, 0.5, 0.75, and 1.0, in 5 mm K2HPO4 (pH 6.5) at 310 K.
Results
The ISS Element Folds into a Phylogenetically Conserved Stem Loop
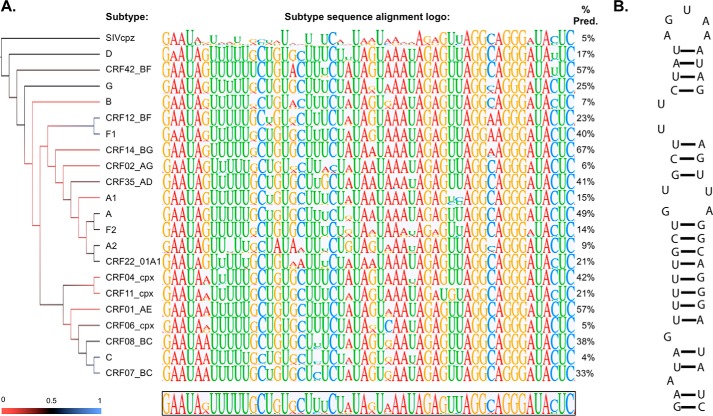
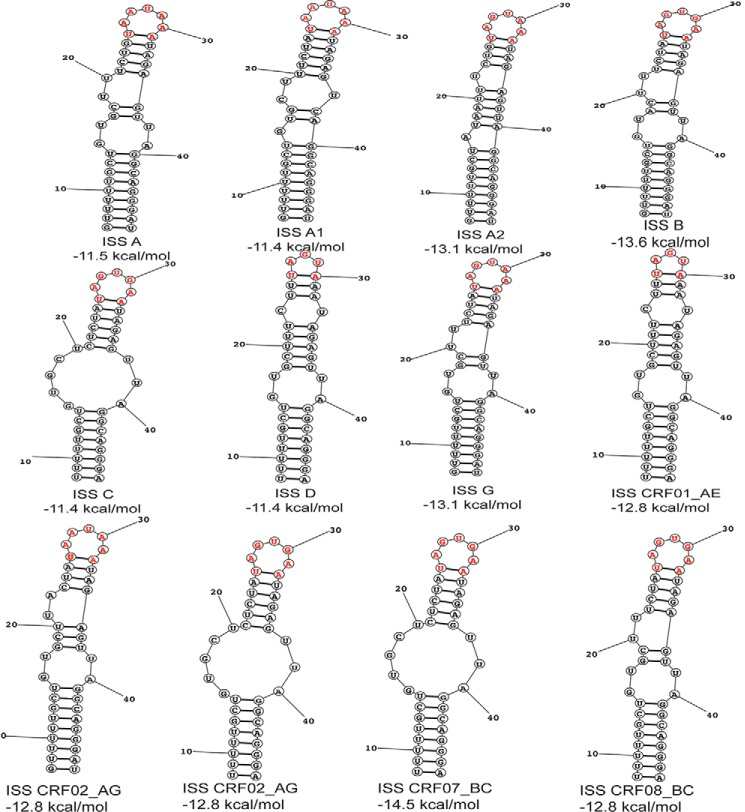
To assess the conservation of the RNA region surrounding ISS, we performed phylogenetic alignments of HIV-1 group M subtype reference strains for which there were at least 10 sequences in the Los Alamos HIV-1 database. We also included sequences from SIVcpz. In total, we analyzed 10,353 HIV-1 and 17 SIVcpz sequences. Maximum likelihood analysis for group M subtype-specific and SIVcpz consensus sequences revealed relatively low evolutionary diversity for the ISS element with a mean genetic distance of 0.06 ± 0.02 substitution per site in contrast to ∼0.45 substitution per site (42) reported for the surrounding HIV-1 env region as a whole. Fig. 2A shows subtype-specific consensus logos determined from the alignments and the corresponding maximum likelihood phylogenetic tree. As expected from the maximum likelihood analysis, the group M consensus sequences exhibit a very high degree of conservation with a conspicuous 5-nt uridine tract and a complimentary 5′-AGGGA-3′ motif centered ∼36 nt downstream. The 5′-AGGGA-3′ motif is also conserved in SIVcpz; however, the uridine tract is variable. Secondary structure predictions (group M sequences) using the most frequently occurring nucleotides from the global consensus sequence reveal that these subregions base pair to fold a stem loop structure that consists of a 5-nt apical loop, a 2X2 internal loop, a UU bulge, and an unpaired G (Fig. 2B). The consensus secondary structure determined here agrees with earlier phylogenetic work based on a much smaller set of group M sequences (12, 13). Folding of consensus sequences from individual subtypes further supports that the ability to form a stem loop structure is a phylogenetic feature of this region of env wherein a perfectly base-paired lower helix and purine-rich apical loop are the most conserved secondary structural elements (Fig. 3). The variations in the size of the apical and internal loops observed might augment the strength of the ISS element in a clade-specific manner. Despite the predominance of the ISS stem loop structure across group M viruses, compensatory base pair substitutions are not observed. The lack of covariation indicates that this region of env is under tight pressure to maintain amino acid identity. Nevertheless, the gross features of the ISS stem loop determined here are observed in the most recent SHAPE map of the HIV-1NL43 genome, which was recalibrated based on phylogenetic comparisons with SIVcpz and SIVmac (17). Therefore, we conclude that the ISS element exists in a genomic region capable of forming intramolecular base pairs.
FIGURE 2.
Phylogenetic analysis reveals highly conserved regions within ISS. A, results of phylogenetic analysis for HIV-1 group M subtypes and SIVcpz sequences are represented using a maximum likelihood reconstructed cladogram (left) and subtype-specific consensus logos (middle). The height of the individual nucleotides within the logos is proportional to the observed frequency of the nucleotide at the particular position within the alignment. The percentage of sequences within a given strain that exactly match the consensus logo is given to the right. The region shown corresponds to residues 7904–7955 using the Bru numbering system. B, predicted secondary structure using the most frequently occurring nucleotides of the global consensus logo. As illustrated, ISS folds into a phylogenetically conserved stem loop structure that exposes an AGUGA apical loop. Pred., predicted.
FIGURE 3.
Predicted secondary structures of representative HIV-1 ISS elements derived from group M strains. Secondary structures and folding free energies were predicted using the RNAstructure software (51).
NMR Analysis of the ISS Stem Loop
To determine the three-dimensional structure of the RNA region surrounding ISS, we in vitro transcribed a 53-nt construct (SL1ISS; corresponding to residues 7904–7955 of HIV-1Bru), which included a non-native terminal GC base pair needed for efficient transcription. We also prepared two shorter constructs, SL1ISS-33 (7915–7944) and SL1ISS-25 (7920–7942), that were used to facilitate chemical shift assignments. G7909 was removed from the SL1ISS construct because the 1H imino spectra were consistently poor under various solution conditions. The low spectral quality of constructs containing G7909 likely result from local dynamics induced by the bulge, which is consistent with its high chemoenzymatic reactivity observed during RNA structure probing (12, 13).
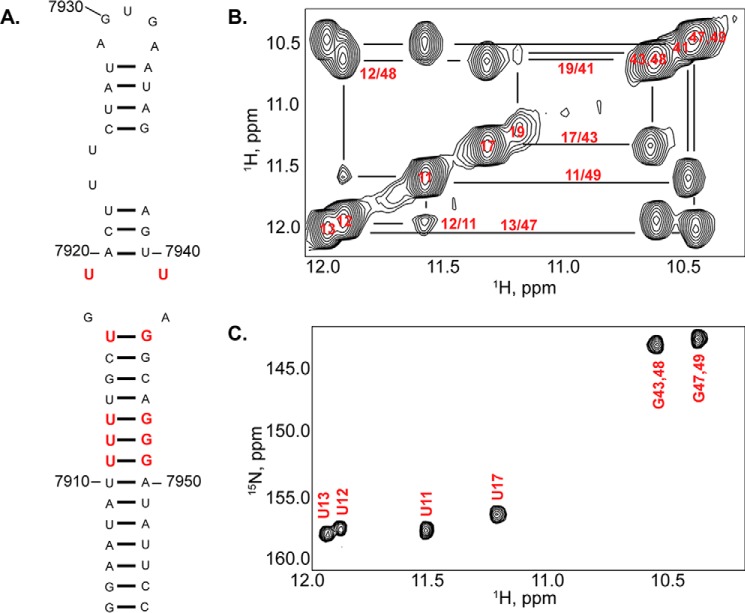
The secondary structure of SL1ISS was verified by 1H-1H NOESY spectra collected in water (288 K) where base-specific imino assignments were further confirmed on a [15N]GU-selectively labeled SL1ISS construct. Fig. 4 shows the upfield imino region of the 1H-1H NOESY along with the corresponding 1H-15N HSQC. Signature NOE cross-peaks and chemical shifts are observed for the three consecutive UG wobble pairs located within the center portion of the lower stem. U7917 H3 gives a strong NOE to G7943 H1, which is consistent with a standard UG wobble base pair adjacent to the 2X2 internal loop. A weak NOE is also observed between resonances at 11.20 and 10.56 ppm; however, the corresponding 1H-15N correlation peaks are not seen due to rapid solvent exchange. Rapid solvent exchange during the mixing time also precluded assignments of the imino shifts of WC base pairs from the upper helix; however, one-dimensional 1H spectra collected on SL1ISS-25 and SL1ISS-33 provided clear evidence that the upper helix folds with the expected number and type of base pairs (not shown).
FIGURE 4.
NMR analysis of the HIV-1Bru ISS stem loop. A, sequence and secondary structure diagram of SL1ISS studied here. Red nucleotides denote conserved UG and UU pairs. Note that G7909 was removed for NMR analysis, and the terminal GC base pair is non-native. B, upfield imino region of a 1H-1H NOESY (900 MHz and τm = 250 ms) spectrum collected in 5 mm K2HPO4 (288 K and pH 6.5) and 90% H2O, 10% D2O. Note that 7,900 should be added to the assignment labels to obtain the native HIV-1Bru numbering. Intense NOE cross-peaks are observed for all three predicted UG wobble pairs, and a weak NOE between U7919 and U7941 indicates that the WC edge of these bases faces inward. C, 1H-15N HSQC spectrum collected on a [15N]GU-labeled SL1ISS construct.
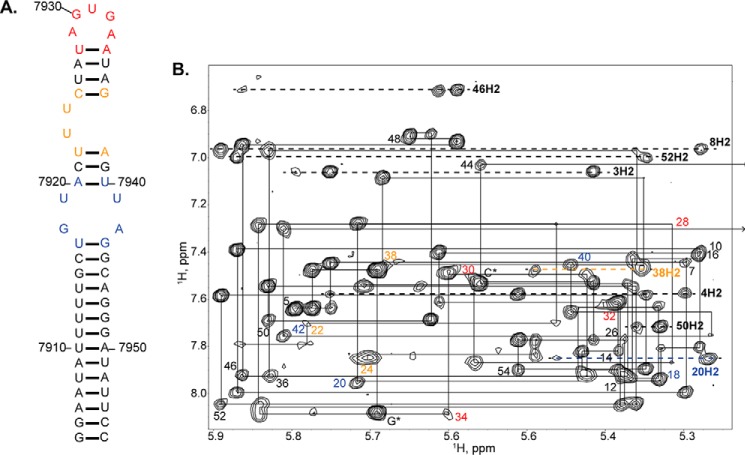
Chemical shift assignments of the non-exchangeable protons were made using multiple ISS constructs that varied in size and type of nucleotide selective labeling scheme. Fig. 5 shows a representative 1H-1H NOESY spectrum collected in 100% D2O (298 K and pH 6.5) on an SL1ISS construct where all ribose 3′-5″ positions and pyrimidine position 5 were selectively deuterated. In general, sharp and well resolved NOE cross-peaks were obtained with this labeling pattern. Sequential H8/H6 (i) to H1′ (i − 1) NOE cross-peaks are readily traced for residues 7904–7917 and 7943–7955 of the lower stem. In addition, adenines involved in AU base pairs give A-form NOE cross-peaks involving H2 to i + 1 H1′ on the same strand and i + 1 H1′ on the opposite strand (Fig. 5B).
FIGURE 5.
NMR evidence of stable SL1ISS structural elements. A, sequence and secondary structure diagram of SL1ISS where nucleotides are color-coded according to structural elements: black, helical regions; blue, 2X2 internal loop; orange, UU bulge; and red, 5-nt AGUGA apical loop. B, representative 1H-1H NOESY (900 MHz and τm = 250 ms) spectrum collected in 5 mm K2HPO4 (298 K and pH 6.5) and 100% D2O. Assignments of the intranucleotide NOE (H8/H6-H1′) interactions are indicated for every other nucleotide. Numbers are colored according to secondary structural elements shown in A. 7,900 should be added to the assignment labels to obtain the native HIV-1Bru numbering. Note that G* corresponds to the non-native guanosine added to increase transcription yields. Lines denote the sequential walk pathway, and the arrow indicates that the G7943 H1′ chemical shift is upfield (∼5 ppm) relative to all other H1′ chemical shifts.
Within the 2X2 internal loop, a continuous NOE walk pattern is traced along the 5′ side from U7917 to A7920 and along the 3′ side from U7940 to G7943. A7920 H2 gives a long range NOE to U7941 H1′, confirming that a standard A7920:U7940 base pair closes the 2X2 internal loop (Fig. 5B). Additional stacking interactions involving H8/H6 protons were also detected in the aromatic region of the 1H-1H NOESY (not shown). Interestingly, G7943 H1′ is shifted upfield to ∼5.0 ppm and gives a strong NOE to A7942 H2 and a medium NOE to G7944 H8. The chemical shift and NOE patterns of G7943 H1′ are consistent with it stacking below A7942 where the Hoogsteen edge of A7492 faces the center of the internal loop.
The NOE cross-peaks of the upper helix and apical loop were in general less pronounced than those observed within and below the 2X2 internal loop (Fig. 5) due to line broadening likely brought on by local millisecond dynamics. Nevertheless, NMR measurements for this region of SL1ISS were made using full-length SL1ISS, SL1ISS-33, and SL1ISS-25. First, strong H8/H6 (i) to H2′ (i − 1) NOE cross-peaks were detected for residues A7920–U7922, consistent with A-form geometry. Second, NOE cross-peaks from A7938 H2 to C7925 H1′ and G7939 H1′ reveal the U7923-U7924 stack outside the helix and the A7938-G7939 step is A-form. Third, downfield C8 chemical shifts of G7930 and G7932 imply that these bases predominantly adopt syn conformations about the glycosidic bond. Lastly, NOE interactions of moderate intensity were observed between A7933 and A7934, confirming their stacking interaction. The collective NOE cross-peak patterns and chemical shifts are consistent with ISS folding into a stem loop structure composed of consecutive UG wobble pairs, a 2X2 internal loop, and a conformationally flexible UU bulge and 5-nt apical loop.
Description of the SL1ISS Structure
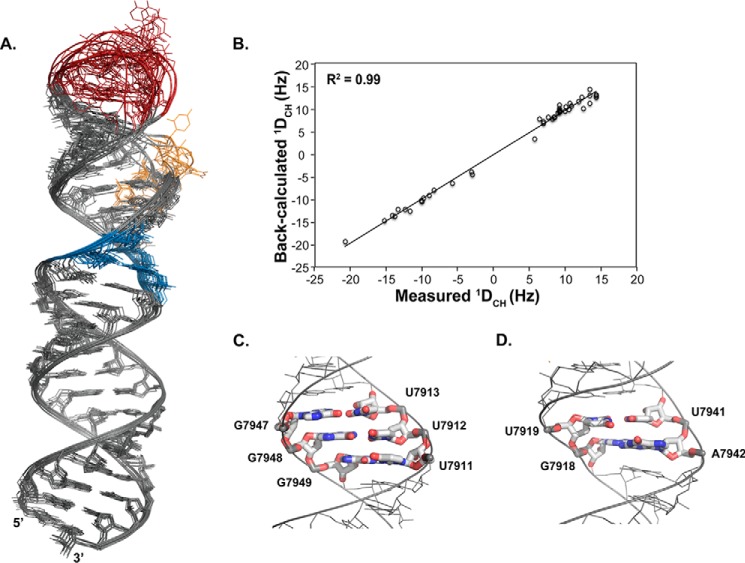
NMR structures were determined using 659 NOE distance restraints for an average of ∼12 restraints per nucleotide along with 44 CH RDC restraints (Table 1). Fig. 6A shows the ensemble of 10 low energy structures refined using a generalized Born implicit solvent model in AMBER (43). Heavy atom superimposition of base-paired residues from the lower (7904–7917 and 7943–7955) and upper (7920–7928 and 7934–7940) helices provide an r.m.s.d. value of 0.75 Å, indicating that the structures are well defined by the NMR data. Alignments of residues from just the lower or upper helices give r.m.s.d. values of 0.28 Å. In addition, comparison of measured and back-calculated RDC values for the lowest energy structure shows an excellent correlation (Fig. 6B).
TABLE 1.
Summary of NMR restraints and structure statistics of SL1ISS calculations
| Total geometrical restraints | |
| Intraresidue | 212 |
| Sequential (|i − j| = 1) | 322 |
| Long range | 14 |
| Hydrogen bonds | 108 |
| Repel | 2 |
| NOE restraints/residue | 10.3 |
| CH RDCs (base pairs only) | 44 |
| Sugar pucker | 173 |
| Phosphodiester backbone (not used in AMBER) | 302 |
| AMBER structure statistics | |
| Average energy (cal mol−1) | −11,332.35 |
| r.m.s.d. lower and upper helices (Å) | 0.75 |
| r.m.s.d. lower helix (nt 7904–7917 and 7943–7955) (Å) | 0.28 |
| r.m.s.d. upper helix (nt 7920–7928 and 7934–7940) (Å) | 0.28 |
| NOE violations (>0.4 Å) | 0 |
| MolProbity clash score (percentile) | 0, 100th |
FIGURE 6.
Three-dimensional structure of the ISS element. A, ensemble of 10 low energy AMBER structures of SL1ISS. The structures are superimposed using WC and UG base pairs only. B, correlation plot between measured and back-calculated RDCs for the lowest energy AMBER SL1ISS structure. C and D, close-up view of three consecutive UG wobble pairs (C) and 2X2 internal loop (D). The consecutive UG wobble pairs lead to a slightly wider major group (∼15.0 Å) with a unique arrangement of carbonyl exocyclic groups. The 2X2 internal loop also positions exocyclic carbonyl groups in the major groove and causes the helix to overwind locally with an average C1′-C1′ distance of 9.1 Å.
The SL1ISS structure reveals that residues 7904–7917 and 7943–7955 of the lower stem form a perfectly base-paired helix. Indeed, structural parameters determined using 3DNA (44) are consistent with A-form geometry (Table 2). The central portion of the lower helix consists of three consecutive UG wobble pairs where U7911-U7913 stack along the 5′ side and G7947-G7949 stack along the 3′ side. Stacking of three consecutive UG pairs leads to a slightly wider major groove (∼15.0 Å compared with 12.4 Å for WC bps) where a unique pattern of exocyclic carbonyl functional groups align to create an electronegative surface (Fig. 6C). Such arrangements of consecutive UG wobble pairs in RNA helices are known to modulate thermodynamic stability and provide sites of interactions for divalent cations, small molecules, and proteins (45).
TABLE 2.
3DNA helical parameters for residues 7904–7917 and 7943–7955 of the lowest energy SL1ISS structure
| Step | Shift | Slide | Rise | Tilt | Roll | Twist |
|---|---|---|---|---|---|---|
| GG/CC | −0.07 | −2.08 | 3.48 | 0.94 | 6.67 | 32.51 |
| GA/UC | −0.29 | −1.81 | 3.33 | −0.28 | 6.72 | 32.84 |
| AA/UU | −0.25 | −1.48 | 3.14 | −1.13 | 1.73 | 31.28 |
| AU/AU | 0.12 | −1.62 | 3.19 | 0.54 | 1.68 | 30.56 |
| UA/UA | −0.03 | −1.55 | 3.12 | −0.57 | 12.81 | 32.28 |
| AU/AU | −0.01 | −1.74 | 3.26 | 0.39 | 1.78 | 30.72 |
| UU/GA | 0.37 | −1.61 | 3.39 | 1.33 | 4.53 | 41.09 |
| UU/GG | 0.06 | −1.93 | 3.29 | 5.21 | 3.38 | 30.58 |
| UU/GG | 0.15 | −1.85 | 3.26 | 5.06 | 4.90 | 30.08 |
| UU/AG | −0.16 | −1.90 | 3.27 | 3.14 | 10.59 | 21.67 |
| UG/CA | 0.07 | −1.53 | 3.25 | −3.03 | 8.83 | 30.29 |
| GC/GC | 0.25 | −1.91 | 3.25 | 1.50 | −0.37 | 31.90 |
| CU/GG | 0.56 | −1.80 | 3.49 | 5.37 | 2.36 | 40.05 |
As expected from the NOE cross-peaks, the 2X2 internal loop adopts a stable architecture that is closed by a UG wobble and AU base pair (Fig. 7D). The Watson-Crick edge of G7918 faces the interior of the loop and is positioned across from the Hoogsteen edge of A7942. Structures refined using loose hydrogen bond restraints consistent with trans Hoogsteen/sugar edge sheared AG and cis Watson-Crick/Watson-Crick UU geometries produced local stacking interactions that are consistent with the observed NOE patterns. Moreover, molecular dynamic simulations conducted without hydrogen bonds reveal that the 2X2 internal loop is stable (not shown). Incorporation of the 2X2 internal loop slightly overwinds the helix as determined by the average C1′-C1′ distance of 9.1 Å across the AG and UU pairs compared with ∼10.5 Å for Watson-Crick pairs. The folded 2X2 internal loop determined here agrees with the low chemoenzymatic reactivity observed for these bases during RNA secondary structure probing of the isolated ssA7 locus (12, 13).
FIGURE 7.
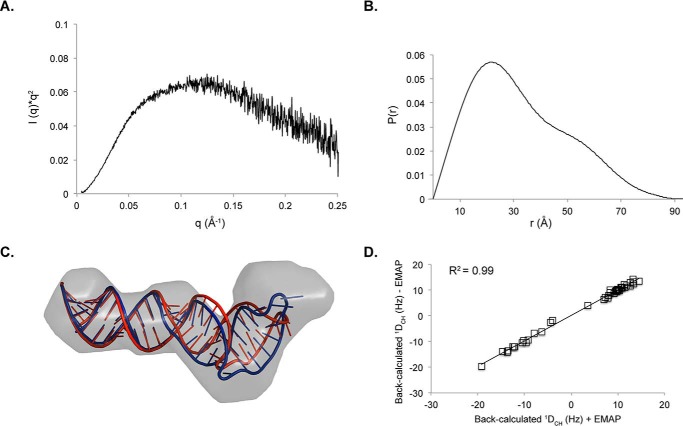
Small angle x-ray scattering of SL1ISS. A, Kratky profile of SL1ISS demonstrates that the RNA adopts a stable fold in solution. B, pair distance distribution function of SL1ISS. C, refinement of SL1ISS NMR structure against the SAXS reconstruction using AMBER. The SAXS molecular envelope is shown as a transparent surface with the lowest energy SL1ISS NMR structure (red) fit to the density. The NMR structure was jointly refined against NOE distance restraints, RDCs, and the molecular reconstruction (blue) using the EMAP force field term in AMBER. The two structures superimpose over all base pairs from the lower helix with an r.m.s.d. of 1.3 Å. D, correlation plot between back-calculated RDC values with (x axis) and without (y axis) inclusion of the molecular reconstruction during refinement.
The upper helix consists of seven Watson-Crick base pairs where U7923 and U7924 bulge out to allow partial stacking of U7922:A7938 and C7925:G7937 base pairs. Consistent with the sparse NOE interactions, the 5-nt apical loop samples multiple conformations, although some residual structural features exist.
Small Angle X-ray Scattering Provides Complimentary Insight into the Global Shape of SL1ISS
We further assessed the global shape of SL1ISS by SEC-SAXS. Fig. 7A shows the Kratky profile (I(q) × q2 versus q where q is the scattering angle and I(q) is the scattering intensity) of the scattering data collected on SL1ISS (∼7 mg/ml) in 10 mm MES, 10 mm KCl (pH 6.5). The inverted parabolic shape of the Kratky plot reveals that SL1ISS folds into a stable structure, consistent with our NMR results. The Rg calculated from the linear region of the Guinier plot is 24.9 Å, which coincides with the approximate width of an A-form RNA helix. The shape of the pair distance distribution function P(r) indicates that SL1ISS adopts a kinked cylindrical structure with a maximum dimension of ∼90 Å (Fig. 7B).
Twenty ab initio molecular reconstructions of SL1ISS were used to determine the final DAMMIN-refined model. The theoretical molecular mass determined from the excluded volume is 18.9 kDa, which agrees favorably with the expected molecular mass (17.2 kDa) of SL1ISS. The overall size of the SAXS reconstruction easily accommodates the NMR-determined structure (Fig. 7C); however, back-calculation of the scattering curve from the NMR structure gave a χ2 value of 4.7. The slightly higher χ2 value suggests that the global NMR structure of SL1ISS differs slightly from the SAXS data. To test whether incorporation of SAXS-derived shape information can improve agreement between experimental and back-calculated scattering data, we developed a simulation schedule in AMBER wherein the structure was jointly refined against NOE distance restraints, RDCs, and the SAXS molecular reconstruction. Restraint information and energy terms for the SAXS reconstruction were implemented using the EMAP force field in AMBER (39). Fig. 7C shows the comparison between the starting low energy NMR structure and the structure refined against the SAXS reconstruction. The SAXS-refined structure reduced the χ2 value to 3.4 and led to a slight reorientation of the upper helix relative to the starting NMR structure. The upper helix reorients about the 2-nt bulge loop, which acts as a flexible hinge to allow interhelical motions. The higher χ2 value of the NMR-only structure is likely a result of poor conformational sampling of the upper helix when only NOE restraints and sparse RDCs are used. Comparison of the back-calculated RDC values with and without the EMAP force field parameters reveals excellent agreement (Fig. 7D). Thus, inclusion of SAXS molecular reconstructions during RNA structure refinement represents a new approach to determine global conformational properties of large RNAs. Efforts are underway to further benchmark and validate this approach.
Calorimetric and NMR Titrations Reveal That the UP1 Domain of hnRNP A1 Binds the ISS Apical Loop Specifically and with High Affinity
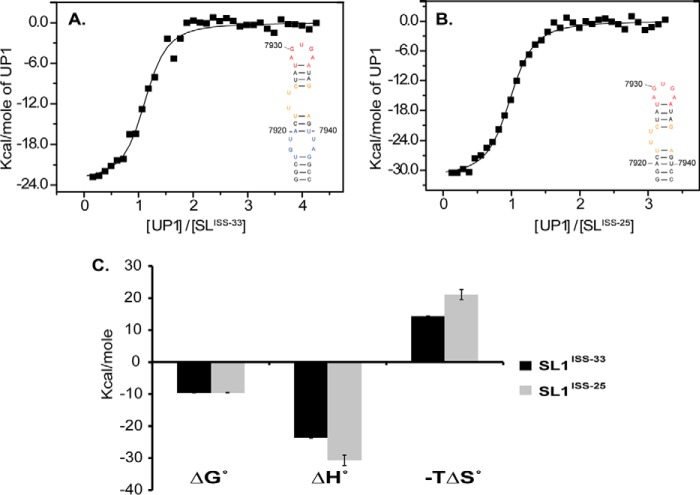
Biochemical footprinting studies showed that hnRNP A1 interacts with ISS where discrete protections were observed primarily within the apical loop and along the 3′ side of the upper helix, including residues of the 2X2 internal loop (12, 13). The protection pattern suggests that either multiple hnRNP A1 molecules load onto the ISS stem loop, binding of hnRNP A1 induces changes in the RNA structural dynamics, or the C-terminal domain makes nonspecific contacts with the RNA. To gain insights into the mode of specific interactions, calorimetric titrations were performed using the UP1 domain of hnRNP A1 with SL1ISS-33 and SL1ISS-25. Titrations using full-length hnRNP A1 were not feasible due to protein aggregation under our solution conditions. SL1ISS-33 contains the bulge, apical, and internal loops, whereas the internal loop is removed in SL1ISS-25. Comparisons of thermodynamic parameters between the two constructs offer insights into the influence of RNA structural elements toward binding free energies. Fig. 8 shows titration curves and thermodynamic parameters of UP1 with SL1ISS-33 and SL1ISS-25. UP1 binds both stem loops with nm affinities (Kd(SL1ISS-33) = 100.3 ± 19.0 nm and Kd(SL1ISS-25) = 106.3 ± 16.2 nm) wherein the thermodynamic driving force is a large favorable change in total binding enthalpy (Table 3). Given the similarities in the thermodynamic profiles, the calorimetric data suggest that UP1 interacts with SL1ISS-33 and SL1ISS-25 through a common surface.
FIGURE 8.
UP1 binds the apical loop of SL1ISS specifically and with high affinity. Calorimetric titrations of UP1-SL1ISS-33 (A) and UP1-SL1ISS-25 (B) conducted at 298 K in binding buffer (see “Experimental Procedures”) are shown. Secondary structures of SL1ISS-33 and SL1ISS-25 are shown in the insets. The normalized thermograms were fit to a single site binding isotherm. C, plot of the thermodynamic parameters (average ± S.D. (error bars) of three replicates) determined by non-linear fits to the binding isotherms.
TABLE 3.
Thermodynamic profiles of the interactions of UP1 with ISS constructs
| ISS constructs | ΔG0 | ΔH0 | −TΔS0 | Kd | n |
|---|---|---|---|---|---|
| nm | |||||
| SL1ISS-33 | −9.55 ± 0.09 | −23.59 ± 0.17 | 14.24 ± 0.09 | 100.33 ± 19.01 | 1.07 ± 0.01 |
| SL1ISS-25 | −9.56 ± 0.07 | −30.68 ± 1.62 | 21.12 ± 1.56 | 106.33 ± 16.21 | 0.93 ± 0.02 |
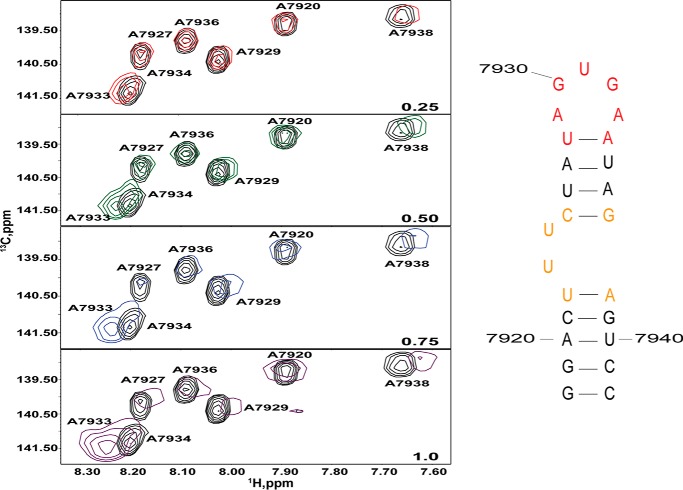
To gain residue-specific insights into the UP1 binding surface on SL1ISS, 1H-13C TROSY HSQC titrations (310 K and 900 MHz) were carried out using an [13C]A-selectively labeled SL1ISS-25 construct. Fig. 9 shows spectral plots of the C8-H8 region following stepwise addition of unlabeled UP1. At a 0.5:1.0 molar ratio of UP1 to SL1ISS-25, correlation peaks for free and bound A7933 are observed. As the molar ratio increases to 1:1, only the bound form of A7933 is observed. A7934 also exhibits similar spectral properties, although the chemical shifts of the free and bound forms are less resolved. Minor perturbations are also seen at positions 7927 and 7938. A7920, A7929, and A7936, which are all involved in stable WC base pairs, do not experience significant chemical shift perturbations. Collectively, the NMR titrations reveal that UP1 binds site-specifically to SL1ISS-25and in a manner that preserves its overall secondary structure.
FIGURE 9.
NMR detection of the UP1-SL1ISS binding interface. 1H-13C TROSY HSQC titrations (310 K and 900 MHz) were performed by titrating unlabeled UP1 into a [13C]A-selectively labeled SL1ISS-25 construct. Spectral plots correspond to the C8-H8 region for each titration point as indicated by the molar ratio (lower right). Addition of UP1 leads to significant chemical shift perturbations of apical loop adenosines (7933 and 7934) and A7938.
We further assessed the stoichiometry and homogeneity of the UP1-SL1ISS-33 complex by performing stepwise titrations using analytical size exclusion chromatography (not shown). At a 0.5:1 (UP1:SL1ISS-33) molar ratio, two well resolved and symmetrical peaks are observed corresponding to free SL1ISS-33 and the UP1-SL1ISS-33 complex. Increasing the molar ratio to 1:1 leads to a stoichiometric shift of the free RNA to its bound form. At excess UP1, a single well resolved and symmetrical peak corresponding to the complex is observed. Taken together, the calorimetric, NMR, and SEC data reveal that UP1 binds the ISS stem loop element as a 1:1 complex specifically and with high affinity.
Discussion
Balanced expression of the HIV-1 genome is controlled in part through alternative splicing of the 9-kb polycistronic transcript. The pool of spliced mRNAs consists of many different isoforms that vary with the viral life cycle. The virus has developed strategies to maintain transcript homeostasis by using cis RNA sequence elements that recruit host RNA-binding proteins to modulate the activities of donor and acceptor sites. The series of events that control HIV-1 splicing are not well understood; however, there is growing precedence that RNA structure modulates HIV-1 splicing (46, 47). Therefore, an understanding of mechanisms that determine how frequently a splice site gets utilized requires accurate knowledge of the RNA interactions surrounding it.
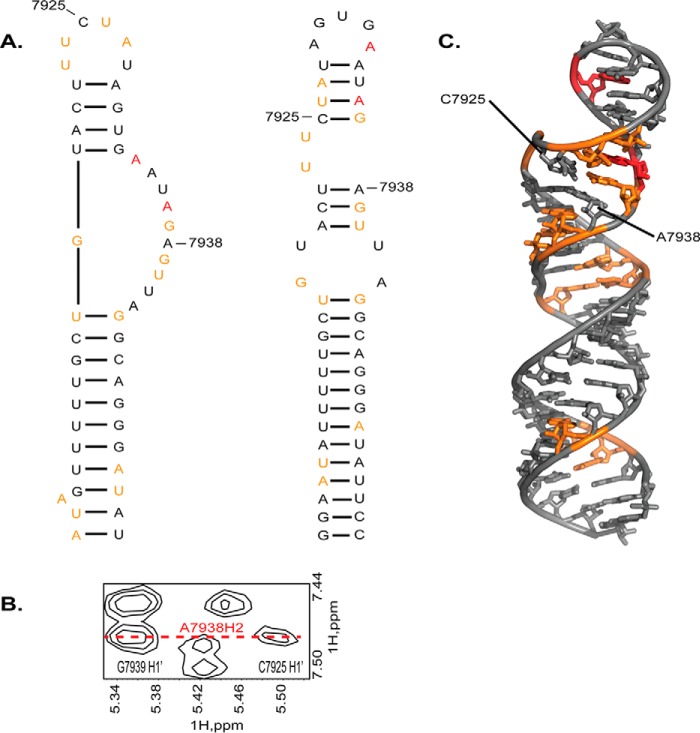
Early chemoenzymatic probing of the RNA region near splice site A7 revealed that the ISS element folds into a stem loop structure consistent with our phylogenetic model (12, 13); however, this feature was not observed in the original SHAPE map of the entire HIV-1 genome (48). In a more recent SHAPE model restrained with nucleotide covariation, the lower SL1ISS helix, including the consecutive UG wobble pairs, are detected (17), but differences in base pair arrangements of the upper helix lead to a 6-nt UUCUAU apical loop instead of a 5-nt AGUGA loop (Fig. 10A). The AGUGA sequence is restrained to base pair with a complementary UCAC sequence to form a 4-bp upper helix. Because human hnRNP A1 binds AGUGA to suppress splicing at site A7 (12, 13), its location (base-paired or exposed) is key to understanding the mechanism of A7 activity.
FIGURE 10.
Comparison of SHAPE-calculated and phylogenetic models of SL1ISS. A, left, secondary structure of SL1ISS determined by SHAPE modification and covariation analysis within the context of the entire HIV-1 genome (17). Right, alternative model of SL1ISS determined by phylogenetic comparisons and chemoenzymatic probing of the isolated ssA7 locus (12, 13). B, NOE evidence that the upper helix of SL1ISS folds with a structure consistent with the phylogenetic model. C, mapping of the SHAPE reactivity data onto the three-dimensional structure of SL1ISS shows that ∼87% of the low and medium reactive nucleotides can be accommodated in regions of stable structure.
In the SHAPE model, A7938 is far away from C7925, yet we observe a medium intensity NOE between A7938 H2 and C7925 H1′ (Fig. 10B). The presence of this NOE indicates that C7925 stacks near A7938. The H2 of A7938 also gives a strong NOE to G7939 H1′. These collective NOE patterns indicate that this region of the upper helix adopts local A-form geometry. Interestingly, A7938 and C7925 are unreactive toward the SHAPE reagent, which is more consistent with both being involved in stable secondary structure as opposed to unstructured loops. Indeed, satisfying the A7938 H2 to C7925 H1′ NOE would lead to a local refolding of the SHAPE model to agree with the phylogenetic consensus structure. In doing so, ∼87% (13 of 15) of the residues that show low to medium SHAPE reactivity are accommodated in either WC or non-WC base pairs (Fig. 10C).
The low reactivity of AGUGA is not explained by our NMR data, however. The three-dimensional structure of SL1ISS revealed that the apical loop is flexible where some residual structure exists as determined by the NOE interactions. The residual structure might limit reactivity with the SHAPE reagent but not at the level of being unreactive. A possible explanation is that the AGUGA loop is involved in RNA-RNA tertiary interactions within the context of genomes extracted from virions (48).
Our calorimetric titrations with SL1ISS-33 and SL1ISS-25 revealed that both stem loops interact with UP1 as a 1:1 complex and with identical affinities (Table 3). The smaller SL1ISS-25 construct lacks residues involved in the 2X2 internal loop, and thus it is unlikely to fold with an exposed 6-nt UUCUAU apical loop as seen in the SHAPE model. To that point, analogous NOE cross-peak patterns involving A7938 H2 are observed in spectra collected on SL1ISS-25. Therefore, our results are consistent with earlier footprinting data that showed that the primary hnRNP A1 binding site is the 5-nt AGUGA apical loop.
In closing, there are now four different secondary structural models of the HIV-1 genome (17, 48–50). The original SHAPE-derived model has been reinterpreted once by incorporating mutational profiling (49) and more recently by including phylogenetic restraints (17). During the preparation of this manuscript, Kjems and co-workers (50) published yet another model of HIV-1 wherein the conclusion is that only 31% of the base pairs they identified are common to the original SHAPE model. The multiplicity of secondary structural models of the HIV-1 genome presents real challenges for structural biochemists that seek to better interpret the molecular functions of yet uncharacterized HIV-1 RNA elements. Perhaps when global chemical reactivity profiles and phylogenetic covariation disagree, structural studies on isolated genomic regions can provide details of the “foldability” of RNA structure. These structures can then guide targeted mutations to test the biological implications of disrupting or deleting elements of secondary structure. Toward that end, we solved the three-dimensional structure of a conserved genomic region that surrounds the intronic splicing silencer acting on acceptor site A7. Our structure reveals that this region folds into a stable stem loop that exposes an apical AGUGA loop. Using calorimetric and NMR titrations, we further revealed that the UP1 domain of hnRNP A1 binds site-specifically through the apical loop wherein the body of the stem loop structure is preserved. Thus, this work reveals that HIV-1 uses a phylogenetically conserved RNA structure to recruit the host hnRNP A1 protein upstream to acceptor site A7. When combined with our previous studies on ESS3 (14, 16), the mechanism that begins to emerge is one wherein the RNA structure functions as a scaffold to direct the assembly of a functional protein-RNA complex that occludes site A7. This work puts us one step closer to determining the architecture of the intact complex.
Author Contributions
N. J., C. E. M., and B. S. T. designed the studies and wrote the paper. N. J. prepared all RNA constructs, analyzed NMR spectra, and performed biochemical titrations. B. S. T. and C. E. M. performed structure calculations. C. E. M. collected and analyzed SEC-SAXS data. B. D. R. and M. S. performed phylogenetic analysis.
Acknowledgments
The Bruker Avance III HD (500-MHz) spectrometer and Prodigy broadband cryoprobe were purchased using funds provided by National Science Foundation Grant 1334048. This research also used resources of the Advanced Photon Source, a United States Department of Energy (DOE) Office of Science User Facility operated for the DOE Office of Science by Argonne National Laboratory under Contract DE-AC02-06CH11357. This project was also supported by Grant P41 GM103622 from the National Institute of General Medical Sciences of the National Institutes of Health. Use of the Pilatus 3 1M detector was provided by National Institutes of Health Grant 1S10OD018090-1.
This work was supported by National Institutes of Health Grants R01 GM101979 (to B. S. T.), P50 GM103297 (to M. S. and B. S. T.). The authors declare that they have no conflicts of interest with the contents of this article. The content is solely the responsibility of the authors and does not necessarily represent the official views of the National Institutes of Health.
The atomic coordinates and structure factors (code 2N4L) have been deposited in the Protein Data Bank (http://wwpdb.org/).
Chemical shifts have been deposited in the Biological Magnetic Resonance Data Bank under accession number 25671.
- HIV-1
- human immunodeficiency virus type 1
- ISS
- intronic splicing silencer
- hnRNP
- heterogeneous nuclear ribonucleoprotein
- ESS
- exonic splicing silencer
- ESE
- exonic splicing enhancer
- ssA7
- splice site A7
- SL
- stem loop
- nt
- nucleotide(s)
- rNTP
- ribonucleoside triphosphate
- r.m.s.d.
- root mean square deviation
- RDC
- residual dipolar coupling
- HSQC
- heteronuclear single quantum coherence
- TROSY
- transverse relaxation optimized spectroscopy
- SEC-SAXS
- size exclusion chromatography in line with small angle x-ray scattering
- SIV
- simian immunodeficiency virus.
References
- 1. Karn J., and Stoltzfus C. M. (2012) Transcriptional and posttranscriptional regulation of HIV-1 gene expression. Cold Spring Harb. Perspect. Med. 2, a006916. [DOI] [PMC free article] [PubMed] [Google Scholar]
- 2. Purcell D. F., and Martin M. A. (1993) Alternative splicing of human immunodeficiency virus type 1 mRNA modulates viral protein expression, replication, and infectivity. J. Virol. 67, 6365–6378 [DOI] [PMC free article] [PubMed] [Google Scholar]
- 3. Ocwieja K. E., Sherrill-Mix S., Mukherjee R., Custers-Allen R., David P., Brown M., Wang S., Link D. R., Olson J., Travers K., Schadt E., and Bushman F. D. (2012) Dynamic regulation of HIV-1 mRNA populations analyzed by single-molecule enrichment and long-read sequencing. Nucleic Acids Res. 40, 10345–10355 [DOI] [PMC free article] [PubMed] [Google Scholar]
- 4. Stoltzfus C. M. (2009) Chapter 1. Regulation of HIV-1 alternative RNA splicing and its role in virus replication. Adv. Virus Res. 74, 1–40 [DOI] [PubMed] [Google Scholar]
- 5. Stoltzfus C. M., and Madsen J. M. (2006) Role of viral splicing elements and cellular RNA binding proteins in regulation of HIV-1 alternative RNA splicing. Curr. HIV Res. 4, 43–55 [DOI] [PubMed] [Google Scholar]
- 6. Lee Y., and Rio D. C. (2015) Mechanisms and regulation of alternative pre-mRNA splicing. Annu. Rev. Biochem. 84, 291–323 [DOI] [PMC free article] [PubMed] [Google Scholar]
- 7. Tange T. Ø., and Kjems J. (2001) SF2/ASF binds to a splicing enhancer in the third HIV-1 tat exon and stimulates U2AF binding independently of the RS domain. J. Mol. Biol. 312, 649–662 [DOI] [PubMed] [Google Scholar]
- 8. Tange T. O., Damgaard C. K., Guth S., Valcárcel J., and Kjems J. (2001) The hnRNP A1 protein regulates HIV-1 tat splicing via a novel intron silencer element. EMBO J. 20, 5748–5758 [DOI] [PMC free article] [PubMed] [Google Scholar]
- 9. Asai K., Platt C., and Cochrane A. (2003) Control of HIV-1 env RNA splicing and transport: investigating the role of hnRNP A1 in exon splicing silencer (ESS3a) function. Virology 314, 229–242 [DOI] [PubMed] [Google Scholar]
- 10. Amendt B. A., Si Z. H., and Stoltzfus C. M. (1995) Presence of exon splicing silencers within human immunodeficiency virus type 1 tat exon 2 and tat-rev exon 3: evidence for inhibition mediated by cellular factors. Mol. Cell. Biol. 15, 4606–4615 [DOI] [PMC free article] [PubMed] [Google Scholar]
- 11. Staffa A., and Cochrane A. (1994) The tat/rev intron of human immunodeficiency virus type 1 is inefficiently spliced because of suboptimal signals in the 3′ splice site. J. Virol. 68, 3071–3079 [DOI] [PMC free article] [PubMed] [Google Scholar]
- 12. Damgaard C. K., Tange T. O., and Kjems J. (2002) hnRNP A1 controls HIV-1 mRNA splicing through cooperative binding to intron and exon splicing silencers in the context of a conserved secondary structure. RNA 8, 1401–1415 [DOI] [PMC free article] [PubMed] [Google Scholar]
- 13. Marchand V., Méreau A., Jacquenet S., Thomas D., Mougin A., Gattoni R., Stévenin J., and Branlant C. (2002) A Janus splicing regulatory element modulates HIV-1 tat and rev mRNA production by coordination of hnRNP A1 cooperative binding. J. Mol. Biol. 323, 629–652 [DOI] [PubMed] [Google Scholar]
- 14. Rollins C., Levengood J. D., Rife B. D., Salemi M., and Tolbert B. S. (2014) Thermodynamic and phylogenetic insights into hnRNP A1 recognition of the HIV-1 exon splicing silencer 3 element. Biochemistry 53, 2172–2184 [DOI] [PMC free article] [PubMed] [Google Scholar]
- 15. Levengood J. D., Rollins C., Mishler C. H., Johnson C. A., Miner G., Rajan P., Znosko B. M., and Tolbert B. S. (2012) Solution structure of the HIV-1 exon splicing silencer 3. J. Mol. Biol. 415, 680–698 [DOI] [PubMed] [Google Scholar]
- 16. Morgan C. E., Meagher J. L., Levengood J. D., Delproposto J., Rollins C., Stuckey J. A., and Tolbert B. S. (2015) The first crystal structure of the UP1 domain of hnRNP A1 bound to RNA reveals a new look for an old RNA binding protein. J. Mol. Biol. 427, 3241–3257 [DOI] [PMC free article] [PubMed] [Google Scholar]
- 17. Lavender C. A., Gorelick R. J., and Weeks K. M. (2015) Structure-based alignment and consensus secondary structures for three HIV-related RNA genomes. PLoS Comput. Biol. 11, e1004230. [DOI] [PMC free article] [PubMed] [Google Scholar]
- 18. Thompson J. D., Higgins D. G., and Gibson T. J. (1994) CLUSTAL W: improving the sensitivity of progressive multiple sequence alignment through sequence weighting, position-specific gap penalties and weight matrix choice. Nucleic Acids Res. 22, 4673–4680 [DOI] [PMC free article] [PubMed] [Google Scholar]
- 19. Tamura K., Peterson D., Peterson N., Stecher G., Nei M., and Kumar S. (2011) MEGA5: molecular evolutionary genetics analysis using maximum likelihood, evolutionary distance, and maximum parsimony methods. Mol. Biol. Evol. 28, 2731–2739 [DOI] [PMC free article] [PubMed] [Google Scholar]
- 20. Tamura K., Nei M., and Kumar S. (2004) Prospects for inferring very large phylogenies by using the neighbor-joining method. Proc. Natl. Acad. Sci. U.S.A. 101, 11030–11035 [DOI] [PMC free article] [PubMed] [Google Scholar]
- 21. Hasegawa M., Kishino H., and Yano T. (1985) Dating of the human-ape splitting by a molecular clock of mitochondrial DNA. J. Mol. Evol. 22, 160–174 [DOI] [PubMed] [Google Scholar]
- 22. Delaglio F., Grzesiek S., Vuister G. W., Zhu G., Pfeifer J., and Bax A. (1995) NMRPipe: a multidimensional spectral processing system based on UNIX pipes. J. Biomol. NMR 6, 277–293 [DOI] [PubMed] [Google Scholar]
- 23. Johnson B. A., and Blevins R. A. (1994) NMRview: a computer program for the visualization and analysis of NMR data. J. Biomol. NMR 4, 603–614 [DOI] [PubMed] [Google Scholar]
- 24. Al-Hashimi H. M., Gosser Y., Gorin A., Hu W., Majumdar A., and Patel D. J. (2002) Concerted motions in HIV-1 TAR RNA may allow access to bound state conformations: RNA dynamics from NMR residual dipolar couplings. J. Mol. Biol. 315, 95–102 [DOI] [PubMed] [Google Scholar]
- 25. Schwieters C. D., Kuszewski J. J., Tjandra N., and Clore G. M. (2003) The Xplor-NIH NMR molecular structure determination package. J. Magn. Reson. 160, 65–73 [DOI] [PubMed] [Google Scholar]
- 26. Clore G. M., and Kuszewski J. (2003) Improving the accuracy of NMR structures of RNA by means of conformational database potentials of mean force as assessed by complete dipolar coupling cross-validation. J. Am. Chem. Soc. 125, 1518–1525 [DOI] [PubMed] [Google Scholar]
- 27. Bashford D., and Case D. A. (2000) Generalized born models of macromolecular solvation effects. Annu. Rev. Phys. Chem. 51, 129–152 [DOI] [PubMed] [Google Scholar]
- 28. Tsui V., and Case D. A. (2000) Theory and applications of the generalized Born solvation model in macromolecular simulations. Biopolymers 56, 275–291 [DOI] [PubMed] [Google Scholar]
- 29. Tolbert B. S., Miyazaki Y., Barton S., Kinde B., Starck P., Singh R., Bax A., Case D. A., and Summers M. F. (2010) Major groove width variations in RNA structures determined by NMR and impact of 13C residual chemical shift anisotropy and 1H-13C residual dipolar coupling on refinement. J. Biomol. NMR 47, 205–219 [DOI] [PMC free article] [PubMed] [Google Scholar]
- 30. DeLano W. L. (2002) The PyMOL Molecular Graphics System, Schrödinger, LLC, New York [Google Scholar]
- 31. Chen V. B., Arendall W. B. 3rd, Headd J. J., Keedy D. A., Immormino R. M., Kapral G. J., Murray L. W., Richardson J. S., and Richardson D. C. (2010) MolProbity: all-atom structure validation for macromolecular crystallography. Acta Crystallogr. D Biol. Crystallogr. 66, 12–21 [DOI] [PMC free article] [PubMed] [Google Scholar]
- 32. Konarev P., Volkov V. V., Sokolova A. V., Koch M. H., and Svergun D. I. (2003) PRIMUS: a Windows PC-based system for small-angle scattering data analysis. J Appl. Crystallogr. 36, 1277–1282 [Google Scholar]
- 33. Petoukhov M. V., Franke D., Shkumatov A. V., Tria G., Kikhney A. G., Gajda M., Gorba C., Mertens H. D., Konarev P. V., and Svergun D. I. (2012) New developments in the ATSAS program package for small-angle scattering data analysis. J. Appl. Crystallogr. 45, 342–350 [DOI] [PMC free article] [PubMed] [Google Scholar]
- 34. Semenyuk A., and Svergun D. I. (1991) GNOM-a program package for small-angle scattering data processing. J. Appl. Crystallogr. 24, 537–540 [DOI] [PMC free article] [PubMed] [Google Scholar]
- 35. Franke D., and Svergun D. I. (2009) DAMMIF, a program for rapid ab-initio shape determination in small-angle scattering. J. Appl. Crystallogr. 42, 342–346 [DOI] [PMC free article] [PubMed] [Google Scholar]
- 36. Volkov V., and Svergun D. I. (2003) Uniqueness of ab initio shape determination in small-angle scattering. J. Appl. Crystallogr. 36, 860–864 [DOI] [PMC free article] [PubMed] [Google Scholar]
- 37. Svergun D. I. (1999) Restoring low resolution structure of biological macromolecules from solution scattering using simulated annealing. Biophys. J. 76, 2879–2886; Correction (1999) Biophys. J.77, 2896 [DOI] [PMC free article] [PubMed] [Google Scholar]
- 38. Fang X., Wang J., O'Carroll I. P., Mitchell M., Zuo X., Wang Y., Yu P., Liu Y., Rausch J. W., Dyba M. A., Kjems J., Schwieters C. D., Seifert S., Winans R. E., Watts N. R., Stahl S. J., Wingfield P. T., Byrd R. A., Le Grice S. F., Rein A., and Wang Y. X. (2013) An unusual topological structure of the HIV-1 Rev response element. Cell 155, 594–605 [DOI] [PMC free article] [PubMed] [Google Scholar]
- 39. Wu X., Subramaniam S., Case D. A., Wu K. W., and Brooks B. R. (2013) Targeted conformational search with map-restrained self-guided Langevin dynamics: application to flexible fitting into electron microscopic density maps. J. Struct. Biol. 183, 429–440 [DOI] [PMC free article] [PubMed] [Google Scholar]
- 40. Kozin M., and Svergun DI. (2001) Automated matching of high- and low-resolution structural models. J. Appl. Crystallogr. 34, 33–41 [Google Scholar]
- 41. Svergun D., Barberato C, and Koch MHJ. (1995) CRYSOL—a program to evaluate x-ray solution scattering of biological macromolecules from atomic coordinates. J. Appl. Crystallogr. 28, 768–773 [Google Scholar]
- 42. Fischer W., Apetrei C., Santiago M. L., Li Y., Gautam R., Pandrea I., Shaw G. M., Hahn B. H., Letvin N. L., Nabel G. J., and Korber B. T. (2012) Distinct evolutionary pressures underlie diversity in simian immunodeficiency virus and human immunodeficiency virus lineages. J. Virol. 86, 13217–13231 [DOI] [PMC free article] [PubMed] [Google Scholar]
- 43. Case D. A., Cheatham T. E. 3rd, Darden T., Gohlke H., Luo R., Merz K. M. Jr., Onufriev A., Simmerling C., Wang B., and Woods R. J. (2005) The Amber biomolecular simulation programs. J. Comput. Chem. 26, 1668–1688 [DOI] [PMC free article] [PubMed] [Google Scholar]
- 44. Lu X.-J., and Olson W. K. (2008) 3DNA: a versatile, integrated software system for the analysis, rebuilding and visualization of three-dimensional nucleic-acid structures. Nat. Protoc. 3, 1213–1227 [DOI] [PMC free article] [PubMed] [Google Scholar]
- 45. Varani G., and McClain W. H. (2000) The G x U wobble base pair. A fundamental building block of RNA structure crucial to RNA function in diverse biological systems. EMBO Rep. 1, 18–23 [DOI] [PMC free article] [PubMed] [Google Scholar]
- 46. Mueller N., van Bel N., Berkhout B., and Das A. T. (2014) HIV-1 splicing at the major splice donor site is restricted by RNA structure. Virology 468–470, 609–620 [DOI] [PubMed] [Google Scholar]
- 47. Mueller N., Berkhout B., and Das A. T. (2015) HIV-1 splicing is controlled by local RNA structure and binding of splicing regulatory proteins at the major 5′ splice site. J. Gen. Virol. 96, 1906–1917 [DOI] [PubMed] [Google Scholar]
- 48. Watts J. M., Dang K. K., Gorelick R. J., Leonard C. W., Bess J. W. Jr., Swanstrom R., Burch C. L., and Weeks K. M. (2009) Architecture and secondary structure of an entire HIV-1 RNA genome. Nature 460, 711–716 [DOI] [PMC free article] [PubMed] [Google Scholar]
- 49. Siegfried N. A., Busan S., Rice G. M., Nelson J. A., and Weeks K. M. (2014) RNA motif discovery by SHAPE and mutational profiling (SHAPE-MaP). Nat. Methods 11, 959–965 [DOI] [PMC free article] [PubMed] [Google Scholar]
- 50. Sükösd Z., Andersen E. S., Seemann S. E., Jensen M. K., Hansen M., Gorodkin J., and Kjems J. (2015) Full-length RNA structure prediction of the HIV-1 genome reveals a conserved core domain. Nucleic Acids Res. 43, 10168–10179 [DOI] [PMC free article] [PubMed] [Google Scholar]
- 51. Reuter J. S., and Mathews D. H. (2010) RNAstructure: software for RNA secondary structure prediction and analysis. BMC Bioinformatics 11, 129. [DOI] [PMC free article] [PubMed] [Google Scholar]


