

Abstract
Activation of the farnesoid X receptor (FXR) has indicated a therapeutic potential for this nuclear bile acid receptor in the prevention of diabetic nephropathy and obesity-induced renal damage. Here, we investigated the protective role of FXR against kidney damage induced by obesity in mice that had undergone uninephrectomy, a model resembling the clinical situation of kidney donation by obese individuals. Mice fed a high-fat diet developed the core features of metabolic syndrome, with subsequent renal lipid accumulation and renal injury, including glomerulosclerosis, interstitial fibrosis, and albuminuria. The effects were accentuated by uninephrectomy. In human renal biopsies, staining of 4-hydroxynonenal (4-HNE), glucose-regulated protein 78 (Grp78), and C/EBP-homologous protein, markers of endoplasmic reticulum stress, was more prominent in the proximal tubules of 15 obese patients compared with 16 non-obese patients. In mice treated with the FXR agonist obeticholic acid, renal injury, renal lipid accumulation, apoptosis, and changes in lipid peroxidation were attenuated. Moreover, disturbed mitochondrial function was ameliorated and the mitochondrial respiratory chain recovered following obeticholic acid treatment. Culturing renal proximal tubular cells with free fatty acid and FXR agonists showed that FXR activation protected cells from free fatty acid-induced oxidative stress and endoplasmic reticulum stress, as denoted by a reduction in the level of reactive oxygen species staining and Grp78 immunostaining, respectively. Several genes involved in glutathione metabolism were induced by FXR activation in the remnant kidney, which was consistent with a decreased glutathione disulfide/glutathione ratio. In summary, FXR activation maintains endogenous glutathione homeostasis and protects the kidney in uninephrectomized mice from obesity-induced injury.
Keywords: anion transport, bile acid, endoplasmic reticulum (ER) stress, kidney metabolism, nuclear receptor, oxidative stress, INT-747, fatty liver disease, kidney donor, nonalcoholic steatohepatitis
Introduction
Obesity is an independent risk factor for a rapid decline in renal function in patients with glomerular disease and chronic kidney disease (1–3). Several pathophysiological mechanisms underlie the development of renal injury in obesity (4, 5). Among them, renal lipid accumulation and lipotoxicity reportedly play important roles in the pathogenesis of renal injury, although the precise mechanisms have not yet been fully elucidated (6–8).
Lipotoxicity occurs when excess free fatty acid (FFA)2 accumulates in non-adipose tissues or cells, such as hepatocytes, pancreatic cells, and renal epithelial cells, thereby contributing to the pathogenesis of obesity, diabetes, and related metabolic disorders (9–11). FFA at levels exceeding the renal capacity for oxidation induces reactive oxygen species (ROS), oxidative stress, and ER stress, all of which play crucial roles in mediating renal injury (12–14). ROS are highly reactive molecules that oxidize lipids and proteins, cause cellular injury, and promote glomerular and renal tubular injury and associated proteinuria (15, 16). Thus, modulation of ROS can be beneficial in ameliorating FFA-induced kidney damage (17, 18).
The farnesoid X receptor (FXR) is a nuclear bile acid receptor that plays crucial roles in bile acid, cholesterol, lipid, and glucose metabolism in the liver and intestine. In the liver, FXR activation exerts antifibrotic effects by several mechanisms, including increased apoptosis of hepatic stellate cells (19). FXR activation is also associated with antioxidative effects. Mice fed a high-fat diet (HFD) develop proteinuria and renal lipid accumulation, exhibit increased oxidative stress, and express profibrotic growth factors. Treatment of these mice with the selective and potent FXR agonists obeticholic acid (OCA) and GW4064 decreased triglyceride accumulation by modulating fatty acid synthesis and oxidation, reduced renal injury, and modulated inflammation, oxidative stress, and fibrosis (20–22). However, the mechanisms by which FXR activation reduces oxidative stress are not well understood.
The purpose of this study was to investigate the roles of FXR activation in regulating renal lipid oxidation and in preventing renal injury. We had shown previously that uninephrectomy (UNX) augments the effects of HFD-induced obesity on mouse kidney (23). Consequently, we first examined whether the mechanisms of HFD-induced renal damage, in particular the mechanisms of lipid peroxidation and subsequent oxidative stress, are affected by reduced renal mass. Furthermore, we studied how FXR activation regulates renal lipid metabolism and protects against renal injury by treating mice with OCA, an FXR agonist found previously to be protective against HFD-induced renal injury (21). From a clinical perspective, the increasing prevalence of obesity among kidney donors could impose a risk on the integrity of the remaining kidney (24). The prospect of protecting kidney function in obese kidney donors by pharmacological activation of FXR opens up new therapeutic options for this expanding patient population.
Experimental Procedures
Animal Procedures
Female C57/BJ mice aged 6 weeks were randomly assigned to UNX or sham procedures and were fed with a HFD (D12331, Provimi Kliba, Switzerland) or a chow diet (D12329, Provimi Kliba). For UNX, mice were initially anesthetized with 3–5% isoflurane, intubated orally, and ventilated mechanically. Anesthesia was maintained with 1.5–2% isoflurane delivered in oxygen. The left kidney was surgically removed via a left paramedian incision on the back. The adrenal gland was carefully freed from the upper pole of the renal capsule before the renal pedicle was ligated and the kidney removed. For sham surgery, the same procedure was followed, except that the kidney was manipulated without ablation. After surgery, mice were fed a chow diet for 1 week until recovery, and then the diet intervention started with a chow diet or HFD. After 8 weeks of a HFD, half of the obese mice were given OCA (25 mg/kg mixed into the diet, Intercept Pharmaceuticals) to activate FXR (22). Finally, mice were divided into six groups of six animals: sham-chow, UNX-chow, sham-HFD, UNX-HFD, sham-HFD-OCA, and UNX-HFD-OCA. All mice were killed under anesthesia 17 weeks after surgery, and their kidneys were harvested. Half of the kidney from each animal was snap-frozen in liquid nitrogen and stored at −80 °C for RNA and protein extraction. The other half was fixed with formalin for histological examination.
Measurement of Plasma and Urine Samples
For 24-h urine collection, individual mice were placed in metabolic cages with access to diet. Urinary albumin and creatinine concentrations were measured with the albumin mouse ELISA kit (ab108792, Abcam, Cambridge, UK) and creatinine assay kit (ab65340, Abcam). Urinary H2O2 levels were measured using the Amplex Red H2O2 assay kit (A12214, Invitrogen). Plasma samples were obtained from the tail blood of fasted mice. Plasma cholesterol and triglyceride levels were measured using the Amplex Red cholesterol assay kit (A12216, Invitrogen) and the triglyceride assay kit (ETGA-200, EnzyChrom, Aachen, Germany), respectively.
Assessment of Renal Pathology and Immunostaining
Kidneys were fixed overnight in 10% neutral buffer formalin and embedded in paraffin. Tissue sections were cut at 3 μm and stained with hematoxylin and eosin, periodic acid-Schiff (PAS), and Masson's trichrome stain using standard protocols. The mesangial area was determined from the PAS-stained sections, and the fibrotic area was assessed from the trichrome stained sections. Briefly, digital images of random high-power fields were analyzed by a blind observer. The cross-sectional areas of the glomeruli and the area of fibrosis were determined using Adobe Photoshop. Six mice were analyzed per group. Immunostaining was performed on paraffin sections using a microwave-based antigen retrieval technique. The antibodies used in this study included Grp78 (ab21685, Abcam), CHOP (ab59396, Abcam), LC3b (ab48394, Abcam), 4-HNE (ab46545, Abcam), Cyp4a (sc-98988) and succinate dehydrogenase, subunit A (SDHA, catalog No. 11998, Cell Signaling Technology). Sections were treated with the EnVision+ diaminobenzidine kit (DAB, Dako, Glostrup, Denmark) according to the manufacturer's instruction. TUNEL staining on kidney paraffin sections was performed according to manufacturer's instructions (ApopTag, Millipore, Billerica, MA). Quantitative analyses of sections immunostained for 4-HNE, SDHA, and LC3b were done as described previously (25).
Isolation of Primary Proximal Tubule Cells
Primary proximal tubule cells were isolated from kidneys of C57/BJ mice as described previously (25). Briefly, kidney cortices were dissected, sliced, minced, and digested in 0.25% trypsin solution (Life Technologies BRL) in a shaking incubator at 37 °C for 1 h. Trypsin was neutralized with growth medium (DMEM and 10% FBS containing 100 units/ml penicillin and 0.1 mg/ml streptomycin). The suspension was pipetted and then passed through a 100-μm cell strainer (BD Biosciences). The samples were centrifuged (72.4 × g for 5 min) to pellet the tubules, washed with 10 ml of medium, centrifuged, and washed twice more. The final pellet, consisting mostly of renal tubules, was resuspended in culture medium (renal epithelial basal medium (REBM), BulletKit, Clonetics), plated onto culture dishes (Nalge Nunc International, Naperville, IL), and incubated at 37 °C in a carbon dioxide incubator with medium changed every 2 days until the cells were confluent. Experiments were carried out in serum-free DMEM. After 12 h under starvation conditions in 0.2% FBS/DMEM, cells were incubated by the addition of 100 μm chenodeoxycholic acid (Sigma-Aldrich), 1 μm GW4064 (Sigma-Aldrich), or 1 μm OCA overnight. Of the several types of FFAs, only palmitate acid reportedly showed cytotoxic effects in cultured proximal tubular cells (26, 27). Consequently, we assessed the effects of palmitate acid-bound BSA on oxidative stress and ER stress in primary cultured cells. Cells were starved by incubation in 0.2% FBS/DMEM for 12 h followed by overnight stimulation with 150 μm palmitate acid bound to 8% BSA. Where indicated, cells were pretreated with OCA (1 μm) 1 h before treatment with palmitate acid. Lipid-containing medium was prepared by the conjugation of FFA with FFA-free BSA. Briefly, sodium palmitate was dissolved in 50% ethanol and mixed vigorously with FFA-free BSA in PBS. FFA-free BSA was used as the control.
Cell Staining
After treatment, cells were washed with cold PBS, fixed in 4% paraformaldehyde, and treated with 0.1% Triton X-100 in PBS for 15 min and with 0.1% Tween 20 in 1% BSA/PBS for 30 min. Then, the cells were incubated with primary antibody at 4 °C overnight. The cells were washed and incubated with secondary antibody for 1 h in the dark. After being washed, the cells were stained with ActinRed (R37112, Life Technologies) or ActinGreen (R37110, Life Technologies) probes at room temperature for 30 min and then washed three times. Next, the cells were mounted with DAPI (Vector Laboratories) and visualized under a fluorescent microscope (Leica DMI6000B). Antibodies against Grp78 were purchased from Abcam. For intracellular ROS detection (CellROX deep red, Life Technologies), glutathione detection (ThiolTracker Violet, T10095, Life Technologies), and TUNEL staining (ApopTag, Millipore), cells were processed according to the manufacturer's methods.
Lipid Staining
To examine the accumulation of lipids, frozen kidney sections and primary cultured proximal tubular cells were stained with BODIPY 493/503 (D-3922, Invitrogen). Briefly, for frozen kidney, slides were washed twice with PBS, and for cells, chamber slides with proximal tubule cells were fixed in 4% paraformaldehyde and washed twice with PBS. Slides were then incubated with 1 μg/ml BODIPY 493/503 in 150 mm NaCl for 20 min at room temperature. After incubation, slides were washed twice with PBS, mounted with DAPI, and visualized under a fluorescent microscope (Leica DMI6000B).
Mitochondrial ToxGlo Assay
The mitochondrial ToxGloTM assay was performed according to the manufacturer's protocol (Promega). The assay is based on the sequential measurement of biomarkers associated with changes in cell membrane integrity and cellular ATP levels. Briefly, cells were seeded at 200,000 cells/ml in 96-well plates with serum-free medium. Cells were treated with 150 μm palmitate acid treatment with or without OCA (1 μm) for up to 16 h. First, cell membrane integrity was assessed by measuring fluorescence (485 nmex/520–530 nmem) after a 30-min incubation with a bis-AAF-R110 peptide substrate designed to monitor the presence or absence of a distinct protease activity associated with necrosis. The bis-AAF-R110 peptide substrate is impermeable for intact cell membranes, and no signal is detected with viable cells. Protease activity can be detected only when cells have a compromised membrane. Next, cellular ATP was measured by adding an ATP detection reagent resulting in cell lysis and generation of a luminescent signal proportional to the amount of ATP present. The ATP detection reagent contains luciferin and Ultra-GloTM luciferase and when added to cells reports on the ATP content. ATP is the limiting reagent in the assay.
Isolation of Kidney and Cell RNA and Quantification of Transcript Levels
Total RNA was prepared using Trizol (Invitrogen). The amount of mRNA was determined from the absorbance at 260 nm. After DNase treatment (Promega), 2 μg of total RNA was reverse-transcribed using oligo(dT) priming and Superscript II (Invitrogen). First-strand complementary DNA was used as the template for real-time polymerase chain reaction analysis with TaqMan master mix and primers (Applied Biosystems). Transcript levels, determined in two independent complementary DNA preparations, were calculated and expressed relative to villin as the housekeeping gene.
Microarray and Gene Expression Analysis
RNA was extracted from primary cultured mouse proximal tubule cells using an RNeasy microarray tissue mini kit (73304, Qiagen) followed by on-column DNase digestion to remove any contaminating genomic DNA. RNA samples from four dishes/group were subjected to microarray analysis. Briefly, 100 ng of total RNA was reverse-transcribed into double-stranded cDNA, which was linearly amplified and labeled with Cy3 dye. Following quantification using a NanoDrop spectrophotometer (Witec, Luzern, Switzerland) and quality assessment with an Agilent 2100 bioanalyzer (Agilent Technologies, Santa Clara, CA), 1.6 μg of the obtained Cy3-labeled cRNA was hybridized to mouse GE 4×44K v2 microarrays (Agilent) according to the manufacturer's protocol. Arrays were scanned with an Agilent G2565CA microarray scanner system (Agilent raw intensity data were obtained using Agilent's Feature Extraction software, version 10.7, for array image analysis and the calculation of spot intensities). Data analysis was carried out with R/Bioconductor. The processed intensities were normalized across samples and loaded by using quantile normalization. All microarray data were submitted to the Gene Expression Omnibus (accession number GSE70296). Differential expression was computed using the Limma package. Gene ontology analysis, network analysis, and Kyoto Encyclopedia of Genes and Genomes (KEGG) pathway analysis of the microarray data were completed using the MetaCore online service (Thomson Reuters) and DAVID Bioinformatics Resources (NIAID, National Institutes of Health).
Western Blotting
Lysates (20 μg of protein) from kidney tissue or cells were separated by SDS-PAGE and blotted on polyvinylidene difluoride membranes (Millipore). The membranes were blocked with TBS containing 0.1% Tween 20 and 3% BSA for 1 h at room temperature and incubated overnight at 4 °C with the respective antibodies. Subsequently, the blots were washed with TBS containing 0.1% Tween 20, treated with horseradish peroxidase-conjugated secondary antibodies at room temperature for 1 h, and developed using the ECL Plus detection system (Amersham Biosciences). The antibody against villin was from Chemicon (MAB1639a); anti-Osta (sc-100078) and anti-Shp (sc-30169) were from Santa Cruz Biotechnology (Dallas, TX), anti-caspase 3 (catalog No. 9661) from Cell Signaling (Danvers, MA), and anti-p62 (ab91526) from Abcam.
Patients
Kidney samples were provided by Dr. Lei Chu from the Minimally Invasive Urology Center, Provincial Hospital affiliated to Shandong University. Thirty-one patients with minimal change disease (MCD), as diagnosed by ultrasonography-guided percutaneous biopsy of the kidney, in whom overt proteinuria was above 1.0 g/day, were included. The exclusion criteria were: (a) body mass index > 40 kg/m2; (b) history of type 2 diabetes mellitus; (c) renal, cardiovascular (heart failure, previous myocardial infarction), liver, or thyroid diseases; and (d) use of drugs known to affect the parameters under investigation. Participants had stable body weight (weight change < 5 kg during the last 6 months). Demographic data on both groups, such as gender, age, weight, and height are given in Table 2.
TABLE 2.
Demographic information on patients with minimal change kidney disease
BMI, body mass index. Values represent mean ± S.E., Student's t test, *, p < 0.05.
| Groups | BMI < 25a | 25 ≤ BMI < 40b | p values |
|---|---|---|---|
| Sex (male/female) | 6/10 | 6/9 | 0.315 |
| Age (year) | 55.42 ± 2.641 | 52.25 ± 2.843 | 0.420 |
| Weight (kg) | 65.53 ± 1.667 | 80.87 ± 2.667 | *<0.001 |
| Height (cm) | 171.3 ± 2.275 | 168.9 ± 1.438 | 0.341 |
| BMI (kg/m2) | 22.88 ± 0.40 | 29.04 ± 0.77 | *<0.001 |
a n = 16.
b n = 15.
Statistics
Data are expressed as mean ± S.E. For microarray data, a comparison was assessed by Student's t test with R/Bioconductor to generate differentially expressed genes (control versus GW4064). For other data relating to baseline characteristic analysis and histological analysis, comparisons between groups were assessed by one-way ANOVA followed by Bonferroni's test. Statistical analyses were performed using GraphPad software.
Study Approval
All animal experiments and protocols conformed to the Swiss animal protection laws and were approved by the Cantonal Veterinary Office in Zurich, Switzerland (study number 2012058). The human study was conducted according to the Declaration of Helsinki guidelines regarding ethical principles for medical research involving human subjects. All patients provided written informed consent, and the study protocol was approved by the Scientific Ethical Committee of Shandong University, Jinan, China, where patients were based (license number SDU2015033).
Results
Chronic FXR Activation by OCA Prevents Hyperlipidemia and Steatosis and Improves Renal Function
Because UNX augments the effects of obesity on renal gene expression (23), we investigated the effects of a HFD in both sham-operated and UNX mice. The FXR agonist OCA was added to the HFD to activate FXR. Six groups of mice (n = 6) were investigated: sham-chow, UNX-chow, sham-HFD, UNX-HFD, sham-HFD-OCA, and UNX-HFD-OCA. OCA treatment was initiated after 8 weeks of HFD and was continued for another 8 weeks. As shown in Table 1, HFD intervention in both sham and UNX mice resulted in increased body weight and hyperlipidemia. Changes in plasma triglyceride and FFA were attenuated in both sham and UNX obese mice treated with OCA. However, OCA treatment for 8 weeks in obese mice did not significantly reduce their body weight (Table 1).
TABLE 1.
Characteristics of the mice in the six groups after treatment
TG, triglyceride; Cho, cholesterol. n = 6 mice/group; data are expressed as the mean ± S.E., one-way ANOVA with Bonferroni's test.
| Sham |
UNX |
|||||
|---|---|---|---|---|---|---|
| Sham-Chow | Sham-HFD | Sham-HFD-OCA | UNX-Chow | UNX-HFD | UNX-HFD-OCA | |
| Body weight (g) | 22.00 ± 0.58 | 28.80 ± 2.13a | 27.67 ± 1.50a | 21.33 ± 0.42 | 31.00 ± 2.12a | 27.50 ± 1.29a |
| Kidney weight (mg) | 140.0 ± 6.8 | 143.3 ± 4.2 | 143.3 ± 8.0 | 191.7 ± 9.5 | 201.7 ± 12.7 | 186.7 ± 10.5 |
| Plasma TG (mg/dl) | 131.7 ± 2.2 | 146.4 ± 3.6a | 129.1 ± 3.9b | 140.5 ± 2.9 | 153.5 ± 3.2a | 133.2 ± 4.3b |
| Plasma Cho (mg/dl) | 62.9 ± 5.3 | 79.3 ± 4.0a | 77.5 ± 1.5a | 66.3 ± 4.6 | 83.1 ± 4.2a | 76.5 ± 4.3 |
| Plasma FFA (mmol/liter) | 1.095 ± 0.084 | 1.422 ± 0.165a | 0.667 ± 0.059b | 1.004 ± 0.047 | 1.415 ± 0.126a | 0.667 ± 0.052b |
a p < 0.05, comparison between chow diet and HFD.
b p < 0.05, comparison between HFD and HFD-OCA.
Because OCA treatment decreased plasma triglyceride and FFA levels in obese mice, the effect on liver steatosis was studied. HFD induced hepatic steatosis in obese mice as expected (Fig. 1, B and E), but steatosis was decreased by OCA treatment (Fig. 1, C and F). We also investigated whether FXR activation affected obesity-induced progressive kidney dysfunction. HFD induced a significant elevation of albuminuria and urinary H2O2 excretion, but these markers were decreased by ∼50% in OCA-treated mice (Fig. 2).
FIGURE 1.

FXR activation ameliorates the development of liver steatosis. A–F, representative H&E staining of liver sections from sham-chow (A and D), sham-HFD (B and E), and sham-HFD-OCA mice (C and F). D–F, higher magnification of selected boxed areas from images A–C, respectively. n = 6/group.
FIGURE 2.

Albuminuria and urinary H2O2 output in the six treatment groups. A, the urine albumin/creatinine (Al/Cr) ratio increased at 16 weeks in both sham-HFD and UNX-HFD mice, and this increase was attenuated by OCA treatment. n = 6 mice/group. B, the urine H2O2/creatinine ratio increased at 16 weeks in both sham-HFD and UNX-HFD mice, and this increase was attenuated by OCA treatment. n = 6 mice/group. Data are shown as mean ± S.E. One-way ANOVA with Bonferroni's test. *, p < 0.05.
FXR Activation by OCA Reduces Glomerulosclerosis and Tubulointerstitial Injury in Obese Mice
Both sham-HFD and UNX-HFD mice developed significant increases in PAS-positive hypertrophy of glomeruli, mesangial matrix, and tubulointerstitial fibrosis at week 16 (Fig. 3, A and C). UNX-HFD mice had the highest levels of glomerulosclerosis and interstitial fibrosis (Fig. 3, Ae, and Ce). Obese mice from both sham and UNX groups treated with OCA showed notable improvements, with reduced tubulointerstitial fibrosis and less mesangial matrix (Fig. 3, A, c and f, and C, c and f). Quantitative analyses with scores for glomerulosclerosis and interstitial fibrosis indicated that the reduction in glomerular damage and tubulointerstitial fibrosis was significant in both the sham-HFD-OCA and UNX-HFD-OCA groups compared with the HFD groups (Fig. 3, B and D).
FIGURE 3.

Effects of FXR activation on glomerular and tubulointerstitial injury. Representative images of Masson's trichrome-stained (A) and PAS-stained (C) sections of kidney tissue from the six treatment groups. n = 6 mice/group. B and D, bars represent the quantitative analysis of the area of fibrosis (B) and the mesangial area (D). n = 6 mice/group. Data are expressed as mean ± S.E. One-way ANOVA with Bonferroni's test. *, p < 0.05.
Improved Renal Function Is Associated with Reduced Lipid Accumulation and Reduced ROS
We next analyzed lipid accumulation and oxidation in the kidney because these are considered major causes of obesity-induced renal damage (28). BODIPY 493/593 was used to stain neutral lipids. Both sham-operated and UNX obese mice possessed significantly increased numbers of lipid droplets in kidney compared with chow-fed mice (Fig. 4A, b and e). UNX-HFD mice had higher levels of positive lipid staining than sham-HFD mice. OCA treatment decreased lipid accumulation in the kidney (Fig. 4, A, c and f, and B), consistent with decreased plasma triglyceride and FFA levels (Table 1). Thus, the reduction in kidney injury and lipid accumulation observed in OCA-treated mice (Figs. 3 and 4A) matched the improvement in kidney function (Fig. 2), indicating a correlation between improved renal function and reduced lipid accumulation. Although the initial events involved in lipid-mediated renal damage are unclear, lipid oxidation and subsequent oxidative stress play an important role (11). Mice fed a HFD showed increased levels of 4-HNE (Fig. 4C, b and e), an aldehydic product of lipid peroxidation and a biomarker for oxidative stress. UNX-HFD mice showed the highest level of oxidative stress (Fig. 4Ce), and the degree of positive staining for 4-HNE was reduced in OCA-treated obese mice (Fig. 4C, c and f). Quantitative analysis of positive 4-HNE staining confirmed a 4-fold increase in 4-HNE staining in UNX-HFD compared with sham-chow mice, which was reduced ∼50% by OCA treatment.
FIGURE 4.

Effects of FXR activation on lipid accumulation and oxidation in kidneys of mice from the six treatment groups. A, representative images of BODIPY staining on renal sections from the different treatment groups. n = 6 mice/group. B, quantitative analysis of the number of lipid droplets and positive staining of 4-HNE per high power field. n = 6 mice/group. Data are expressed as mean ± S.E. One-way ANOVA with Bonferroni's test. *, p < 0.05. C and D, representative images of immunostaining for 4-HNE (C) and Cyp4a (D). n = 6 mice/group. E, quantification of mRNA levels of genes associated with fatty acid synthesis (Srebf1c and Srebf2), β-oxidation (Acox1 and Cpt1), and ω-oxidation (Ppara and Cyp4a14). n = 4–6 mice/group. Data are expressed as mean ± S.E. One-way ANOVA with Bonferroni's test. *, p < 0.05.
Because FXR activation by OCA almost completely resolved obesity-induced kidney damage, we examined whether FXR activation affected expression of genes involved in fatty acid synthesis and oxidation. In line with previous studies (21, 29), HFD showed a tendency to increase expression of Srebf1c and Srebf2, which regulate fatty acid synthesis and cholesterol synthesis separately. However, activation of FXR did not result in significant changes in either Srebf1c or Srebf2 (Fig. 4E), indicating that decreased renal lipid content in OCA-treated mice was not caused by modulation of fatty acid synthesis. However, we found that FXR activation increased renal expression of acyl-CoA oxidase 1 (Acox1), carnitine palmitoyltransferase 1a (Cpt1a), peroxisome proliferator-activated receptor α (Ppara), and cytochrome P450 4a14 (Cyp4a14) mRNAs (Fig. 4E), all of which are important for fatty acid oxidation and lipid catabolism. These findings were consistent with previous studies (21, 27). Cyp4a14 is a downstream gene regulated by PPARα, and Cyp4a14 is a key enzyme involved in FFA ω-oxidation in the ER. Fig. 4D illustrates representative immunostaining of Cyp4a14 in kidney tissues from different groups. Cyp4a14 levels in proximal tubular epithelial cells were low in the chow-fed group. Expression in mice fed a HFD was greatly increased, and OCA treatment further induced the expression of Cyp4a14 (Fig. 4D, c and f), consistent with the observed increase in mRNA levels. Thus, treatment with OCA stimulates renal fatty acid oxidation and renal lipolysis, thereby resulting in reduced kidney lipid accumulation in obese mice.
Lipid oxidation, especially fatty acid oxidation, occurs mostly in mitochondria. To evaluate renal mitochondrial function, we measured the expression of succinate dehydrogenase, a key enzyme involved in the mitochondrial respiratory chain, in kidney sections (Fig. 5A). By immunostaining for SDHA, both sham and UNX mice fed a HFD showed decreased levels of renal SDHA staining (Fig. 5A, b and e). However, SDHA expression was partially recovered in OCA-treated mice on a HFD (Fig. 5, A, c and f, and C), indicating that FXR activation improved mitochondrial function and induced the mitochondrial respiratory chain. Autophagosomes and autophagic flux normally regulate the mitochondrial life cycle, whereas disturbed autophagosome formation impedes the removal of damaged mitochondria, resulting in mitochondrial dysfunction (30). Immunostaining of mouse kidney sections for Lc-3b, a marker for autophagy (Fig. 5B), showed that autophagosomes were localized mainly on the glomerular basement, where the podocytes reside (Fig. 5B, a, inset). Lower levels of Lc-3b staining were found as obesity-induced nephropathy progressed (Fig. 5B, b and e), confirming previous findings (31, 32). However, FXR activation attenuated the decrease in the number of autophagosomes in both sham-operated and UNX obese mice (Fig. 5, B, c and f, and D). Immunoblotting results for p62, another autophagosome marker, confirmed that OCA treatment attenuated the decrease of autophagosomes in obese mice (Fig. 6D). This finding indicates that FXR activation promotes intracellular organelle recovery mechanisms and probably helps to maintain the mitochondrial life cycle, consistent with the SDHA staining shown in Fig. 5A. Thus, FXR activation maintains effective mitochondrial FFA oxidation in kidney tissue of obese mice.
FIGURE 5.

Effects of FXR activation on the mitochondrial respiratory chain and the mitochondrial life cycle in kidneys of mice from the six treatment groups. A and B, representative images of immunostaining for SDHA (A), a marker of the mitochondrial respiratory chain, and Lc-3b (B), a marker of autophagy, on renal sections of mice from the six treatment groups. n = 6 mice/group. C and D, quantitative analysis of the positive staining of SDHA (C) and LC3b (D) per high power field. n = 6 mice/group.
FIGURE 6.

Effects of FXR activation on the markers of ER stress in kidneys of mice from the six treatment groups. A–C, representative images of immunostaining for Grp78 (A) and CHOP (B) and of TUNEL staining (C). Arrows indicate apoptotic bodies. n = 6 mice/group. D, Western blot analysis of Grp78, caspase-3, and p62 protein levels in kidney samples of sham-chow, UNX-HFD, and UNX-HFD-OCA mice.
FXR Activation by OCA Contributes to Lower Levels of ER Stress and Reduced Apoptosis
Because obesity has been shown to cause ER stress in liver and adipose tissue (33), we studied the expression of ER stress proteins in kidney tissue. Staining for the ER markers Grp78 and CHOP (Fig. 6, A and B) showed higher ER stress in both obese sham-operated and UNX mice. In contrast, limited ER stress was observed in the OCA-treated groups (Fig. 6, A, c and f, and B, c and f), indicating that FXR activation ameliorated HFD-induced ER stress. The increased expression of Grp78 at the protein level in UNX-HFD mice was also confirmed by immunoblotting (Fig. 6D).
To translate these findings into the clinical situation, we measured markers of lipid peroxidation and ER stress in renal biopsy specimens from 16 non-obese and 15 obese human subjects with minimal change disease (overt proteinuria > 1 g/day) in the kidney (patient data are shown in Table 2). The proximal tubules from non-obese patients showed little positive staining for 4-HNE, GRP78, or CHOP, whereas all three stained more prominently in kidney biopsies from obese patients (representative examples are shown in Fig. 7, B, D, and F). These findings support the concept that ER stress in kidney is important in the progression of obesity-induced kidney damage in human.
FIGURE 7.
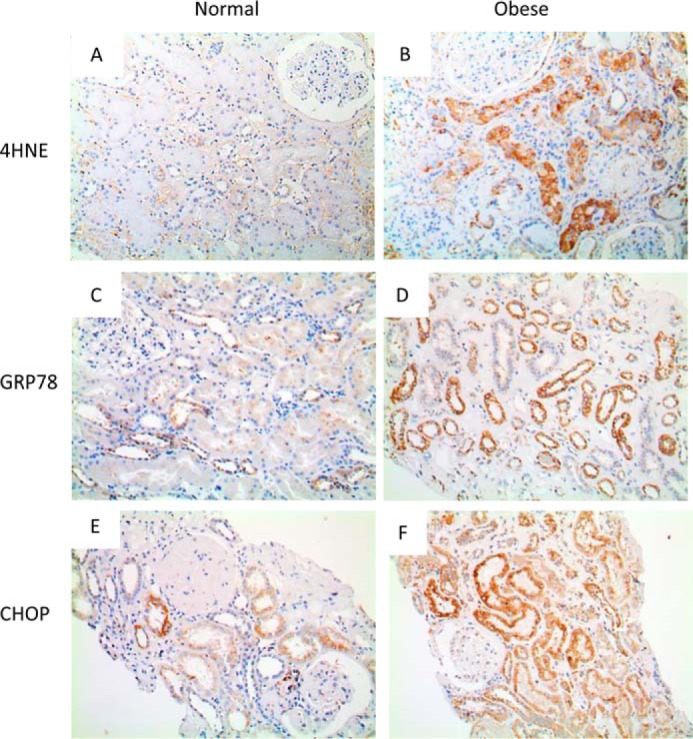
Markers of lipid peroxidation and ER stress in renal biopsy specimens from non-obese and obese human subjects with minimal change disease of the kidney. Shown are representative images of immunostaining for 4-HNE (A and B), GRP78 (C and D), and CHOP (E and F) in kidney specimens obtained from non-obese (body mass index < 21 kg/m2 (A, C, and E) and obese (body mass index > 25kg/m2 (B, D, and F) patients with overt proteinuria (>1.0 g/day).
Apoptosis is a common sequel of chronic ER stress, and accordingly, TUNEL staining showed increased apoptosis in the kidneys of obese mice, with the highest level in UNX-HFD mice (Fig. 6C, b and e). FXR attenuated HFD-induced apoptosis in obese mice. The levels of caspase-3 were increased in the kidney of UNX-HFD mice and decreased in OCA-treated mice as shown in in immunoblots (Fig. 6D). Taken together, the evidence indicates that FXR activation improved ER dynamics and protected kidney proximal tubular cells from ER stress-induced apoptosis.
FXR Activation Protects Kidney Proximal Tubular Cells by Inducing Glutathione Metabolism
To better assess the role of FXR in reducing oxidative stress and ER stress, we cultured primary proximal tubular cells from mouse kidney and exposed the cells to FFA and/or FXR agonists. OCA treatment successfully activated FXR, as demonstrated by increased expression of Shp, Osta, and Ostb (Fig. 8, A and B), all of which are downstream genes directly regulated by FXR. Similar results were also obtained from proximal tubular cells treated with chenodeoxycholic acid and GW4064, other known FXR agonists, as positive controls (data not shown). As shown in Fig. 8D, exposure of cells to FFA resulted in lipid accumulation, oxidative stress, and ER stress as denoted by significantly higher levels of BODIPY staining, ROS staining, and Grp78 immunostaining, respectively (Fig. 8D, b, e, and h). Grp78 protein levels were also increased in immunoblots (Fig. 8C). It is noteworthy that the activation of FXR in proximal tubular cells resulted in significantly reduced lipid accumulation, oxidative stress, and ER stress in response to FFA (Fig. 8D, c, f, and i). Moreover, apoptosis was blocked when cells were incubated with FFA and exposed to OCA, as indicated by TUNEL staining (Fig. 8Di), consistent with membrane integrity analysis (Fig. 8F).
FIGURE 8.

Effect of FXR activation on lipid accumulation, fatty acid oxidation, and oxidative stress in primary cultured proximal tubular cells (PTCs) exposed to palmitate acid (PA). A and B, representative Western blot images (A) and mRNA analysis (B) of FXR downstream genes in PTCs after OCA treatment demonstrate that OCA successfully activates FXR in PTCs. n = 4/group. Data are presented as mean ± S.E. *, p < 0.05 (Student's t test) compared with control group. C, representative Western blot images of Grp78 in cell lysates from PTCs treated with vehicle (FFA-free BSA) and at 24 h after exposure to palmitate acid (150 μm) with or without OCA (1 μm) treatment. n = 4/group. D, representative staining of PTCs from different treatment groups for lipid droplets (BODIPY staining in a–c), ROS (CellROX staining in d–f), Grp78 (g–i), and apoptosis (TUNEL staining in j, l, and m). Color of staining corresponds to the label on the left side of each panel. Cells were counterstained with DAPI (blue) and/or ActinRed (red). n = 4/group. E, quantification of mRNA levels of genes associated with fatty acid synthesis (Fasn and Srebf2) and oxidation (Acox1, Cpt1, Ppara, and Cyp4a14) from different treatment groups. Cont, control; GW, GW4064. n = 4/group. Data are expressed as the mean ± S.E. One-way ANOVA with Bonferroni's test. *, p < 0.05. F, quantitative analysis of membrane integrity (cytotoxicity) and ATP content from PTCs treated with vehicle (FFA-free BSA) and at 24 h after exposure to palmitate acid (150 μm) with or without OCA (1 μm) treatment. n = 4/group.
The expression of genes involved in FFA synthesis and oxidation was also investigated in primary cultured proximal tubular cells exposed to FFA (Fig. 8E). FXR activation by GW4064 or OCA increased expression of Ppara, Cpt1a, and Cyp4a14, consistent with the mRNA levels in kidney tissue of OCA-treated HFD mice (Fig. 4E). Furthermore, mitochondrial function was assessed by mitochondrial ATP generation (Fig. 8F). After a 16-h treatment with FFA, cells showed a decreased ATP content as a measure of mitochondrial function in these cells. However, cells co-treated with OCA and FFA showed a significant increase of ATP levels compared with the FFA treatment group. Taken together, these results indicate that FXR activation protects renal proximal tubular cells by reducing oxidative stress and ER stress, improving mitochondrial function, and stimulating fatty acid oxidation.
The apparently opposing effects of FXR in inducing fatty acid oxidation while at the same time reducing oxidative stress were further investigated by microarray analysis of renal proximal tubular cells exposed either to GW4064 or dimethyl sulfoxide (as a control). By using a 1.7-fold change as the cut-off point, expression of 357 genes was significantly increased by FXR activation, and expression of 193 genes was significantly decreased (Fig. 9A and supplemental Table S1). Interestingly, a KEGG pathway analysis indicated that several pathways linked to fatty acid metabolism and oxidation reduction were induced by FXR activation (Fig. 9B and Table 3). Among these pathways, genes involved in glutathione metabolism were induced most prominently (Fig. 9B). Furthermore, by comparing publicly available chromatin immunoprecipitation-deep sequencing (ChIP-seq) data (34) with our microarray data, we found that many of the genes induced in mouse liver in vivo were also induced in mouse proximal tubular cells (e.g. genes involved in glutathione metabolism, fatty acid degradation, and oxidation reduction), indicating a universal role of FXR in reducing oxidative stress (a list of the common genes in both data sets is given in Table 4). To confirm this finding, we investigated glutathione metabolism and the expression of glutathione-metabolizing genes in proximal tubular cells treated with FXR agonists. Co-treatment of cells with FFA and FXR agonists resulted in significantly increased intracellular glutathione levels; induced mRNA expression of Gclm, Gpx1, and Gsr; and a decreased glutathione disulfide/glutathione (GSSG/GSH) ratio (Fig. 10, A and B). Consequently, the mechanism by which FXR activation protects cells from ROS appears to be mediated by enhanced glutathione metabolism and maintenance of the GSSG/GSH ratio. Moreover, the expression levels of Gclm and Gsr in the kidney cortex of OCA-treated obese mice were also increased (Fig. 10C). Consistent with these results, we also found a decreased GSSG/GSH ratio in the kidney of OCA-treated obese mice (Fig. 10C).
FIGURE 9.
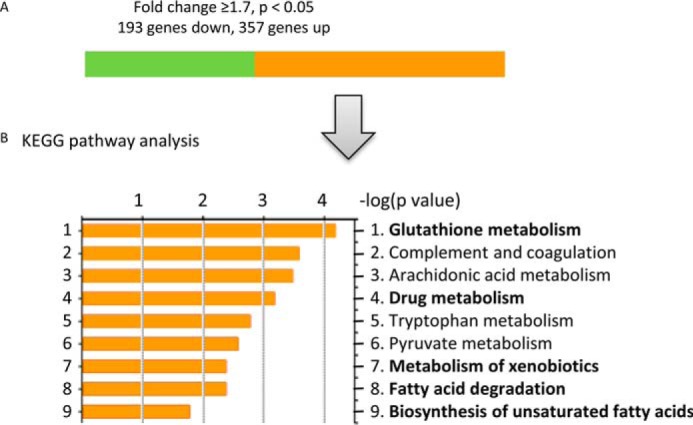
Effect of FXR activation on gene expression profile in proximal tubular cells. A, summary of genes differentially expressed in proximal tubular cells treated with GW4064 for 24 h compared with vehicle control (dimethyl sulfoxide). n = 4/group. The cutoff point was a 1.7-fold change, p < 0.05. Of the 550 genes significantly differentially expressed after GW4064 treatment, the expression of 357 genes increased (orange bar), and that of 193 genes decreased (green bar). B, KEGG pathway analysis of genes with an increase in expression of ≥1.7-fold. Bold words indicate gene pathways involved in the reduction of oxidative stress.
TABLE 3.
Selected differentially expressed genes in GW4064-treated versus untreated proximal tubular cells grouped according to function
Numbers in parentheses indicate gene expression levels quantified as Log2 of fold changes.
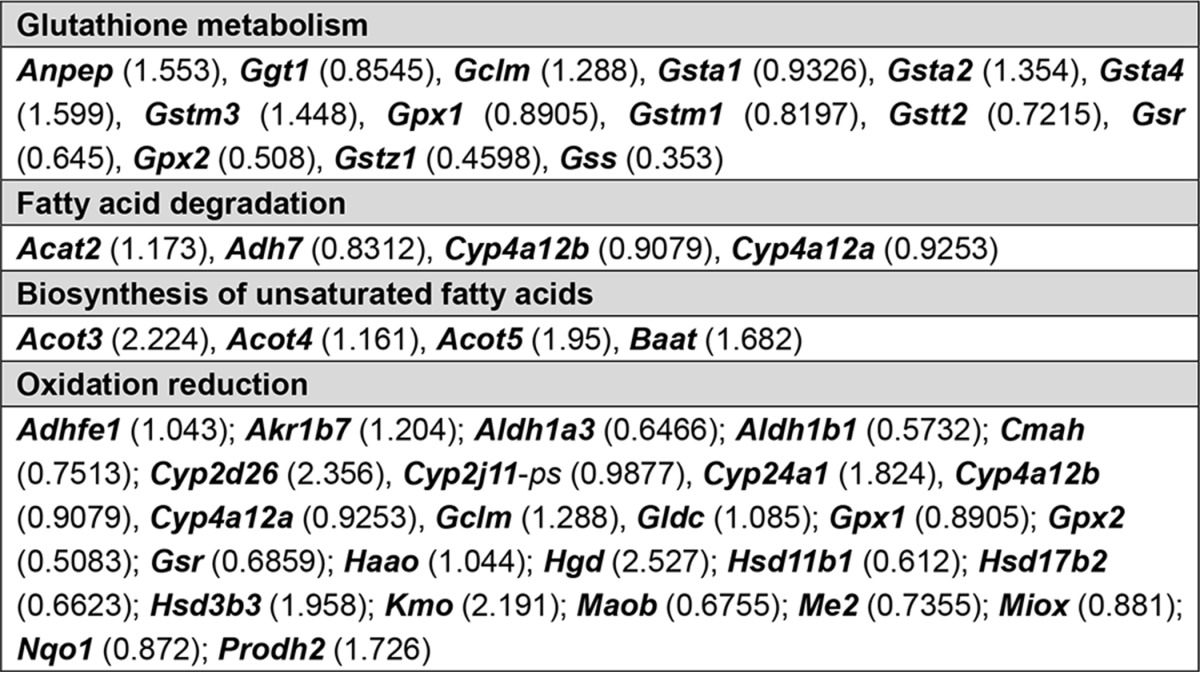
TABLE 4.
KEGG analysis
This is a comparison of genes identified in the public ChIP-seq data set (mLiver-GW from GSE57305) with the PTCs-GW data set (PTCs-GW from GSE70296) according to selected categories in DAVID annotation. Genes identified under both “PTCs-GW” and “mLiver-GW” are bolded. GW, GW4064.
| Category | mLiver-GWa | PTCs-GW |
|---|---|---|
| Drug metabolism | CYP2D9, CYP3A25, CYP2A12, FMO5, GSTM3, UGT1A7C, ADH4, GSTK1, FMO3, GSTZ1, UGT1A2, GSTA2, GSTA4, GPX2, CYP3A13, CYP3A11, GSTT1, GSTT2, CYP2E1, UGT1A1, UGT1A10, AOX1, CYP2D26, CYP2C38, CYP2C39, MGST1, GSTA3 | Adh7, Cyp2d26, Gsta1, Gsta2, Gsta4, Gstm3, Gstm1, Ggt1, Gstt2, Gstz1, Gpx1, Gpx2 |
| Complement and coagulation cascades | KNG1, MBL1, KNG2, HC, C3, C4B, CFB, SERPINA1E, PLG, PROC, SERPINF2, CFH, C2, CFD, FGG, FGA, FGB, F2, SERPINE1, SERPINC1, CPB2 | C3, C4b, Fga, Serpina1e, Serpina1d, Serpina1c, Serpina1a, Serpinf2 |
| Metabolism of xenobiotics by cytochrome P450 | GSTA2, GSTA3, GSTA4, CYP3A25, CYP3A13, CYP3A11, GSTT1, GSTT2, CYP2E1, UGT1A1, DHDH, UGT1A10, GSTM3, UGT1A7C, GSTK1, ADH4, GSTZ1, UGT1A2, CYP2C38, CYP2C39, MGST1 | Adh7, Gsta1, Gsta2, Gsta4, Gstm3, Gstm1, Gstt2, Gstz1 |
| Pyruvate metabolic process | RBP4, GPD1, PCX, G6PC, SDS, PDK4, CAR5A, DLAT, AGXT, PCK1 | Acat2, Acot12, Akr1b7, Me3, Pcx |
| Fatty acid metabolic process | PTGES3, ACOX2, PRKAG3, HACL1, PPARA, PPARD, SC5D, PRKAG2, STAT5B, ACOT5, ACOT4, ACOT3, PECR, APOA2, ACSL1, ELOVL5, FASN, ACOT12, ELOVL6, ACAA1B, ACSL5, SCD1, CPT1B, ACADM, ALDH5A1, EPHX2, ADIPOR2, LYPLA2, PHYH, ADIPOQ, CPT1A, BRCA1, QK, PTGDS, MAPK14, LIPC, AACS, SLC27A2, CROT, SLC27A4, DEGS1 | Acat2, Adh7, Cyp4a12b, Cyp4a12a, Acot3, Acot4, Acot5, Baat; Acaa1a; Acnat1; Acot1; Acot12; Acox2; Acsm1; Akr1b7; Aoah; Apob48r; Apoe, Cubn; Cyp24a1; Enpp6; Hnf4a; Mogat2; Pcx; Pla1a; Pla2g12b; Pnpla3; Soat2; Sult1a1, Prkag2; Slc27a3; Slc37a4 |
| Oxidation reduction | CYP2D9, ACOX2, CYP2J5, STEAP3, LDHA, SC5D, ALDH1L1, PRDX5, PDHB, GPX2, RDH9, PECR, CYP7A1, CPOX, SRD5A1, DHTKD1, DUS1L, SARDH, GFOD1, DHCR24, HPD, SQRDL, ACADM, CYP3A13, ALDH5A1, CYP3A11, CYCS, DECR2, QDPR, CYP26A1, RDH1, CYP2E1, GRHPR, CDO1, POR, DHDH, CYP27A1, H6PD, SLC37A2, CYP2D26, TXNRD2, DEGS1, CYP2U1, XDH, CYP3A25, NDUFB6, HSD17B2, HSD17B1, HSD17B13, AASS, MOSC2, EGLN2, Kmo, PAH, ALDH3A2, PIPOX, CYP2A12, FMO5, ADH4, FMO3, HAAO, FASN, BDH1, BCKDHA, SCD1, CYP2G1, GPD1, CHDH, CYP21A1, HGD, PHYH, AKR1B7, CYP17A1, SLC25A13, LEPRE1, UOX, NDUFV1, CYP4F15, AOX1, PRODH2, CP, CYP2C38, CYP4A14, ACAD10, ALKBH2, CYP2C39 | Haao, Egln3, Adh7, Fa2h, Gclm, Gpx1, Gldc, Hgd, Hsd3b2, Hsd3b3, Me3, Miox, Hsd3b4, Acad10, Acox2; Adhfe1; Akr1b7; Aldh1a3; Cat; Cmah, Cyp2d26, Cyp2j11-ps, Cyp24a1, Cyp24a1; Cyp2c29; Cyp2c44; Cyp2j13; Cyp2j9; Cyp4a12b, Cyp4a12a; Dcxr; Dhcr24; Dus1l; Dus2l; Gldc; Gpd1; Gsr; Hsd11b1; Hsd17b2; Hsd3b3; Kmo; Maoa; Maob; Nqo1; Prodh2; Qdpr; Qsox1; Sardh; Sdr42e1; Slc37a4, Sord; Steap3; Xdh |
| Glycerophospholipid metabolism | CHPT1, GPD1, PEMT, PLA2G6, AGPAT2, AGPAT1, CRLS1, NAT6, PPAP2C, CHKB, LYPLA2, LCAT, PHOSPHO1 | Agpat2; Etnk1; Pemt; Pi4k2a; Pla2g5 |
FIGURE 10.

FXR activation enhances glutathione metabolism. A, representative images of glutathione detected in PTCs from different treatment groups. Violet, glutathione; green, counterstaining for ActinGreen. B, quantification of GSSG and mRNA levels of genes associated with glutathione metabolism (Gclm, Gpx1, and Gsr) from PTCs undergoing different treatments. Cont, control; GW, GW4064; PA, palmitate acid. C, quantification of GSSG and mRNA levels of genes associated with glutathione metabolism (Gclm, Gpx1, and Gsr) in mouse kidney from different treatment groups. B and C, n = 4/group. Data are expressed as mean ± S.E. One-way ANOVA with Bonferroni's test. *, p < 0.05.
Discussion
The present study shows that FXR activation in the proximal tubules of obese mice protects the kidney from FFA-induced renal damage, consistent with previous data showing that FXR activation protects renal proximal tubules against obesity-induced kidney damage and diabetic nephropathy (21, 23, 35). In the context of uninephrectomy, which accentuates the untoward effects of obesity on kidney function, the beneficial effects of the FXR agonist OCA are novel. Sham-operated obese mice developed modest renal injury, characterized by reduced renal function, mesangial expansion, tubular injury, interstitial fibrosis, oxidative stress, and ER stress. UNX-HFD mice had a higher degree of renal injury despite similar body weights. Both sham-operated and UNX obese mice treated with OCA were largely protected from renal disease and had preserved kidney function with a lower degree of albuminuria and fewer histological changes compared with obese mice not treated with OCA. FXR activation also inhibited lipid accumulation and FFA-induced apoptosis in the kidney. Furthermore, FXR activation suppressed FFA-induced oxidative stress by accelerating antioxidant glutathione metabolism and promoting FFA oxidation in tubular epithelial cells. Consistent with these mouse data, the immunostaining of human renal biopsy samples also showed higher levels of lipid peroxidation, oxidative stress, and ER stress in obese patients. Thus, FXR activation could represent a novel protective strategy against obesity-induced kidney disease, notably in the context of uninephrectomy.
In recent decades, the progression of obesity-induced kidney damage to chronic kidney disease has been a critical focus of research in nephrology. Several reports have suggested that renal lipid accumulation and lipotoxicity are associated with the development of renal injury (6, 7, 36). We and others have previously reported that feeding a HFD to mice induces renal lipid accumulation and kidney injury (23, 28, 37). In the present study, we found increased renal ROS levels and increased oxidative stress in the kidneys of obese mice. ROS are induced in obesity as a consequence of fatty acid oxidation, and higher FFA exposure increases fatty acid oxidation and ROS generation, placing a burden on mitochondria and the ER, where fatty acid oxidation takes place (38). Failure to remove excessive ROS results in defective FFA oxidation, oxidative stress, and ER stress, as shown schematically in Fig. 11A. FXR activation can protect the kidney by reducing ROS levels and alleviating subsequent oxidative stress and ER stress. FXR activation accelerates glutathione metabolism, which in turn removes excessive ROS and promotes fatty acid oxidation, providing a plausible mechanism of action (Fig. 11B).
FIGURE 11.

Scheme showing how FXR activation promotes glutathione metabolism and reduces FFA-induced oxidative stress. FFA oxidation generates ROS, which are highly reactive molecules that oxidize lipids and proteins and cause cellular injury. ROS are scavenged effectively by the thioredoxin reductase/thioredoxin/peroxiredoxin system. GSH serves as an electron donor to reduce ROS and forms GSSG, mediated by glutathione peroxidase (Gpx). At the same time, GSH can be regenerated from GSSG by glutathione reductase (Gsr), which keeps a balanced GSH homeostasis. A, FFA overload causes increased fatty acid oxidation and internal generation of excessive ROS. Higher ROS levels place a heavy burden on mitochondria and the ER, where fatty acid oxidation takes place, and disturbs mitochondrial function and the mitochondrial life cycle. Failure to remove excessive ROS results in defective fatty acid oxidation, oxidative stress, and ER stress. B, in proximal tubular cells, activation of FXR accelerates glutathione homeostasis by inducing GSH metabolic genes, thereby removing excessive ROS and reducing oxidative stress. This, in turn, promotes the mitochondrial life cycle, restores mitochondrial and ER function, and prevents cell apoptosis.
In this study, altered lipid metabolism was associated with defective mitochondrial function and fatty acid oxidation. In the kidney of obese mice, the levels of Acox1 and Cpt1a, markers of fatty acid oxidation, were not altered, in line with previous studies (39). However, FXR activation induced Acox1 and Cpt1a expression in obese mice. Moreover, FXR activation induced mitochondrial function (as shown in Fig. 5A by SDHA staining, a marker of the mitochondrial respiratory chain) and promoted the mitochondrial life cycle (Fig. 5B, as shown by induction of the mitochondrial autophagy marker Lc-3b), indicating that defective fatty acid β-oxidation occurred in the mitochondria of obese mice. Recent studies in a diabetic mouse model and in human patients found defective fatty acid oxidation in renal tubular cells (40–43), consistent with our results. In contrast, we found increased levels of Cyp4a14, the enzyme responsible for fatty acid ω-oxidation in the ER, and a marked increase of ER stress in the proximal tubules of obese mice. This increased FFA ω-oxidation in the ER may explain the significant increase of H2O2 levels detected in the urine of obese mice. Being the most important organelle involved in protein synthesis, folding, and maturation, the ER takes over fatty acid ω-oxidation when β-oxidation is defective in mitochondria (44, 45). High glucose and FFA levels have been shown to induce ER stress in podocytes as well as in proximal tubule cells and to subsequently induce apoptosis (46, 47). Indeed, ER stress can induce autophagy participating in the degradation of unfolded proteins and in the repair of damaged mitochondria (48). Exposure to continuous higher levels of energy and nutrients may activate signals inhibiting autophagic and ER stress responses. Failure to complete autophagy creates a vicious cycle, resulting in apoptosis. Consequently, we believe that the ER plays a vital role in regulating proximal tubular function. However, studies on the effect of ER stress on kidney function in kidney disease are limited, and several aspects concerning the signaling pathways that link fatty acid oxidation to ER stress are still unresolved.
There is growing evidence for the role of dysregulated lipid metabolism in the pathogenesis of renal disease. A hypernutrient state, as in a HFD model, causes a higher level of lipid oxidation, thereby suppressing intracellular nutrient-sensing signals (39, 43) and stress resistance mechanisms (49, 50). Although FXR has been shown to exert a hepatoprotective effect against various hepatic stress conditions (51), few studies have assessed FXR activation in obesity-induced kidney damage. FXR activation has been reported to correct metabolic derangement and improve glucose tolerance and insulin sensitivity, all of which can protect the kidney from diabetic nephropathy (21, 35). In our study, OCA-treated obese mice showed modest attenuation of HFD-induced hyperlipidemia and lipid accumulation. These changes may be explained partially by improved FFA metabolism, with chronic FXR activation inducing significant expression of genes involved in fatty acid β-oxidation (Acox1 and Cpt1a) and ω-oxidation (Ppara and Cyp4a14). Previous data have shown that diabetic FXR KO mice fed a regular chow diet exhibit increased proteinuria, mesangial expansion, and fibrosis (35), suggesting that FXR is important in maintaining kidney function. By exposing primary cultured mouse kidney proximal tubular cells to FFA and/or FXR agonists (GW4064 and OCA), we found that FXR activation reduces ROS and subsequent oxidative stress and ER stress. This inhibitory effect of FXR on ROS was further investigated by microarray analysis, which showed that several key pathways involved in oxidation reduction were significantly induced by FXR activation, including genes associated with glutathione metabolism, arachidonic acid metabolism, fatty acid degradation, and biosynthesis of unsaturated fatty acids (Fig. 9). Furthermore, by using publicly available ChIP-seq data (34), we found that activated FXR can bind directly to the intronic areas of Gpx2, Gclc, Gsta, and Gstm in mouse liver (Table 4), indicating a universal role of FXR in regulating glutathione metabolism. Mammalian cells possess several protective mechanisms against damage caused by ROS, with GSH/GSSG homeostasis playing an important role (52). Gclm, Gpx, and Gsr are the key enzymes involved in maintaining glutathione metabolism, which has antioxidant, antiapoptotic, and anti-inflammatory effects (52). Defective fatty acid oxidation and glutathione depletion occur not only in the kidney but also in other tissues, indicating the central role of GSH homeostasis (38, 51). In our study, FXR activation induced the expression of genes involved in GSH metabolism and GSH/GSSG homeostasis, thereby counteracting FFA-induced ROS (Fig. 10). Taken together, these findings indicate that FXR activation induces antioxidant genes and GSH/GSSG metabolism, both of which block FFA-induced oxidative stress and promote mitochondrial and ER function by removing toxic ROS.
Based on the histological changes in tubules and glomeruli and the higher levels of oxidative and ER stress observed in both obese mice and humans, therapeutic strategies that target ROS should delay or reverse kidney disease progression in obese patients with reduced renal mass (24, 53). Our results indicate that FXR activation not only ameliorates tubular injury but also improves renal function by inducing the expression of antioxidant genes. These results suggest FXR as a potential target for future therapeutic approaches in obese patients with reduced renal mass secondary to kidney donation and possibly other forms of kidney impairment.
In conclusion, this study shows that lipid accumulation occurs in the kidney after exposure to a HFD, leading to increased ROS levels and associated glomerulosclerosis and tubulointerstitial fibrosis. These effects are accentuated by uninephrectomy. The bile acid receptor FXR exerts beneficial effects, because FXR activation reduces glomerular matrix expansion and interstitial fibrosis, lowers plasma FFA levels, and decreases lipid accumulation in the remaining kidney of UNX mice. Moreover, FXR activation prevents FFA-induced oxidative stress and ER stress by promoting antioxidant pathways and regulating glutathione metabolism, providing a likely explanation for the beneficial effects observed.
Author Contributions
Z. G. conducted experiments, acquired data, analyzed data, and wrote the manuscript. T. G. performed microarray and analyzed microarray data. C. H. conducted experiments and analyzed data. G. K.-U. designed research studies, acquired funding, analyzed data, and wrote the manuscript.
Supplementary Material
Acknowledgment
We thank Dr. Luciano Adorini for critical reading of the manuscript.
This study was supported by Grant 320030-144193 from the Swiss National Science Foundation (to G. K.-U.), a grant from the Swiss National Center for Competence in Research NCCR (Kidney.ch), and Grant 246539 from the International Fellowship Program on Integrative Kidney Physiology and Pathophysiology (IKPP). The authors declare that they have no conflicts of interest with the contents of this article.

This article contains supplemental Table S1.
- FFA
- free fatty acid
- FXR
- farnesoid X receptor
- OCA
- obeticholic acid
- ROS
- reactive oxygen species
- ER
- endoplasmic reticulum
- HFD
- high-fat diet
- Grp78
- glucose-regulated protein 78
- 4-HNE
- 4-hydroxynonenal
- CHOP
- C/EBP-homologous protein
- PAS
- periodic acid-Schiff
- SDHA
- succinate dehydrogenase, subunit A
- ANOVA
- analysis of variance
- PTC
- proximal tubular cell
- KEGG
- Kyoto Encyclopedia of Genes and Genomes
- UNX
- uninephrectomy.
References
- 1. Wang Y., Chen X., Song Y., Caballero B., and Cheskin L. J. (2008) Association between obesity and kidney disease: a systematic review and meta-analysis. Kidney Int. 73, 19–33 [DOI] [PubMed] [Google Scholar]
- 2. Kambham N., Markowitz G. S., Valeri A. M., Lin J., and D'Agati V. D. (2001) Obesity-related glomerulopathy: an emerging epidemic. Kidney Int. 59, 1498–1509 [DOI] [PubMed] [Google Scholar]
- 3. de Vries A. P., Ruggenenti P., Ruan X. Z., Praga M., Cruzado J. M., Bajema I. M., D'Agati V. D., Lamb H. J., Pongrac Barlovic D., Hojs R., Abbate M., Rodriquez R., Mogensen C. E., Porrini E., and ERA-EDTA Working Group Diabesity (2014) Fatty kidney: emerging role of ectopic lipid in obesity-related renal disease. Lancet Diabetes Endocrinol. 2, 417–426 [DOI] [PubMed] [Google Scholar]
- 4. Abrass C. K. (2004) Overview: obesity: what does it have to do with kidney disease? J. Am. Soc. Nephrol. 15, 2768–2772 [DOI] [PubMed] [Google Scholar]
- 5. Bagby S. P. (2004) Obesity-initiated metabolic syndrome and the kidney: a recipe for chronic kidney disease? J. Am. Soc. Nephrol. 15, 2775–2791 [DOI] [PubMed] [Google Scholar]
- 6. Gin H., Rigalleau V., and Aparicio M. (2000) Lipids, protein intake, and diabetic nephropathy. Diabetes Metab. 26, Suppl. 4, 45–53 [PubMed] [Google Scholar]
- 7. Bonnet F., and Cooper M. E. (2000) Potential influence of lipids in diabetic nephropathy: insights from experimental data and clinical studies. Diabetes Metab. 26, 254–264 [PubMed] [Google Scholar]
- 8. Wang Z., Jiang T., Li J., Proctor G., McManaman J. L., Lucia S., Chua S., and Levi M. (2005) Regulation of renal lipid metabolism, lipid accumulation, and glomerulosclerosis in FVBdb/db mice with type 2 diabetes. Diabetes 54, 2328–2335 [DOI] [PubMed] [Google Scholar]
- 9. Brookheart R. T., Michel C. I., and Schaffer J. E. (2009) As a matter of fat. Cell Metab. 10, 9–12 [DOI] [PMC free article] [PubMed] [Google Scholar]
- 10. Neuschwander-Tetri B. A. (2010) Hepatic lipotoxicity and the pathogenesis of nonalcoholic steatohepatitis: the central role of nontriglyceride fatty acid metabolites. Hepatology 52, 774–788 [DOI] [PubMed] [Google Scholar]
- 11. Weinberg J. M. (2006) Lipotoxicity. Kidney Int. 70, 1560–1566 [DOI] [PubMed] [Google Scholar]
- 12. Jaimes E. A., Hua P., Tian R. X., and Raij L. (2010) Human glomerular endothelium: interplay among glucose, free fatty acids, angiotensin II, and oxidative stress. Am. J. Physiol. Renal. Physiol. 298, F125–F132 [DOI] [PMC free article] [PubMed] [Google Scholar]
- 13. Fujii H., Kono K., Nakai K., Goto S., Komaba H., Hamada Y., Shinohara M., Kitazawa R., Kitazawa S., and Fukagawa M. (2010) Oxidative and nitrosative stress and progression of diabetic nephropathy in type 2 diabetes. Am. J. Nephrol. 31, 342–352 [DOI] [PubMed] [Google Scholar]
- 14. Oberg B. P., McMenamin E., Lucas F. L., McMonagle E., Morrow J., Ikizler T. A., and Himmelfarb J. (2004) Increased prevalence of oxidant stress and inflammation in patients with moderate to severe chronic kidney disease. Kidney Int. 65, 1009–1016 [DOI] [PubMed] [Google Scholar]
- 15. Habibi J., Hayden M. R., Sowers J. R., Pulakat L., Tilmon R. D., Manrique C., Lastra G., Demarco V. G., and Whaley-Connell A. (2011) Nebivolol attenuates redox-sensitive glomerular and tubular mediated proteinuria in obese rats. Endocrinology 152, 659–668 [DOI] [PMC free article] [PubMed] [Google Scholar]
- 16. Tang J., Yan H., and Zhuang S. (2012) Inflammation and oxidative stress in obesity-related glomerulopathy. Int. J. Nephrol. 2012, 608397. [DOI] [PMC free article] [PubMed] [Google Scholar]
- 17. Cho E. J., Yoon J. H., Kwak M. S., Jang E. S., Lee J. H., Yu S. J., Kim Y. J., Kim C. Y., and Lee H. S. (2014) Tauroursodeoxycholic acid attenuates progression of steatohepatitis in mice fed a methionine-choline-deficient diet. Dig. Dis. Sci. 59, 1461–1474 [DOI] [PubMed] [Google Scholar]
- 18. Hu Z., Ren L., Wang C., Liu B., and Song G. (2012) Effect of chenodeoxycholic acid on fibrosis, inflammation and oxidative stress in kidney in high-fructose-fed Wistar rats. Kidney Blood Press. Res. 36, 85–97 [DOI] [PubMed] [Google Scholar]
- 19. Fiorucci S., Rizzo G., Antonelli E., Renga B., Mencarelli A., Riccardi L., Orlandi S., Pruzanski M., Morelli A., and Pellicciari R. (2005) A farnesoid X receptor-small heterodimer partner regulatory cascade modulates tissue metalloproteinase inhibitor-1 and matrix metalloprotease expression in hepatic stellate cells and promotes resolution of liver fibrosis. J. Pharmacol. Exp. Ther. 314, 584–595 [DOI] [PubMed] [Google Scholar]
- 20. Jiang T., Wang X. X., Scherzer P., Wilson P., Tallman J., Takahashi H., Li J., Iwahashi M., Sutherland E., Arend L., and Levi M. (2007) Farnesoid X receptor modulates renal lipid metabolism, fibrosis, and diabetic nephropathy. Diabetes 56, 2485–2493 [DOI] [PubMed] [Google Scholar]
- 21. Wang X. X., Jiang T., Shen Y., Adorini L., Pruzanski M., Gonzalez F. J., Scherzer P., Lewis L., Miyazaki-Anzai S., and Levi M. (2009) The farnesoid X receptor modulates renal lipid metabolism and diet-induced renal inflammation, fibrosis, and proteinuria. Am. J. Physiol. Renal. Physiol. 297, F1587–F1596 [DOI] [PMC free article] [PubMed] [Google Scholar]
- 22. Pellicciari R., Fiorucci S., Camaioni E., Clerici C., Costantino G., Maloney P. R., Morelli A., Parks D. J., and Willson T. M. (2002) 6alpha-ethyl-chenodeoxycholic acid (6-ECDCA), a potent and selective FXR agonist endowed with anticholestatic activity. J. Med. Chem. 45, 3569–3572 [DOI] [PubMed] [Google Scholar]
- 23. Gai Z., Hiller C., Chin S. H., Hofstetter L., Stieger B., Konrad D., and Kullak-Ublick G. A. (2014) Uninephrectomy augments the effects of high fat diet induced obesity on gene expression in mouse kidney. Biochim. Biophys. Acta 1842, 1870–1878 [DOI] [PubMed] [Google Scholar]
- 24. González E., Gutiérrez E., Morales E., Hernández E., Andres A., Bello I., Díaz-González R., Leiva O., and Praga M. (2005) Factors influencing the progression of renal damage in patients with unilateral renal agenesis and remnant kidney. Kidney Int. 68, 263–270 [DOI] [PubMed] [Google Scholar]
- 25. Gai Z., Zhou G., Gui T., Itoh S., Oikawa K., Uetani K., and Muragaki Y. (2010) Trps1 haploinsufficiency promotes renal fibrosis by increasing Arkadia expression. J. Am. Soc. Nephrol. 21, 1468–1476 [DOI] [PMC free article] [PubMed] [Google Scholar]
- 26. Soumura M., Kume S., Isshiki K., Takeda N., Araki S., Tanaka Y., Sugimoto T., Chin-Kanasaki M., Nishio Y., Haneda M., Koya D., Kashiwagi A., Maegawa H., and Uzu T. (2010) Oleate and eicosapentaenoic acid attenuate palmitate-induced inflammation and apoptosis in renal proximal tubular cell. Biochem. Biophys. Res. Commun. 402, 265–271 [DOI] [PubMed] [Google Scholar]
- 27. Tanaka Y., Kume S., Araki S., Isshiki K., Chin-Kanasaki M., Sakaguchi M., Sugimoto T., Koya D., Haneda M., Kashiwagi A., Maegawa H., and Uzu T. (2011) Fenofibrate, a PPARα agonist, has renoprotective effects in mice by enhancing renal lipolysis. Kidney Int. 79, 871–882 [DOI] [PubMed] [Google Scholar]
- 28. Kume S., Uzu T., Araki S., Sugimoto T., Isshiki K., Chin-Kanasaki M., Sakaguchi M., Kubota N., Terauchi Y., Kadowaki T., Haneda M., Kashiwagi A., and Koya D. (2007) Role of altered renal lipid metabolism in the development of renal injury induced by a high-fat diet. J. Am. Soc. Nephrol. 18, 2715–2723 [DOI] [PubMed] [Google Scholar]
- 29. Miyazaki-Anzai S., Levi M., Kratzer A., Ting T. C., Lewis L. B., and Miyazaki M. (2010) Farnesoid X receptor activation prevents the development of vascular calcification in ApoE−/− mice with chronic kidney disease. Circ. Res. 106, 1807–1817 [DOI] [PMC free article] [PubMed] [Google Scholar]
- 30. Ozcan U., Yilmaz E., Ozcan L., Furuhashi M., Vaillancourt E., Smith R. O., Görgün C. Z., and Hotamisligil G. S. (2006) Chemical chaperones reduce ER stress and restore glucose homeostasis in a mouse model of type 2 diabetes. Science 313, 1137–1140 [DOI] [PMC free article] [PubMed] [Google Scholar]
- 31. Fang L., Zhou Y., Cao H., Wen P., Jiang L., He W., Dai C., and Yang J. (2013) Autophagy attenuates diabetic glomerular damage through protection of hyperglycemia-induced podocyte injury. PloS One 8, e60546. [DOI] [PMC free article] [PubMed] [Google Scholar]
- 32. Yamahara K., Kume S., Koya D., Tanaka Y., Morita Y., Chin-Kanasaki M., Araki H., Isshiki K., Araki S., Haneda M., Matsusaka T., Kashiwagi A., Maegawa H., and Uzu T. (2013) Obesity-mediated autophagy insufficiency exacerbates proteinuria-induced tubulointerstitial lesions. J. Am. Soc. Nephrol. 24, 1769–1781 [DOI] [PMC free article] [PubMed] [Google Scholar]
- 33. Ozcan U., Cao Q., Yilmaz E., Lee A. H., Iwakoshi N. N., Ozdelen E., Tuncman G., Görgün C., Glimcher L. H., and Hotamisligil G. S. (2004) Endoplasmic reticulum stress links obesity, insulin action, and type 2 diabetes. Science 306, 457–461 [DOI] [PubMed] [Google Scholar]
- 34. Zhan L., Liu H. X., Fang Y., Kong B., He Y., Zhong X. B., Fang J., Wan Y. J., and Guo G. L.. Genome-wide binding and transcriptome analysis of human farnesoid X receptor in primary human hepatocytes. PloS One 9, e105930. [DOI] [PMC free article] [PubMed] [Google Scholar]
- 35. Wang X. X., Jiang T., Shen Y., Caldas Y., Miyazaki-Anzai S., Santamaria H., Urbanek C., Solis N., Scherzer P., Lewis L., Gonzalez F. J., Adorini L., Pruzanski M., Kopp J. B., Verlander J. W., and Levi M. (2010) Diabetic nephropathy is accelerated by farnesoid X receptor deficiency and inhibited by farnesoid X receptor activation in a type 1 diabetes model. Diabetes 59, 2916–2927 [DOI] [PMC free article] [PubMed] [Google Scholar]
- 36. Sun L., Halaihel N., Zhang W., Rogers T., and Levi M. (2002) Role of sterol regulatory element-binding protein 1 in regulation of renal lipid metabolism and glomerulosclerosis in diabetes mellitus. J. Biol. Chem. 277, 18919–18927 [DOI] [PubMed] [Google Scholar]
- 37. Deji N., Kume S., Araki S., Soumura M., Sugimoto T., Isshiki K., Chin-Kanasaki M., Sakaguchi M., Koya D., Haneda M., Kashiwagi A., and Uzu T. (2009) Structural and functional changes in the kidneys of high-fat diet-induced obese mice. Am. J. Physiol. Renal. Physiol. 296, F118–F126 [DOI] [PubMed] [Google Scholar]
- 38. Halliwell B. (1991) Reactive oxygen species in living systems: source, biochemistry, and role in human disease. Am. J. Med. 91, 14S–22S [DOI] [PubMed] [Google Scholar]
- 39. Declèves A. E., Zolkipli Z., Satriano J., Wang L., Nakayama T., Rogac M., Le T. P., Nortier J. L., Farquhar M. G., Naviaux R. K., and Sharma K. (2014) Regulation of lipid accumulation by AMP-activated kinase [corrected] in high fat diet-induced kidney injury. Kidney Int. 85, 611–623 [DOI] [PMC free article] [PubMed] [Google Scholar]
- 40. Che R., Yuan Y., Huang S., and Zhang A. (2014) Mitochondrial dysfunction in the pathophysiology of renal diseases. Am. J. Physiol. Renal. Physiol. 306, F367–F378 [DOI] [PubMed] [Google Scholar]
- 41. Sharma K., Karl B., Mathew A. V., Gangoiti J. A., Wassel C. L., Saito R., Pu M., Sharma S., You Y. H., Wang L., Diamond-Stanic M., Lindenmeyer M. T., Forsblom C., Wu W., Ix J. H., Ideker T., Kopp J. B., Nigam S. K., Cohen C. D., Groop P. H., Barshop B. A., Natarajan L., Nyhan W. L., and Naviaux R. K. (2013) Metabolomics reveals signature of mitochondrial dysfunction in diabetic kidney disease. J. Am. Soc. Nephrol. 24, 1901–1912 [DOI] [PMC free article] [PubMed] [Google Scholar]
- 42. Kang H. M., Ahn S. H., Choi P., Ko Y. A., Han S. H., Chinga F., Park A. S., Tao J., Sharma K., Pullman J., Bottinger E. P., Goldberg I. J., and Susztak K. (2015) Defective fatty acid oxidation in renal tubular epithelial cells has a key role in kidney fibrosis development. Nat. Med. 21, 37–46 [DOI] [PMC free article] [PubMed] [Google Scholar]
- 43. Dugan L. L., You Y. H., Ali S. S., Diamond-Stanic M., Miyamoto S., DeCleves A. E., Andreyev A., Quach T., Ly S., Shekhtman G., Nguyen W., Chepetan A., Le T. P., Wang L., Xu M., Paik K. P., Fogo A., Viollet B., Murphy A., Brosius F., Naviaux R. K., and Sharma K. (2013) AMPK dysregulation promotes diabetes-related reduction of superoxide and mitochondrial function. J. Clin. Invest. 123, 4888–4899 [DOI] [PMC free article] [PubMed] [Google Scholar]
- 44. Buchberger A., Bukau B., and Sommer T. (2010) Protein quality control in the cytosol and the endoplasmic reticulum: brothers in arms. Mol. Cell 40, 238–252 [DOI] [PubMed] [Google Scholar]
- 45. Nelson D. and Cox M. (2005) Lehninger Principles of Biochemistry, 4th Ed., pp. 647–650, W. H. Freeman and Co., New York [Google Scholar]
- 46. Sieber J., Lindenmeyer M. T., Kampe K., Campbell K. N., Cohen C. D., Hopfer H., Mundel P., and Jehle A. W. (2010) Regulation of podocyte survival and endoplasmic reticulum stress by fatty acids. Am. J. Physiol. Renal. Physiol. 299, F821–F829 [DOI] [PMC free article] [PubMed] [Google Scholar]
- 47. Cao Y., Hao Y., Li H., Liu Q., Gao F., Liu W., and Duan H. (2014) Role of endoplasmic reticulum stress in apoptosis of differentiated mouse podocytes induced by high glucose. Int. J. Mol. Med. 33, 809–816 [DOI] [PMC free article] [PubMed] [Google Scholar]
- 48. Bernales S., Schuck S., and Walter P. (2007) ER-phagy: selective autophagy of the endoplasmic reticulum. Autophagy 3, 285–287 [DOI] [PubMed] [Google Scholar]
- 49. Choi B. H., Kang K. S., and Kwak M. K. (2014) Effect of redox modulating NRF2 activators on chronic kidney disease. Molecules 19, 12727–12759 [DOI] [PMC free article] [PubMed] [Google Scholar]
- 50. Tan S. M., Sharma A., Stefanovic N., Yuen D. Y., Karagiannis T. C., Meyer C., Ward K. W., Cooper M. E., and de Haan J. B. (2014) Derivative of bardoxolone methyl, dh404, in an inverse dose-dependent manner lessens diabetes-associated atherosclerosis and improves diabetic kidney disease. Diabetes 63, 3091–3103 [DOI] [PubMed] [Google Scholar]
- 51. Cipriani S., Mencarelli A., Palladino G., and Fiorucci S. (2010) FXR activation reverses insulin resistance and lipid abnormalities and protects against liver steatosis in Zucker (fa/fa) obese rats. J. Lipid Res. 51, 771–784 [DOI] [PMC free article] [PubMed] [Google Scholar]
- 52. Dröse S., and Brandt U. (2012) Molecular mechanisms of superoxide production by the mitochondrial respiratory chain. Adv. Exp. Med. Biol. 748, 145–169 [DOI] [PubMed] [Google Scholar]
- 53. Praga M., and Morales E. (2006) Obesity, proteinuria and progression of renal failure. Curr. Opin. Nephrol. Hypertens. 15, 481–486 [DOI] [PubMed] [Google Scholar]
Associated Data
This section collects any data citations, data availability statements, or supplementary materials included in this article.