Abstract
Acid ceramidase (AC) is a lysosomal cysteine amidase that controls sphingolipid signaling by lowering the levels of ceramides and concomitantly increasing those of sphingosine and its bioactive metabolite, sphingosine 1-phosphate. In the present study, we evaluated the role of AC-regulated sphingolipid signaling in melanoma. We found that AC expression is markedly elevated in normal human melanocytes and proliferative melanoma cell lines, compared with other skin cells (keratinocytes and fibroblasts) and non-melanoma cancer cells. High AC expression was also observed in biopsies from human subjects with Stage II melanoma. Immunofluorescence studies revealed that the subcellular localization of AC differs between melanocytes (where it is found in both cytosol and nucleus) and melanoma cells (where it is primarily localized to cytosol). In addition to having high AC levels, melanoma cells generate lower amounts of ceramides than normal melanocytes do. This down-regulation in ceramide production appears to result from suppression of the de novo biosynthesis pathway. To test whether AC might contribute to melanoma cell proliferation, we blocked AC activity using a new potent (IC50 = 12 nm) and stable inhibitor. AC inhibition increased cellular ceramide levels, decreased sphingosine 1-phosphate levels, and acted synergistically with several, albeit not all, antitumoral agents. The results suggest that AC-controlled sphingolipid metabolism may play an important role in the control of melanoma proliferation.
Keywords: cancer biology, ceramide, enzyme inhibitor, melanoma, sphingolipid, acid ceramidase
Introduction
Ceramides are a class of bioactive lipids that regulate senescence, apoptosis, and autophagy (1). They comprise more than 200 chemically and functionally distinct molecules and are produced through either de novo biosynthesis or cleavage of preformed sphingolipid precursors in membranes (2–4). They are degraded by the action of five distinct ceramidases, which differ in sequence, structure, subcellular localization, and preferred substrates (5). Among them, acid ceramidase (AC)2 (also known as N-acetylsphingosine amidohydrolase, ASAH1) is especially relevant due to its possible roles in cancer progression and chemoresistance (6).
AC is a lysosomal cysteine amidase that catalyzes the hydrolysis of ceramide into sphingosine and fatty acid with a preference for unsaturated ceramides with 6–16-carbon acyl chains (5). Its activation is associated with decreased cellular levels of these medium-chain ceramides, which promote senescence and apoptosis, and increased levels of sphingosine 1-phosphate (S1P), which stimulates cell proliferation and cancer cell migration (7). A bioinformatic survey of the National Cancer Institute (NCI) gene expression database conducted in 2003 identified AC as a potential candidate for the development of new biomarkers for the prognosis of melanoma (8). Supporting this possibility, subsequent studies showed that serum of melanoma patients contains AC autoantibodies (9). Moreover, experiments with melanoma cell lines in cultures have demonstrated that dacarbazine, a standard of care for the treatment in melanoma patients, causes a time- and concentration-dependent decrease in cellular AC levels (10). These data point to a link between AC and melanoma, but the precise nature of such a link remains unknown.
In the present study, we used a combination of lipidomics, molecular, and pharmacological approaches to investigate the role of AC in normal human melanocytes and melanoma cell lines. We find that both normal melanocytes and proliferative melanoma cells express high levels of AC but with different intracellular localizations. We also show that ceramide production is suppressed in melanoma cells, compared with normal melanocytes, due to down-regulated expression of key enzymes of the de novo ceramide biosynthesis. Finally, we report that AC inhibition with a newly discovered stable inhibitor of this enzyme elevates ceramide levels and enhances the cytotoxic effects of chemotherapeutic drugs on proliferative melanoma cells in cultures.
Experimental Procedures
Chemicals
Commercially available reagents and solvents were used as purchased without further purification. Dry solvents (pyridine, CH2Cl2) were from Sigma-Aldrich. Cisplatin, tamoxifen, taxol, 5-fluorouracil, and dacarbazine were purchased from Sigma-Aldrich. Vemurafenib was purchased from Clinisciences.
Synthesis and Characterization of ARN14988
Automated column chromatography was performed using a Teledyne ISCO apparatus (CombiFlash Rf) with prepacked silica gel columns of different sizes (from 4 to 40 g). Mixtures of increasing polarity of cyclohexane and ethyl acetate (EtOAc) were used as eluents. NMR experiments were run on a Bruker Avance III 400 system (400.13 MHz for 1H and 100.62 MHz for 13C) equipped with a BBI probe and z-gradients. Spectra were acquired at 300 K, using deuterated dimethyl sulfoxide (DMSO-d6) and deuterated chloroform (CDCl3) as solvents. Splitting parameters are designated as singlet (s), broad singlet (bs), doublet (d), triplet (t), and multiplet (m). NMR coupling constants (J) are in hertz. UPLC/MS analyses were run on a Waters ACQUITY UPLC/MS system consisting of a single quadrupole detector mass spectrometer equipped with an electrospray ionization interface and a photodiode array detector. Photodiode array range was 210–400 nm. Analyses were performed on an ACQUITY UPLC HSS T3 C18 column (50 mm × 2.1-mm inner diameter, particle size 1.8 μm) with a VanGuard HSS T3 C18 precolumn (5 mm × 2.1-mm inner diameter, particle size 1.8 μm). Mobile phase was either 10 mm NH4OAc in H2O at pH 5 adjusted with AcOH (A) or 10 mm NH4OAc in MeCN-H2O (95:5) at pH 5 (B). Electrospray ionization in positive and negative modes was applied. All final compounds showed ≥95% purity by nuclear magnetic resonance and liquid chromatography/mass spectrometry (LC/MS) analyses.
ARN14988 was prepared following a two-step synthesis involving the coupling between commercial 5-chlorouracil and hexylisocyanate (Step 1), followed by N3-acylation of the resulting N1-carboxamide derivative (Step 2).
Step 1
5-Chlorouracil (0.500 g, 3.41 mmol, 1.0 eq) was dissolved in dry pyridine (17 ml, 0.2 m). DMAP (0.460 g, 3.75 mmol, 1.1 eq) was added, and the reaction mixture was stirred under nitrogen atmosphere at room temperature for 30 min. Hexylisocyanate (0.750 ml, 5.12 mmol, 1.5 eq) was then added, and the resulting mixture was stirred for 12 h. The solvent was evaporated under reduced pressure, and the crude was purified by silica gel column chromatography (cyclohexane/EtOAc, 55:45) to afford 5-chloro-N-hexyl-2,4-dioxo-pyrimidine-1-carboxamide (0.511 g, 55%) as a white powder. 1H NMR (400 MHz, DMSO-d6) δ 0.86 (t, J = 6.8 Hz, 3H), 1.21–1.25 (m, 6H), 1.46–1.54 (m, 2H), 3.24–3.29 (m, 2H), 8.41 (s, 1H), 9.07 (t, J = 5.3 Hz, 1H). 13C NMR (101 MHz, DMSO-d6) δ 13.85, 21.97, 25.81, 28.57, 30.82, 40.55, 109.55, 135.56, 149.21, 150.61, 158.78. MS (ESI) m/z: 272 [M − H]−.
Step 2
5-Chloro-N-hexyl-2,4-dioxopyrimidine-1-carboxamide (0.511 g, 1.87 mmol, 1.0 eq) was dissolved in dry pyridine (9 ml, 0.2 m). To the resulting solution, isobutyl chloroformate (0.365 ml, 2.80 mmol, 1.5 eq) was added, and the reaction was stirred at room temperature under nitrogen for 12 h. The solvent was removed under reduced pressure, and the crude was purified by silica gel column chromatography (cyclohexane/EtOAc, 60:40) to afford compound ARN14988 (0.120 g, 17%) as a white powder. 1H NMR (400 MHz, CDCl3) δ 0.89 (t, J = 6.7 Hz, 3H), 1.01 (d, J = 6.7 Hz, 6H), 1.25–1.39 (m, 6H), 1.49–1.69 (m, 2H), 2.03–2.22 (m, 1H), 3.25–3.57 (m, 2H), 4.26 (d, J = 6.62 Hz, 2H), 8.62 (s, 1H), 8.73–8.90 (m, 1H). 13C NMR (101 MHz, CDCl3) δ 14.11, 18.89, 22.63, 26.58, 27.81, 29.18, 31.47, 41.77, 76.76, 111.13, 135.14, 148.40, 148.58, 149.19, 156.05. MS (ESI) m/z: 391 [M + NH4]+.
Analytical Stability
Analytical stability in DMSO or mouse plasma was evaluated as described (11).
Cell Cultures
H1299, HCT116, MDA-MB-231, MCF7, PC3, LNCaP, A2780, M14, HepG2, and RXF393 cells were a gift from Dr. Gennaro Colella (Mario Negri Institute, Milan, Italy). MNT-1 and SK-MEL-28 cells were provided by Dr. Anand Ganesan. MeWo, A431, G361, A375, HT29, and MM127 cells were purchased from Sigma-Aldrich. SW403, CaCo2, CCF-STT-G1, HEK293, HT144, and RPMI7951 were from the American Type Culture Collection (Manassas, VA). All cells were cultured at 37 °C and 5% CO2 in Dulbecco's modified Eagle's medium (DMEM) containing 10% fetal bovine serum, 2 mm l-glutamine, and antibiotics. Human epidermal melanocytes, adult, lightly pigmented donor (HEMa-LP), were purchased from Life Technologies (Monza, Italy) and cultured in Medium 254 supplemented with PMA-free Human Melanocyte Growth Supplement-2. Neonatal normal human epidermal keratinocytes were from Lonza Sales Ltd. (Basel, Switzerland) and cultured in KGM-Gold medium with supplements as suggested by the vendor. Primary LAMA human fibroblasts were a kind gift of Dr. Michele Lai (University of Pisa). All experiments with HEMa-LP, neonatal normal human epidermal keratinocytes, and LAMA fibroblasts were performed with cells at passages 3–5. HEK293 cells stably expressing human AC (HEK293-hAC) were used as positive control in every experiment. hAC cDNA was purchased from Open Biosystems (clone ID 3923451) and subcloned in the mammalian expression vector pCDNA3.1, containing the neomycin resistance gene. HEK293 cells were transfected with hAC-pCDNA3.1 construct using JetPEI reagent (Polyplus Transfection, Illkirch-Graffenstaden, France) following the manufacturer's instructions. A stable cell line was generated by selection with G418 (1 mg/ml), and cell clones were derived by limited dilution plating.
AC Assay in HEK293-hAC Lysosomal Extract
Lysosomal extracts (10 μg) of HEK293 cells overexpressing human AC were used for IC50 determinations. AC enzymatic activity was measured with an LC/MS-based assay as described previously (11, 12).
AC Assay in Total Lysate
Cells (106) were suspended in TENTN buffer (10 mm Tris-HCl, pH 7.4, 150 mm sodium chloride, 1% Triton X-100, 0.25% Nonidet P-40, 2 mm EDTA, protease inhibitors), subjected to sonication, and centrifuged at 800 × g for 15 min at 4 °C. Supernatants were used as total lysates. Lysates (50–100 μg of protein) were incubated in AC buffer (100 mm sodium phosphate, 0.1% Nonidet P-40, 150 mm NaCl, 3 mm DTT, 100 mm sodium citrate, pH 4.5) with 50 μm N-lauroyl ceramide (Nu-Chek Prep, Elysian, MN) as substrate, reactions were carried on for 1 h at 37 °C, and the reaction product was extracted as described (11, 12). Blank samples without protein extract or without substrate were used as negative controls. HEK293-hAC cells were used as positive control.
Serine Palmitoyltransferase (SPT) Assay
SPT activity was measured as described previously (13) with slight modifications. Briefly, cells (106) were homogenized in buffer A (0.25 m sucrose, 25 mm HEPES, 0.5 m EDTA, 0.5 mm DTT, pH 8) and centrifuged at 800 × g for 15 min at 4 °C. Supernatants were centrifuged at 250,000 × g for 30 min at 4 °C, and microsomal pellet was suspended in buffer A. Microsomal extracts (50 μg) were incubated at 37 °C for 2 h in assay buffer (0.5 mm l-serine, 500 nm l-[3H]serine, 100 μm palmitoyl-CoA, 40 μm pyridoxal 5′-phosphate), and reactions were stopped with methanol/potassium hydroxide plus chloroform (4:1). Lipid extraction and washing were performed as described (13). Radioactivity was measured by liquid scintillation counting. Blank samples without protein extract or without substrate were used as negative controls.
Ceramide Synthase Assay
Ceramide synthase activity was assessed as described (14, 15) with slight modifications. Briefly, cells were homogenized in 20 mm HEPES-potassium hydroxide, pH 7.2, 25 mm potassium chloride, 0.25 m sucrose, and 2 mm magnesium chloride containing a protease inhibitor mixture (Thermo Scientific) and centrifuged at 1,000 × g for 10 min at 4 °C. Homogenates (100 μg of protein) were incubated with 15 μm sphinganine and 50 μm palmitoyl-CoA as substrates in the presence of 20 μm fatty acid-free bovine serum albumin for 1 h at 37 °C. Reactions were stopped with a mixture of methanol/chloroform (1:2) containing ceramide (d18:1/17:0) as an internal standard. Lipid extractions were carried out as described below. Dihydroceramide (d18:0/16:0) was quantified as a reaction product by LC/MS. Blank samples without protein or substrates were used as negative controls.
Lipid Extraction and LC/MS Analysis
Lipid extraction and LC/MS analysis were carried out as described previously (16).
siRNA Transfection
siRNA experiments were performed using the ASAH1 gene-specific 27-mer siRNA duplex purchased from Origene Technologies. An siRNA duplex carrying TYE-563 fluorescence was used for transfection monitoring. An siRNA duplex carrying a 27-mer sequence targeting the HPRT gene was used as a positive control. Scrambled siRNAs were added to each experiment as a control. ASAH1 siRNA complexes (1 or 10 nm) were formed by mixing siRNA with Lipofectamine for 10 min at room temperature and then added to G361 cells.
RNA Isolation, cDNA Synthesis, and Real-time Quantitative PCR
Total RNA was prepared using the Ambion PureLink RNA minikit as directed by the supplier. Samples were treated with DNase to eliminate genomic DNA (PureLink DNase, Life Technologies), and cDNA synthesis was carried out with the SuperScript VILO cDNA synthesis kit according to the protocol (Life Technologies) using 1 μg of purified RNA. First-strand cDNA was amplified using the iQ SYBR Green SuperMix (Life Technologies) according to the manufacturer's instructions. ASAH1 primer sequence was AGTTGCGTCGCCTTAGTCCT (forward) and TGCACCTCTGTACGTTGGTC (reverse). Other primers were bought from Origene Technologies. Quantitative PCR was performed in a 96-well PCR plate and run at 95 °C for 10 min, followed by 40 cycles, each cycle consisting of 15 s at 95 °C and 1 min at 60 °C, using a ViiA7 instrument (ViiATM 7 real-time PCR system, Life Technologies). Two freely available software programs (NormFinder (17) and BestKeeper (18)) were used to determine the expression stability and the geometric mean of four different housekeeping genes (GAPDH, 18S, ACTB, and HPRT). ΔCt values were calculated by subtracting the Ct value of the geometric mean of these housekeeping genes from the Ct value for the genes of interest. The relative quantity of genes of interest was calculated by the expression, 2−ΔΔCt.
Immunofluorescence on Cells
Cells (105/well) were seeded on glass coverslips coated with poly-l-lysine (10 μg/ml). They were fixed in 4% paraformaldehyde for 10 min and permeabilized in 0.1% Triton X-100 plus PBS for 15 min. After blocking with 5% goat serum in 0.1% Triton X-100 plus PBS for 1 h, cells were incubated with anti-AC primary antibody (1:500; Sigma-Aldrich) overnight at 4 °C. Bound primary antibodies were detected with Alexa Fluor 488-conjugated goat anti-rabbit secondary antibodies (1:1,000; Invitrogen). Nuclei were stained with DAPI (Vectashield, Vector). Images were collected with a Nikon A1 confocal microscopy with a ×60 1.4 numerical aperture objective lens.
Immunofluorescence on Tissue Arrays
Malignant melanoma tissue arrays with normal skin tissue, including clinical stage, were purchased from US Biomax (Rockville, MD). Tissue arrays (Biomax, product code Me241a) were deparaffinized in xylene for 10 min twice and rehydrated by alcohol scale (100%, 96%, 70%, distilled water) for 5 min each. Antigen retrieval was achieved in a heater for 24 h at 60 °C, followed by incubation with blocking solution 5% goat serum in 0.1% Triton X-100 plus PBS for 1 h. To identify AC-expressing cells in melanoma tissues, immunostaining was performed by sequential incubation of anti-AC primary antibody (1:500; Sigma-Aldrich) followed by Alexa Fluor 488 (1:1,000; Invitrogen) or by IRDye 680RD-conjugated goat anti-rabbit secondary antibodies (1:500; LI-COR). Nuclei were stained with DAPI (Vectashield, Vector Laboratories). Images were collected using a Nikon A1 confocal laser microscope system. An infrared scan was performed with a Fujifilm FLA-9000 instrument using 10 μm resolution and 1,000 V potency, and data were analyzed with scanning densitometry using ImageJ software (National Institutes of Health, Bethesda, MD). Results were normalized using the expression (sample intensity − background) − (negative control intensity − background). Negative control corresponds to the same tissue biopsy incubated without primary antibody.
Subcellular Fractionation
Cytosolic and nuclear extracts were prepared with the NE-PERTM nuclear and cytoplasmic extraction kit (Thermo Fisher) following the manufacturer's instructions. Lysosomal extracts were prepared as described (12).
Immunoblotting
Protein concentrations were measured using the bicinchoninic acid assay (Pierce). Lysosomal extracts (30 μg) were separated by SDS-PAGE and transferred to polyvinylidene difluoride membranes (GE Healthcare). Overnight incubation in the presence of anti-ASAH1 antibody (1:2,000; Sigma-Aldrich) at 4 °C was followed by incubation with horseradish peroxidase-conjugated anti-rabbit IgG antibody (1:5,000; Sigma-Aldrich) for 1 h at room temperature. Protein bands were visualized using the ECL Plus kit (Amersham Biosciences). Membranes were stripped for 15 min and reprobed with a monoclonal β-actin antibody (1:5000; Sigma).
Drug Treatments and Cell Viability
Drugs were freshly prepared in DMSO. Dacarbazine was light-activated for 1 h before use. Cells (103 wells) were seeded in 96-well plates in complete medium (DMEM + 10% FBS). The next day, cells were pretreated for 6 h with ARN14988 (20 μm) before treatment with different chemotherapeutic drugs (DMEM, 5% FBS, 0.4% final DMSO) for an additional 48 h with or without AC inhibitor. The CellTiter-Glo® luminescent cell viability assay (Promega, Milan, Italy) was used to determine the number of viable cells in the culture.
Combination Index Calculation
The combination index (CI) theorem of Chou-Talalay offers a quantitative definition for the additive effect (CI = 0.9–1.1), synergism (CI < 0.9), and antagonism (CI > 1.1) in drug combinations. The effects of single drugs or drug combinations are reported as a percentage of reduction in cell viability/100 (effect) compared with vehicle. IC50 values of single drugs or drug combinations were first evaluated, and the CI was then calculated using CompuSyn software (19).
Statistical Analyses
GraphPad Prism version 5.03 (GraphPad Software, Inc., La Jolla, CA) was used for statistical analysis. Data were analyzed using Student's t test or one-way ANOVA followed by Bonferroni's or Dunnett's post hoc test for multiple comparisons. Differences between groups were considered statistically significant at values of p < 0.05. Results are expressed as mean ± S.E.
Results
High AC Expression in Human Melanoma Cell Lines and Biopsies
We measured AC mRNA levels by quantitative RT-PCR in a panel of 23 human cancer cell lines that included melanoma, astrocytoma, and other cancer cells. As shown in Fig. 1A, AC transcription was on average higher in proliferative melanoma cells (MeWo > MNT-1 > SK-MEL-28 > M14 ≥ G361) than in invasive melanoma cells (HT114 > MM127 > RPMI7951 > A375) or non-melanoma cells. Measurements of AC activity in cell lysates, using an ex vivo LC/MS-based enzyme assay, confirmed that expression of catalytically competent AC was greater in proliferative melanoma relative to invasive melanoma or other cancer cell lines included in the survey (Fig. 1B). As expected, the levels of AC mRNA and AC activity were highly correlated (Spearman's r = 0.8834, n = 93, p < 0.001; Fig. 1B, inset).
FIGURE 1.
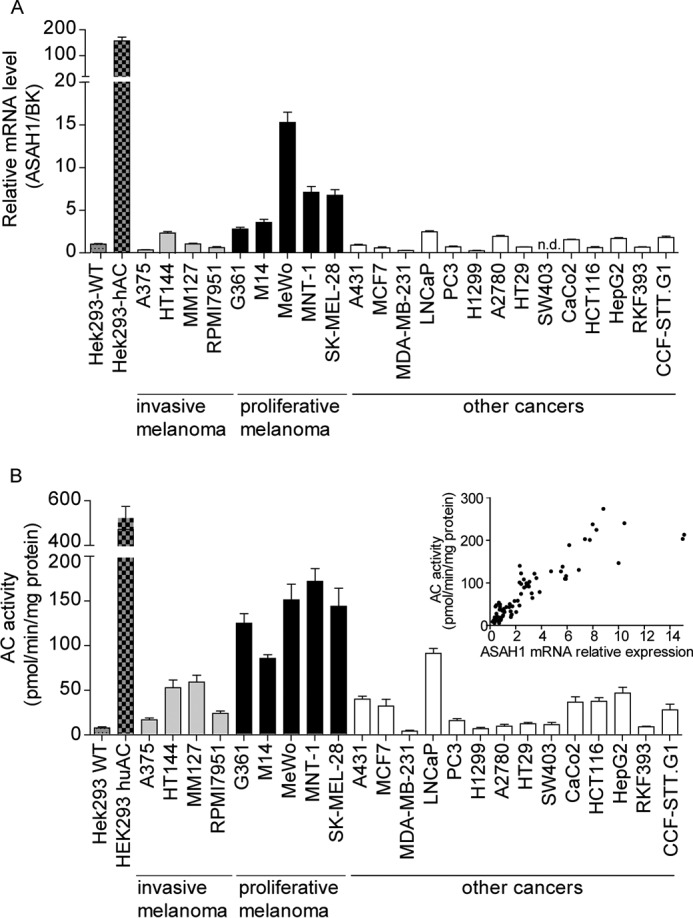
AC expression in human cancer cells in cultures. A and B, AC (ASAH1) mRNA levels (A) and enzymatic activity (B) in various cancer cell lines in cultures. Inset, correlation analysis between AC mRNA and AC activity. Values are reported as a mean ± S.E. (error bars) of six determinations from two independent experiments. Data are reported as -fold induction versus HEK293-WT. n.d., not detectable. BK, BestKeeper gene, geometric mean of four different housekeeping genes.
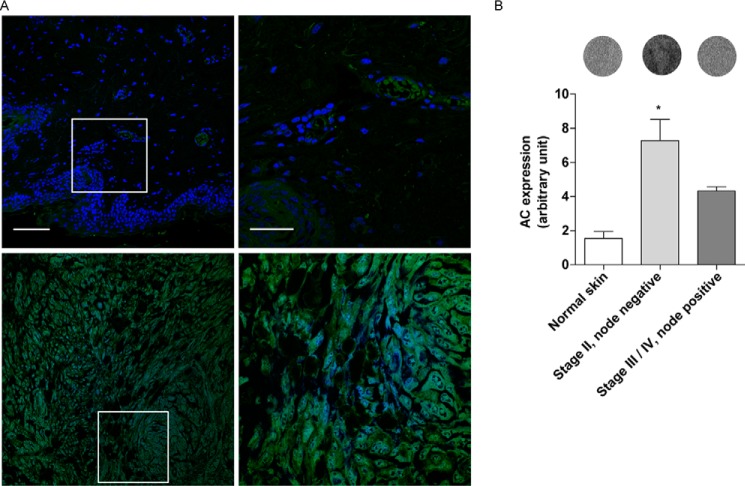
We next asked whether AC is expressed in biopsies of human malignant melanoma. Initial immunofluorescence analyses suggested that levels of AC immunoreactivity were higher in stage II lymph node-negative (any T, N0, M0) tumor lesions than in adjacent normal skin (Fig. 2A). Because of the quantitative limits of immunofluorescence techniques and the possibility that melanin autofluorescence might interfere with the analyses, we examined the same tissue biopsies using an infrared-based method, which allows for the quantitative comparison of normal and diseased skin (20). The results show that stage II melanoma lesions (21) were associated with significantly higher AC immunoreactivity, compared with normal skin or node-positive (stage III-IV, N1 or N2, M0, or M1) melanoma (Fig. 2B). These findings suggest that proliferative melanoma cells and stage II melanoma express AC at high levels.
FIGURE 2.
AC expression in human tissue arrays. A, immunofluorescence images of AC expression in normal skin (top panels) and Stage II melanoma (bottom panels). The right panels show a magnification of selected areas (white boxes). Green, AC; blue, DAPI. Scale bar, 50 μm (left) and 20 μm (right). B, infrared quantification of AC expression in melanoma at different stages with representative images of corresponding biopsies. Values are reported as means ± S.E. (error bars) (normal skin, n = 4; stage II melanoma, n = 14; stage III/IV, n = 4). *, p < 0.05 versus normal skin cancer adjacent; one-way ANOVA followed by Dunnett's test.
High AC Expression in Normal Melanocytes
To determine whether AC overexpression distinguishes melanoma cells from non-malignant melanocytes, we measured AC expression, assessed as gene transcription, protein translation, and enzyme activity, in lightly pigmented HEMa-LP melanocytes, LAMA fibroblasts, neonatal normal human epidermal keratinocytes, and nine different melanoma cell lines. We found that HEMa-LP melanocytes contained AC mRNA, protein, and enzyme activity at levels that were similar to or even higher than those measured in proliferative melanoma cells (Fig. 3, A–C). By contrast, AC gene transcription and activity were very low in keratinocytes and fibroblasts, the two main cellular components of the skin (Fig. 3, A and B).
FIGURE 3.
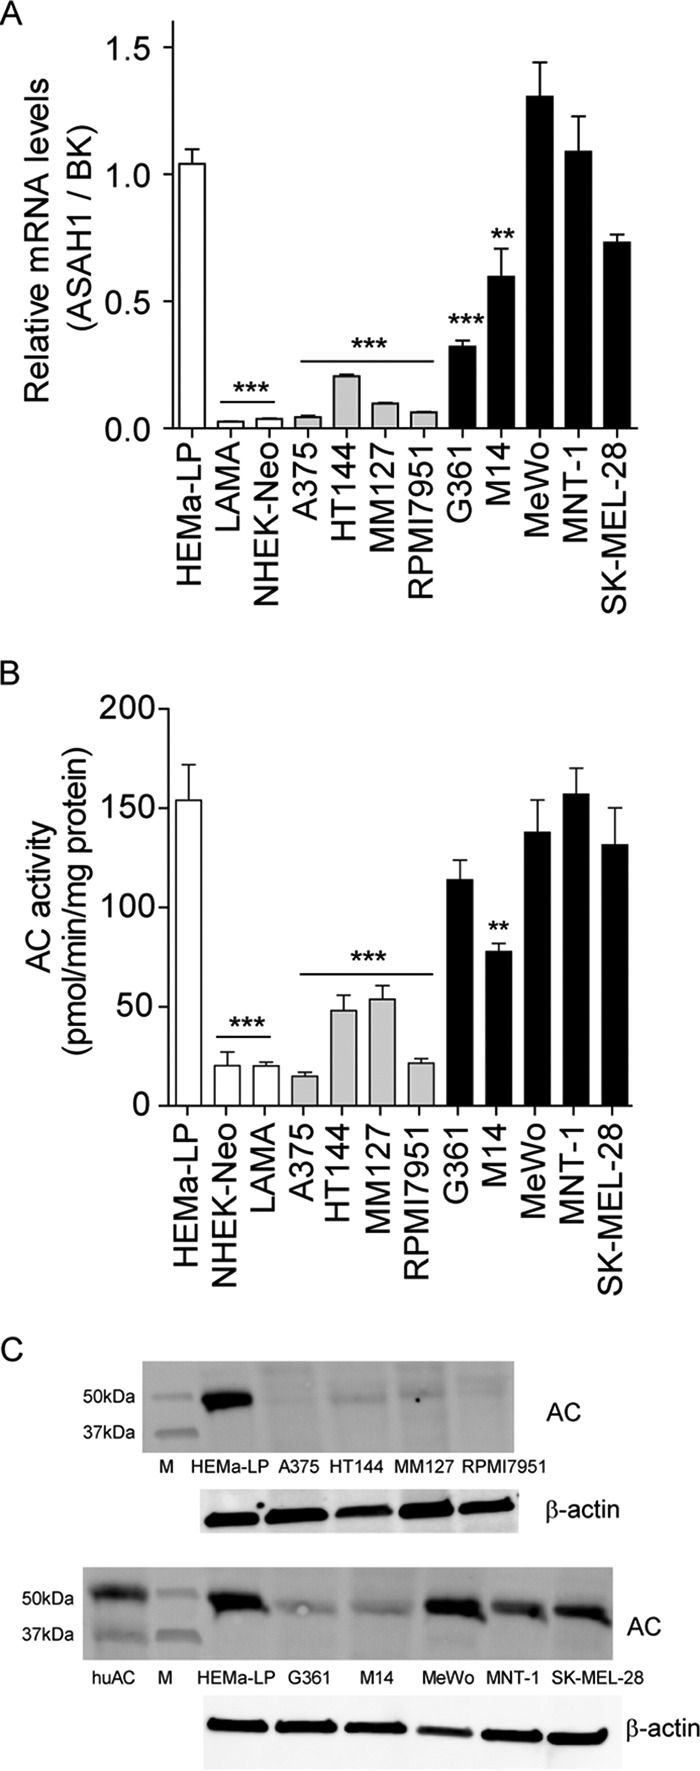
AC expression in melanocytes and other human cells in cultures. A–C, AC (ASAH1) mRNA levels (A), enzymatic activity (B), and immunoblotting (C). Values are reported as the mean ± S.E. (error bars) of 6–10 determinations from two independent experiments. **, p < 0.01; ***, p < 0.001 versus HEMa-LP; one-way ANOVA followed by Dunnett's test. Gene expression data are reported as -fold induction versus HEMa-LP. BK, BestKeeper gene, geometric mean of four different housekeeping genes.
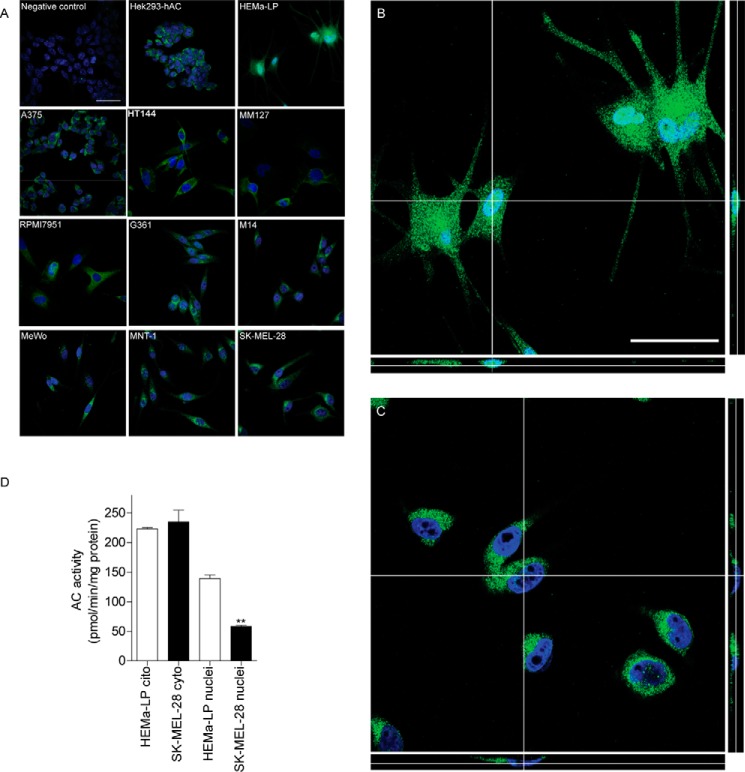
Confocal immunofluorescence experiments revealed the presence of punctuate diffuse AC staining in the cytosol of melanoma cell lines, which is suggestive of a vesicular distribution of the protein (Fig. 4A). By contrast, no immunoreactivity was detectable in the cell nucleus. A similar distribution was observed in HEK293 cells that overexpressed AC, but not in mock-transfected HEK293 cells (Fig. 4A). AC staining appeared to be markedly different in HEMa-LP melanocytes, where AC immunoreactivity was seen both in cytosol and nucleus (Fig. 4A). The higher resolution analyses reported in Fig. 4, B and C, confirmed that AC colocalizes with the nuclear stain DAPI in HEMa-LP melanocytes (Pearson's coefficient = 0.493, M1 = 0.997, M2 = 0.326) but not in SK-MEL-28 melanoma cells, a melanoma line in which AC is expressed at levels similar to those found in melanocytes (Pearson's coefficient = −0.348, M1 = 0.079, M2 = 0.289) (Fig. 4, A–C). Furthermore, nuclear fractions prepared from HEMa-LP melanocytes contained significantly higher levels of AC enzymatic activity, compared with those obtained from proliferative melanoma SK-MEL-28 cells (Fig. 4D). We interpret these findings as indicating that the subcellular localization of AC, rather than its absolute level of expression, differs between non-malignant HEMa-LP melanocytes and SK-MEL-28 melanoma cells.
FIGURE 4.
AC localization in HEMa-LP and SKMel28 cells. A, selected z-scanning series of images showing immunofluorescence for AC (green) or DAPI (blue) in melanoma and normal melanocytes. Scale bar, 50 μm. Right panels, high magnification orthogonal views (yx plane, yz plane, and xz plane) of AC (green) and DAPI (blue) staining in normal melanocytes (B) or SK-MEL-28 cells (C). Scale bar, 50 μm. D, AC enzymatic activity in cytosolic and nuclear extracts from HEMa-LP and SK-MEL-28 cells. Values are reported as the mean ± S.E. (error bars) of 6–10 determinations from two independent experiments. **, p < 0.01 versus HEMa-LP, Student's t test.
Lowered de Novo Ceramide Biosynthesis in Melanoma Cells
We next used an LC/MS assay developed by our laboratory (16) to measure ceramide (d18:1/16:0), a preferred substrate for AC (5), along with water-soluble sphingolipid metabolites, such as S1P. Based on their similar AC expression levels, we predicted that ceramide (d18:1/16:0) content should be comparable in non-malignant melanocytes and malignant melanoma cells. In striking contrast with our prediction, we found that most melanoma cell lines (with only the exception of G361) showed significantly lower levels of ceramide (d18:1/16:0) and its precursor, dihydroceramide (d18:0/16:0), compared with non-malignant melanocytes (Fig. 5, A and B). Similar results were obtained with other ceramide species that are preferentially hydrolyzed by AC, including ceramide (d18:1/14:0) and ceramide (d18:1/18:0).
FIGURE 5.
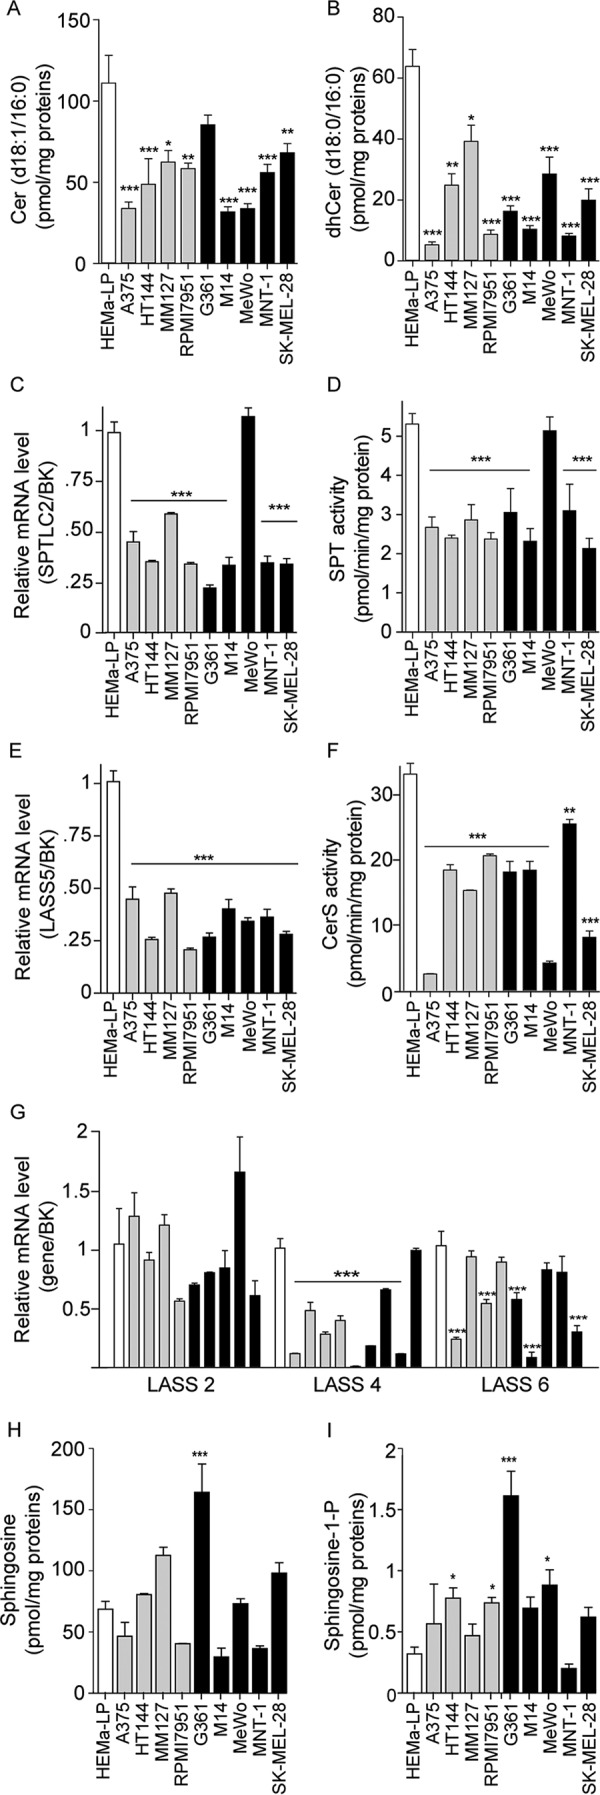
Ceramide biosynthesis in melanoma cells in cultures. A and B, Cer (d18:1/16:0) (A) and dhCer (d18:0/16:0) (B) levels in normal melanocytes and nine different melanoma cell lines. C and E, expression of genes involved in Cer (d18:1/16:0) de novo biosynthesis. D and F, enzymatic activity of serine palmitoyl transferase (D) and ceramide synthase (F). G, expression of genes involved in de novo ceramide biosynthesis. H and I, sphingosine (H) and S1P (I) levels. Values are reported as the mean ± S.E. (error bars) of 4–6 determinations. Independent experiments yielded similar results. *, p < 0.05; **, p < 0.01; ***, p < 0.001 versus HEMa-LP; one-way ANOVA followed by Dunnett's test. Gene expression data are reported as -fold induction versus HEMa-LP. BK, BestKeeper gene, geometric mean of four different housekeeping genes.
To determine whether the low ceramide levels found in melanoma cells might be attributable to impaired production of this lipid messenger, we measured the expression and activity of two key enzymes in de novo ceramide biosynthesis: SPT and ceramide synthase 5 (CerS5; also known as LASS5) (22). The catalytic subunit of SPT, encoded by the SPTLC2 gene, catalyzes the condensation of l-serine and palmitoyl-CoA, the first committed step in de novo ceramide biosynthesis, whereas CerS5 catalyzes the conversion of dihydrosphingosine to dihydroceramide (22). With only the exception of MeWo cells, SPTLC2 transcription and SPT activity were significantly lower in melanoma lines than in HEMa-LP melanocytes (Fig. 5, C and D). In addition, CerS5 expression was drastically decreased in all melanoma cells, compared with HEMa-LP melanocytes (Fig. 5, E and F). Significant differences were also observed in the transcription of CerS4 and CerS6, which are responsible for the biosynthesis of ceramide (d18:1/14:0), ceramide (d18:1/16:0), and ceramide (d18:1/18:0) (Fig. 5G) (4). Conversely, no differences were observed in the transcription of CerS2, which is involved in the formation of longer chain ceramides (Fig. 5G). Sphingosine and S1P levels were also quantified. Similar levels of sphingosine were found in melanocytes and most melanoma cells, with the exception of G361 cells, which showed a much higher content (Fig. 5H). Conversely, S1P levels were higher in the majority of melanoma cell lines compared with normal melanocytes (Fig. 5I). These results suggest that production of mid-length ceramide species, such as ceramide (d18:1/16:0), which are known to be involved in the control of senescence and apoptosis (4, 23), is suppressed in melanoma cells through transcriptional down-regulation of multiple enzymes of de novo ceramide biosynthesis. Melanoma cells also display higher levels of S1P, whose key roles in the regulation of proliferation, metastasis, and drug resistance are well recognized (24).
AC as a Target for Melanoma Chemosensitization
Last, we examined whether inhibition of AC activity elevated ceramide levels and decreased S1P in melanoma cells and, by doing so, influenced melanoma cell viability. We used two complementary approaches, pharmacological inhibition of AC activity and silencing of the ASAH1 gene.
For our pharmacological studies, we used a newly identified compound, ARN14988, which has high inhibitory potency on AC (IC50 for human AC = 12.8 ± 0.8 nm) and improved chemical stability compared with the reference AC inhibitor ARN398 (13) (Table 1). ARN14988 was obtained by introduction of an isobutylcarbamoyl moiety at position N3 and a chlorine atom at position 5 of the 2,4-dioxopyrimidine-1-carboxamide ring of ARN398 (Table 1).
TABLE 1.
Properties of AC inhibitors used in the present study
Shown are chemical structures, inhibitory potencies (IC50) on human AC, and stability profile of compounds ARN398 and ARN14988.
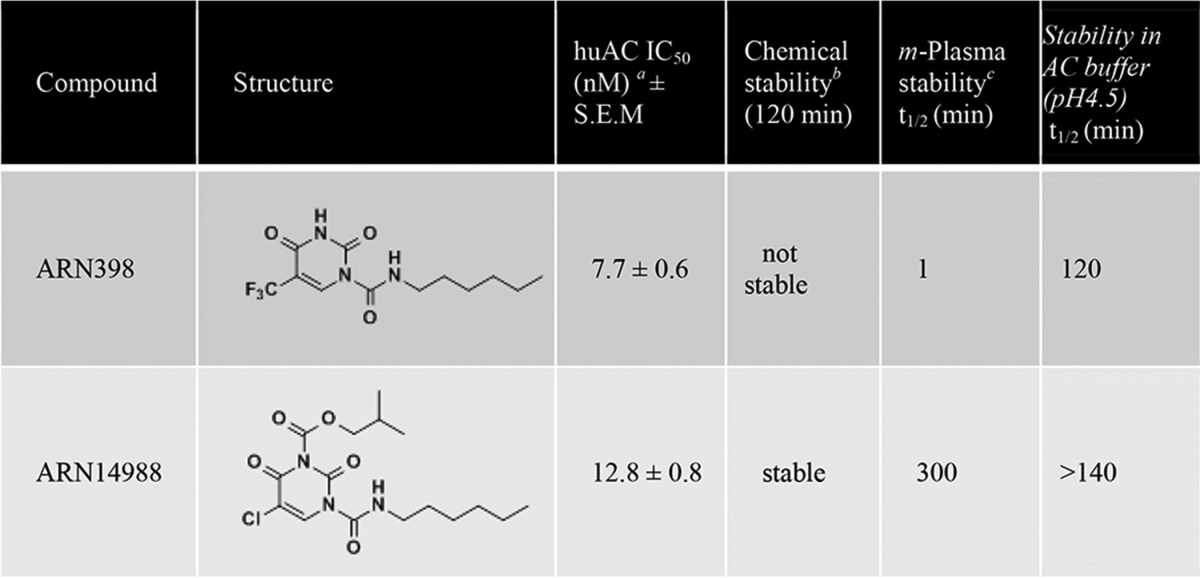
a IC50 values are expressed as the means of three determinations.
b Chemical stability was determined by 1H NMR analysis of the compound in a DMSO-d6 solution. Stable compounds showed < 10% degradation after 120 min.
c Mouse plasma, 37°C.
We first examined the effects of ARN14988 on the invasive melanoma line A375. The compound caused a concentration- and time-dependent inhibition of AC activity in these cells (Fig. 6, A and B). The fact that the IC50 obtained in intact cells (1.5 μm) was higher than that observed in vitro (13 nm) is probably due to limited access to the lysosomal compartment and/or incomplete stability of the molecule. AC inhibition by ARN14988 was accompanied by elevations in the levels of ceramide (d18:1/16:0) and its precursor dihydroceramide (d18:0/16:0) (Fig. 6, C and D), which were significant at a concentration of inhibitor as low as 2 μm, as well as by significant decreases in the levels of sphingosine and S1P, already appreciable after a 15-min incubation with ARN14988 (Fig. 6, E and F). Underscoring the target selectivity of this compound, ARN14988 had little or no effect on the intracellular levels of sphingomyelin (d18:1/16:0) and glucosylceramide (d18:1/16:0) (Fig. 6, G and H). Importantly, ARN14988 exerted similar effects in all melanoma cell lines surveyed in the present study (Fig. 7), indicating that the compound inhibits AC equally well in proliferative and invasive cells.
FIGURE 6.
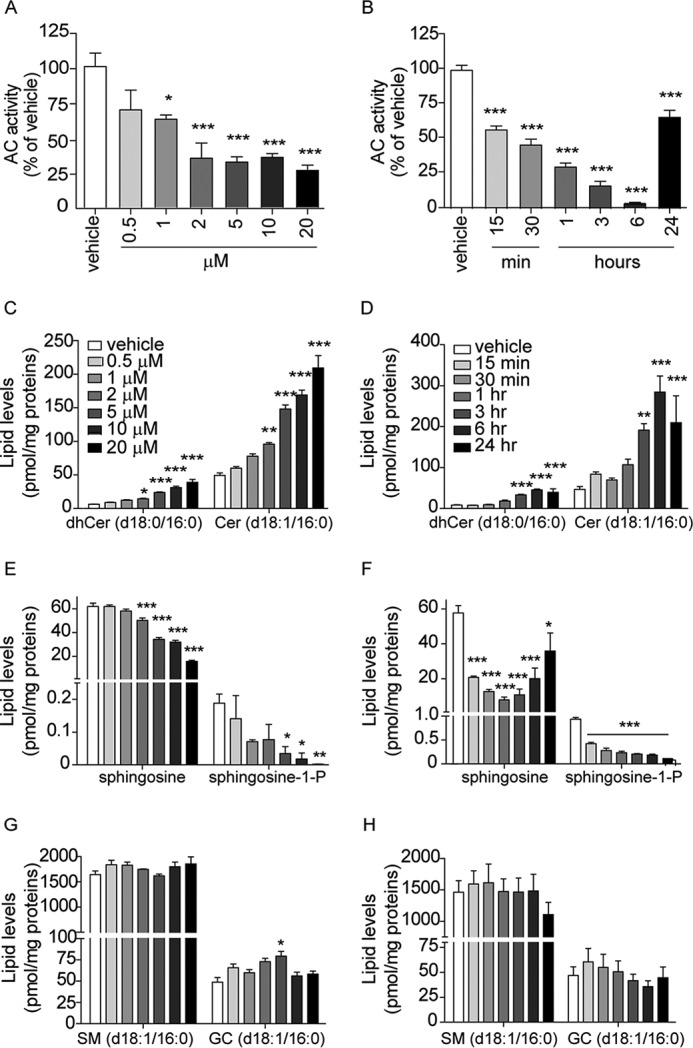
Effects of ARN14988 on AC activity and sphingolipid levels in A375 cells. Concentration dependence (3-h incubation; left panels) and time course (20 μm; right panels) of ARN14988 or vehicle (0.4% DMSO; open bars). Shown are AC activity (A and B) and sphingolipid levels (C–H). Values are reported as the mean ± S.E. (error bars) of 3–6 determinations. Independent experiments yielded similar results. *, p < 0.05; **, p < 0.01; ***, p < 0.001 versus vehicle; one-way ANOVA followed by Dunnett's test.
FIGURE 7.
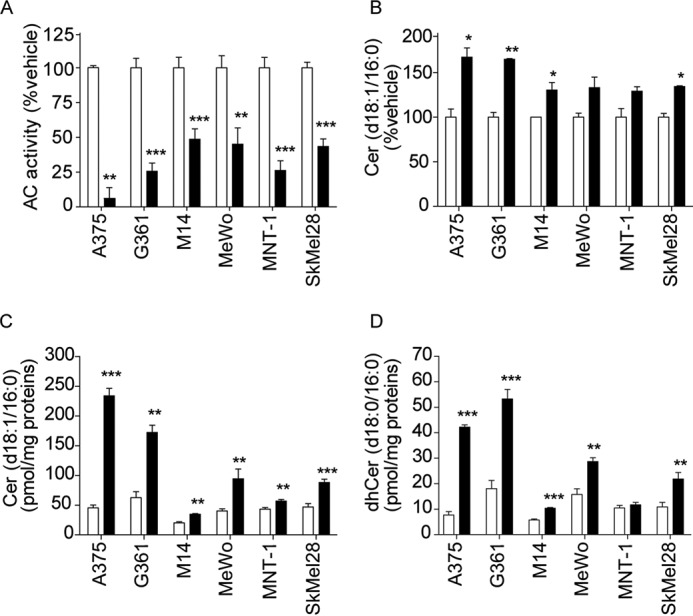
Effects of vehicle (0.4% DMSO; open bars) or ARN14988 (20 μm; closed bars) in various melanoma cell lines after a 6-h incubation. A, AC activity; B, ceramide (d18:1/16:0) levels in cell media; C, intracellular ceramide (d18:1/16:0) levels; D, dhCer (d18:0/16:0) levels. Values are reported as the mean ± S.E. (error bars) of two independent experiments that yielded similar results (n = 5–6). *, p < 0.05; **, p < 0.01; ***, p < 0.001 versus vehicle; Student's t test.
A375 and G361 cells were selected as a representative example of invasive and proliferative cell lines for cytotoxicity studies for two reasons: 1) both lines have BRAF and CDKN2A mutations, but not mutations for p53, MITF, or PTEN; 2) the two lines are equally sensitive to AC inhibition by ARN14988. Despite its ability to suppress AC activity and elevate ceramide levels, ARN14988 only modestly affected melanoma cell viability. EC50 values, assessed after a 48-h incubation, were 51.9 μm in A375 cells and 77.3 μm in G361 cells (Fig. 8A). Likewise, ARN14988 did not cause significant cell death in normal skin cells; the EC50 value of the compound in primary cultures of human fibroblasts was 86.4 μm (Fig. 8A). The cytotoxic potency of ARN14988 was similar to that of its parent compound, ARN398, which reduced cell viability with EC50 values of 41.8 μm in A375 cells and 67.7 μm in G361 cells (Fig. 8B).
FIGURE 8.
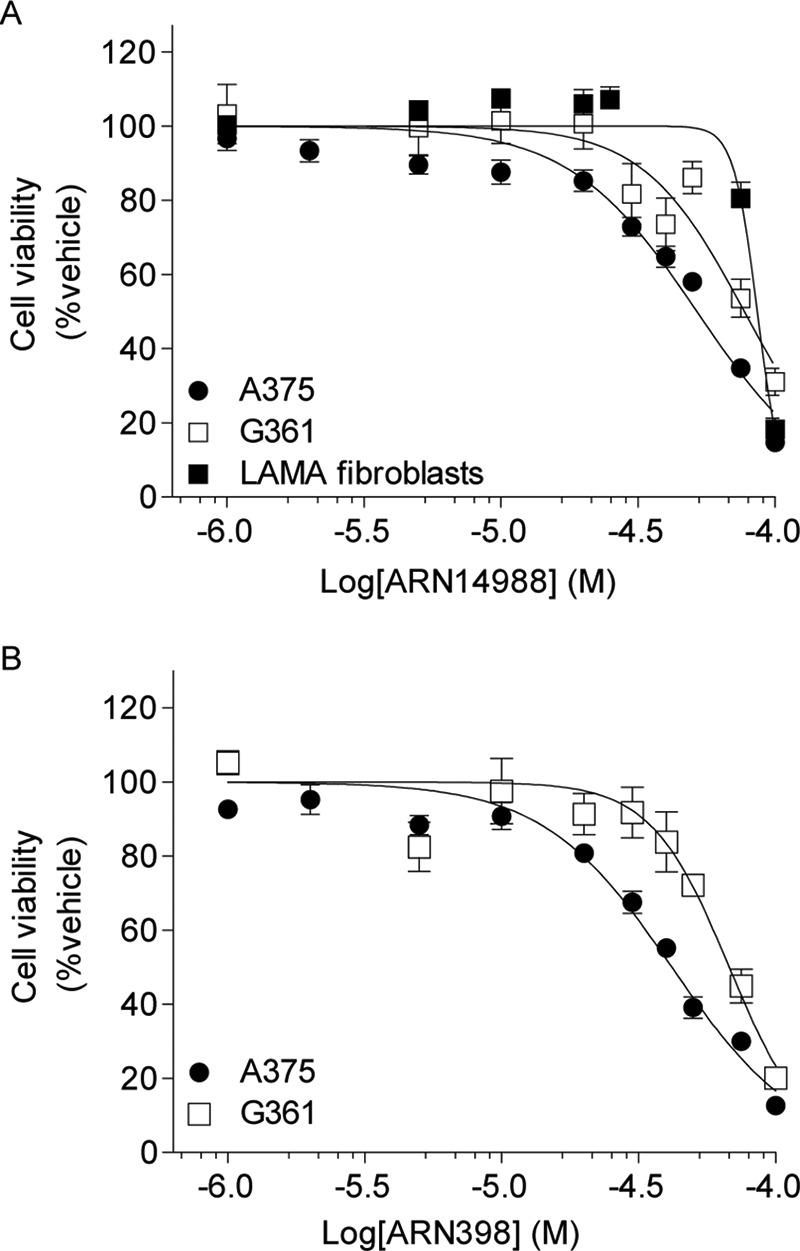
Cytotoxic effects of ARN398 and ARN14988 in melanoma cell lines. Cell viability was evaluated using the Cell Titer Glo assay. Sigmoidal dose response was used to calculate EC50 values. A, EC50 values of ARN14988 on different human melanoma cell lines and normal fibroblasts are shown: A375, 51.9 μm; G361, 77.3 μm; LAMA fibroblasts, 86.4 μm. B, EC50 values of ARN398 on different human melanoma cell lines: A375, 41.8 μm; G361, 67.7 μm. Results are expressed as the mean of two independent experiments that yielded similar results (n = 8–16 for each point). Error bars, S.E.
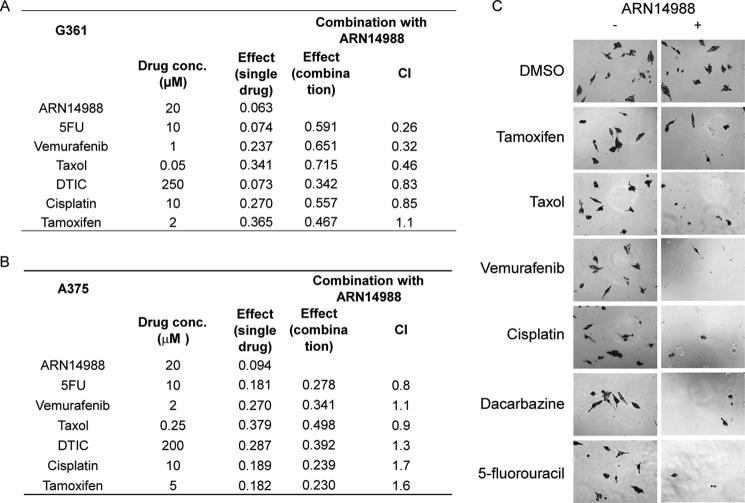
Although only weakly cytotoxic when applied alone, ARN14988 produced a synergistic potentiation of the cytotoxic effects of standard chemotherapeutic drugs (Fig. 9 and supplemental Table S1), as shown previously for other AC inhibitors of the same class on colon cancer cells (12). Experiments in G361 cells, a melanoma cell line with a proliferative phenotype (25), showed that ARN14988 acted synergistically with 5-fluorouracil (5-fluorouracil IC50 = 37.1 μm, 5-fluorouracil plus ARN14988 IC50 = 12.3 μm, CI = 0.26), vemurafenib (vemurafenib IC50 = 0.295 μm, vemurafenib plus ARN14988 IC50 = 0.076 μm, CI = 0.32), and taxol (taxol IC50 = 0.177 μm, taxol plus ARN14988 IC50 = 0.039 μm, CI = 0.46). By contrast, little if any synergism was observed with dacarbazine (dacarbazine IC50 = 449 μm, dacarbazine plus ARN14988 IC50 = 335 μm, CI = 0.83) and cisplatin (cisplatin IC50 = 21 μm, cisplatin plus ARN14988 IC50 = 12.6 μm, CI = 0.85) (Fig. 9, A and C). Similar results were obtained at different concentrations of chemotherapeutics (supplemental Table S1) as well as with the previously described AC inhibitor, ARN398 (supplemental Fig. S1) (12).
FIGURE 9.
Synergistic effects of ARN14988 on proliferative or invasive melanoma cell viability. Effect of ARN14988 alone or in combination with selected chemotherapeutic drugs on G361 (A) or A375 (B) cell viability. Data, expressed as effect on cell viability, are the mean of three independent experiments that yielded similar results (n = 4 for each experiment). C, representative images of G361 cells treated with selected chemotherapeutic drugs. −, without ARN14988; +, with ARN14988, 20 μm.
In contrast with these results in proliferative G361 cells, ARN14988 elicited no synergistic effect in invasive A375 cells (Fig. 9B). We conclude that ARN14988 is a potent and effective inhibitor of intracellular AC activity, which displays chemosensitizing properties in proliferative, but not invasive, melanoma cells.
Our pharmacological results were confirmed using a genetic approach (Fig. 10). Silencing of the ASAH1 gene with an siRNA produced a 60% decrease in gene expression (Fig. 10A), which was associated with a significant increase in ceramide (d18:1/16:0) and a concomitant decrease in sphingosine and S1P levels (Fig. 10B). ASAH1 knockdown produced a synergistic effect with classic chemotherapeutic drugs (Fig. 10C), as observed with applications of ARN14988 and ARN398.
FIGURE 10.
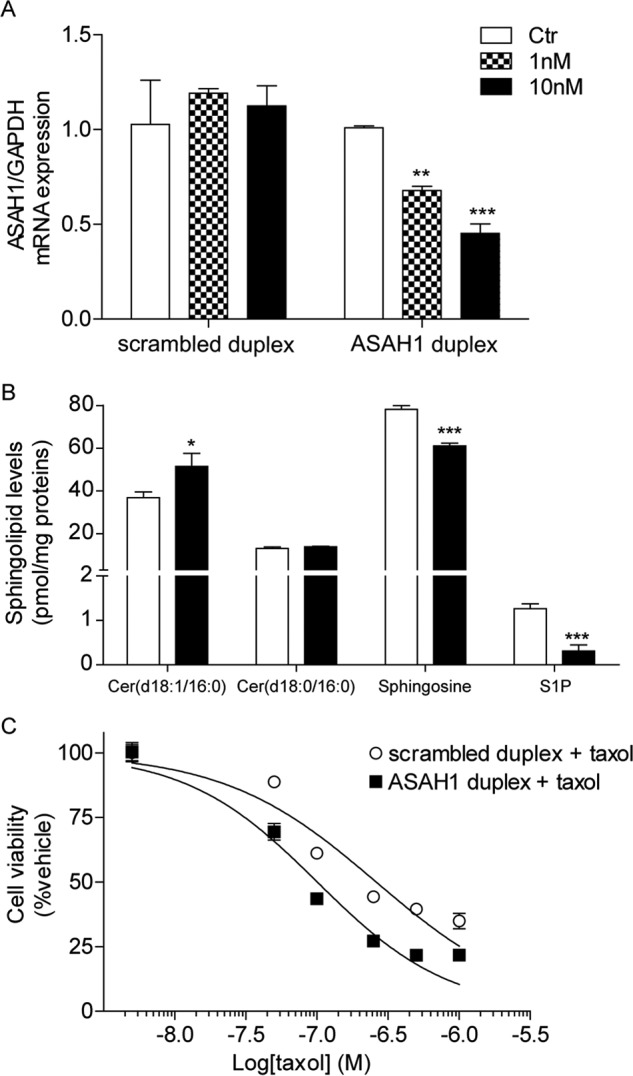
Effect of ASAH1 siRNA on G361 cells. A, ASAH1 mRNA levels in G361 cells transfected with scrambled or ASAH1 duplex (1 or 10 nm). B, effect of ASAH1 siRNA on G361 sphingolipid levels. C, effect of ASAH1 siRNA in combination with taxol on G361 cell viability. Data are the mean of two independent experiments that yielded similar results. *, p < 0.05; **, p < 0.01; ***, p < 0.001 versus vehicle; Student's t test. Error bars, S.E.
Discussion
In the present study, we used a multidisciplinary strategy that combined lipidomics, morphology, and pharmacology to investigate the functions of AC in human melanocytes and melanoma cell lines. We found that the enzyme is expressed at high levels in proliferative melanoma cells and in biopsies of stage II melanoma, compared with other cancer cell lines, as well as non-cancerous keratinocytes and fibroblasts. Confocal immunofluorescence analyses showed that AC is distributed throughout the cytosol of melanoma cells, in a punctuate staining that is suggestive of vesicular localization. Surprisingly, we found that AC is also strongly expressed in normal melanocytes but with a more distinctively nuclear localization than in melanoma. Despite having similar levels of AC expression, melanoma cells contain substantially lower levels of AC-regulated ceramides, which are known to be involved in senescence and chemosensitization (4), than do normal melanocytes. This striking difference is seemingly caused by transcriptional suppression of key enzymes of ceramide biosynthesis via the de novo pathway. Increased levels of S1P are also a distinctive feature of melanoma cells compared with normal melanocytes. To explore the functional significance of down-regulated ceramide signaling in melanoma, we utilized a new chemically stable AC inhibitor, the compound ARN14988, which inhibits AC activity with nanomolar potency. ARN14988 normalized ceramide levels and concomitantly sensitized proliferative melanoma cells to the cytotoxic actions of various anti-tumoral agents. A similar sensitization was observed when using another AC inhibitor, ARN398 (12). Together, our results point to a key role for AC-regulated ceramide signaling in melanoma proliferation and suggest the potential utility of AC blockade as a chemosensitizing strategy in proliferative melanoma.
The role of AC in cancer progression and chemoresistance has been the object of multiple studies (12, 26–35). Compounds that increase cellular ceramide levels, such as oleoylethanolamide and B13, synergize with antitumoral agents to decrease viability of glioblastoma (29), hepatoma (30), colon (31), and prostate cancer cells (32). Similar synergistic effects have been reported in human breast cancer cells with the AC inhibitor DM102, when this compound is combined with the cell-permeating ceramide analog C6 (33), and in colon cancer cells with substituted 2,4-dioxopyrimidine-1-carboxamides, such as ARN398 (12, 35). Evidence indicates that the same approach may be used to slow down or stop proliferation in melanoma cells (36–39). For example, C2-ceramide was found to inhibit the growth of Malme-3 M cells (38), and a phytosphingosine-type ceramide showed cytotoxic activity on the human melanoma cell line SK-MEL-1 (36). Moreover, ceramide-based combination therapy has been studied as a new strategy to induce melanoma cell death (40–42); Feng et al. (40) demonstrated that ceramide can synergistically enhance the antitumor activity of docetaxel. In line with this observation, Tran et al. (41) used a combination of sorafenib and nanoliposomal ceramide to inhibit melanoma growth. Finally, short-chain ceramides were shown to sensitize melanoma cells to curcumin-induced cell death and apoptosis in vitro (42). However, the effects of AC inhibitors were not investigated in those studies. Indeed, until now, the role of AC in melanoma biology has only been the object of one study, by Bedia et al. (10), who reported that dacarbazine causes degradation of AC and that this effect contributes to the drug's cytotoxic actions.
The phenotype-switching model is an innovative model of tumor progression to describe cancer development, metastasis, and resistance to therapy (25, 43–47). This model posits that melanoma cells can switch between two states: cells with high proliferative potential, which are less invasive, and cells with high metastatic potential, which are less proliferative. The ASAH1 gene, which encodes for the main isoform of AC, has been identified as one of the genes that change the most between proliferative and invasive melanoma phenotypes, with proliferative melanomas having higher AC expression than invasive ones (25, 48). In our experiments, melanoma cell lines with an invasive phenotype, as defined by the HOPP (Heuristic Online Phenotype Prediction) database (25), were found to have lower AC levels and activity than proliferative melanoma lines, which is suggestive of different roles for AC in various melanoma stages. Quantitative immunohistochemical analysis of AC on human biopsies supported this hypothesis and revealed a possible relation between AC levels and node-negative Stage II melanomas. In line with our observation, work from Liu et al. (9) has shown that AC is one of several proteins whose autoantibodies are expressed in 40% of node-negative patients (19 of 48) but in none of the node-positive patients (0 of 31).
When we investigated AC expression in primary non-tumoral skin cells, we discovered that normal human melanocytes express AC at a higher level than the two main skin cells: keratinocytes and fibroblasts. The importance of this discovery lies in the fact that melanoma arises from uncontrolled proliferation of normal melanocytes, which generally represent only about 2% of total epidermal cells (49). This result may indicate that AC is not overexpressed in melanoma compared with normal skin but that the number of cells expressing AC increases during melanoma progression (Fig. 11).
FIGURE 11.
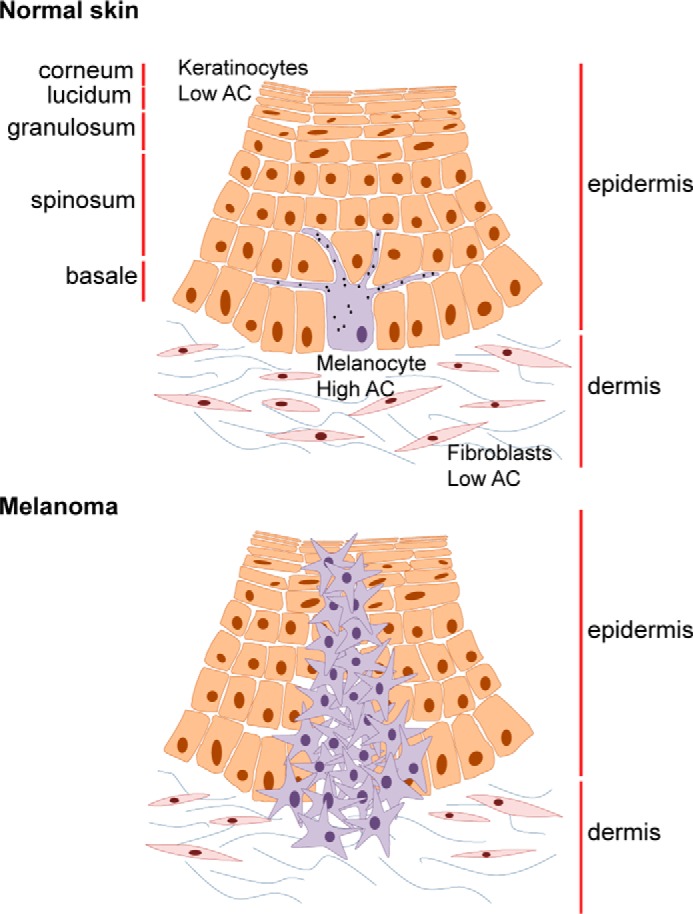
Representation of AC expression in normal skin cells and melanoma.
Our confocal microscopy experiments uncovered a nuclear localization of AC in normal melanocytes, which is ostensibly absent in melanoma cells. This difference in subcellular localization might be related to recent work pointing to the existence of intriguing structural and functional links between AC and transcription factors that are important in melanocyte biology. These include the histone methyltransferase SETDB1 (SET domain bifurcated 1), which has been shown to accelerate melanoma onset (50) and was found to directly interact with AC (51), and MITF (microphthalmia-associated transcription factor), a master regulator of melanocyte terminal differentiation and pigmentation (52), which also plays a role in melanoma cell proliferation and survival (52, 53) and was recently shown to up-regulate AC expression (54). Additional studies are needed to address the possibility that nuclear AC contributes to the regulation of gene expression in normal melanocytes.
Melanoma is one of the most aggressive forms of human cancer, with very poor prognosis if it is not diagnosed at early stages. It is the most common cause of cancer death for women from 25 to 30 years old (52, 55, 56). Drugs commonly used in the clinic for adjuvant therapy in melanoma include dacarbazine, paclitaxel (taxol), cisplatin, vemurafenib, interferon-α, and interleukin-2 (52). However, melanoma is extremely resistant to chemotherapy, radiotherapy, and immunotherapy, and the development of more effective targeted treatments is crucial to achieve improvements in the melanoma field. The discovery of agents, such as AC inhibitors, that work synergistically with classic chemotherapeutics may be useful to enhance the efficacy and reduce toxicity of current therapies.
Author Contributions
D. Piomelli ideated and overviewed the project; N. R. designed, performed, and analyzed experiments; F. P. performed experiments; S. P. designed and supervised immunofluorescence studies; D. Pizzirani and A. Bach performed chemical synthesis; A. Basit performed LC/MS analyses; A. G. helped with experimental design; and D. Piomelli and N. R. wrote the manuscript with contributions from all coauthors. All authors reviewed the results and approved the final version of the manuscript.
Supplementary Material
Acknowledgments
We thank Michele Lai for the generation of primary human fibroblasts and Giuliana Ottonello and Andrea Armirotti for the analytical stability assay.
The authors declare the following competing financial interests. Two patent applications protecting the class of compounds disclosed in this paper were filed by D. Piomelli, N. Realini, M. Mor, C. Pagliuca, D. Pizzirani, R. Scarpelli, and T. Bandiera.

This article contains supplemental Table S1 and Fig. S1.
- AC
- acid ceramidase
- SPT
- serine palmitoyltransferase
- CI
- combination index
- ANOVA
- analysis of variance
- S1P
- sphingosine 1-phosphate.
References
- 1. Morad S. A., and Cabot M. C. (2013) Ceramide-orchestrated signalling in cancer cells. Nat. Rev. Cancer 13, 51–65 [DOI] [PubMed] [Google Scholar]
- 2. Hannun Y. A., and Obeid L. M. (2011) Many ceramides. J. Biol. Chem. 286, 27855–27862 [DOI] [PMC free article] [PubMed] [Google Scholar]
- 3. Hannun Y. A., and Obeid L. M. (2008) Principles of bioactive lipid signalling: lessons from sphingolipids. Nat. Rev. Mol. Cell Biol. 9, 139–150 [DOI] [PubMed] [Google Scholar]
- 4. Grösch S., Schiffmann S., and Geisslinger G. (2012) Chain length-specific properties of ceramides. Prog. Lipid Res. 51, 50–62 [DOI] [PubMed] [Google Scholar]
- 5. Mao C., and Obeid L. M. (2008) Ceramidases: regulators of cellular responses mediated by ceramide, sphingosine, and sphingosine-1-phosphate. Biochim. Biophys. Acta 1781, 424–434 [DOI] [PMC free article] [PubMed] [Google Scholar]
- 6. Furuya H., Shimizu Y., and Kawamori T. (2011) Sphingolipids in cancer. Cancer Metastasis Rev. 30, 567–576 [DOI] [PubMed] [Google Scholar]
- 7. Gangoiti P., Camacho L., Arana L., Ouro A., Granado M. H., Brizuela L., Casas J., Fabriás G., Abad J. L., Delgado A., and Gómez-Muñoz A. (2010) Control of metabolism and signaling of simple bioactive sphingolipids: implications in disease. Prog. Lipid Res. 49, 316–334 [DOI] [PubMed] [Google Scholar]
- 8. Musumarra G., Barresi V., Condorelli D. F., and Scirè S. (2003) A bioinformatic approach to the identification of candidate genes for the development of new cancer diagnostics. Biol. Chem. 384, 321–327 [DOI] [PubMed] [Google Scholar]
- 9. Liu Y., He J., Xie X., Su G., Teitz-Tennenbaum S., Sabel M. S., and Lubman D. M. (2010) Serum autoantibody profiling using a natural glycoprotein microarray for the prognosis of early melanoma. J. Proteome Res. 9, 6044–6051 [DOI] [PMC free article] [PubMed] [Google Scholar]
- 10. Bedia C., Casas J., Andrieu-Abadie N., Fabriàs G., and Levade T. (2011) Acid ceramidase expression modulates the sensitivity of A375 melanoma cells to dacarbazine. J. Biol. Chem. 286, 28200–28209 [DOI] [PMC free article] [PubMed] [Google Scholar]
- 11. Pizzirani D., Bach A., Realini N., Armirotti A., Mengatto L., Bauer I., Girotto S., Pagliuca C., De Vivo M., Summa M., Ribeiro A., and Piomelli D. (2015) Benzoxazolone carboxamides: potent and systemically active inhibitors of intracellular acid ceramidase. Angew. Chem. Int. Ed. Engl. 54, 485–489 [DOI] [PMC free article] [PubMed] [Google Scholar]
- 12. Realini N., Solorzano C., Pagliuca C., Pizzirani D., Armirotti A., Luciani R., Costi M. P., Bandiera T., and Piomelli D. (2013) Discovery of highly potent acid ceramidase inhibitors with in vitro tumor chemosensitizing activity. Sci. Rep. 3, 1035. [DOI] [PMC free article] [PubMed] [Google Scholar]
- 13. Rütti M. F., Richard S., Penno A., von Eckardstein A., and Hornemann T. (2009) An improved method to determine serine palmitoyltransferase activity. J. Lipid Res. 50, 1237–1244 [DOI] [PMC free article] [PubMed] [Google Scholar]
- 14. Laviad E. L., Kelly S., Merrill A. H. Jr., and Futerman A. H. (2012) Modulation of ceramide synthase activity via dimerization. J. Biol. Chem. 287, 21025–21033 [DOI] [PMC free article] [PubMed] [Google Scholar]
- 15. Kim H. J., Qiao Q., Toop H. D., Morris J. C., and Don A. S. (2012) A fluorescent assay for ceramide synthase activity. J. Lipid Res. 53, 1701–1707 [DOI] [PMC free article] [PubMed] [Google Scholar]
- 16. Basit A., Piomelli D., and Armirotti A. (2015) Rapid evaluation of 25 key sphingolipids and phosphosphingolipids in human plasma by LC-MS/MS. Anal. Bioanal. Chem. 407, 5189–5198 [DOI] [PMC free article] [PubMed] [Google Scholar]
- 17. Andersen C. L., Jensen J. L., and Ørntoft T. F. (2004) Normalization of real-time quantitative RT-PCR data: a model-based variance estimation approach to identify genes suited for normalization, applied to bladder and colon cancer data sets. Cancer Res. 64, 5245–5250 [DOI] [PubMed] [Google Scholar]
- 18. Pfaffl M. W., Tichopad A., Prgomet C., and Neuvians T. P. (2004) Determination of stable housekeeping genes, differentially regulated target genes and sample integrity: BestKeeper–Excel-based tool using pair-wise correlations. Biotechnol. Lett. 26, 509–515 [DOI] [PubMed] [Google Scholar]
- 19. Chou T. C. (2006) Theoretical basis, experimental design, and computerized simulation of synergism and antagonism in drug combination studies. Pharmacol. Rev. 58, 621–681 [DOI] [PubMed] [Google Scholar]
- 20. Wang C., Popescu D. C., Wu C., Zhu J., Macklin W., and Wang Y. (2010) In situ fluorescence imaging of myelination. J. Histochem. Cytochem. 58, 611–621 [DOI] [PMC free article] [PubMed] [Google Scholar]
- 21. Balch C. M., Gershenwald J. E., Soong S. J., Thompson J. F., Atkins M. B., Byrd D. R., Buzaid A. C., Cochran A. J., Coit D. G., Ding S., Eggermont A. M., Flaherty K. T., Gimotty P. A., Kirkwood J. M., McMasters K. M., Mihm M. C. Jr., Morton D. L., Ross M. I., Sober A. J., and Sondak V. K. (2009) Final version of 2009 AJCC melanoma staging and classification. J. Clin. Oncol. 27, 6199–6206 [DOI] [PMC free article] [PubMed] [Google Scholar]
- 22. Weiss B., and Stoffel W. (1997) Human and murine serine-palmitoyl-CoA transferase: cloning, expression and characterization of the key enzyme in sphingolipid synthesis. Eur. J. Biochem. 249, 239–247 [DOI] [PubMed] [Google Scholar]
- 23. Saddoughi S. A., Song P., and Ogretmen B. (2008) Roles of bioactive sphingolipids in cancer biology and therapeutics. Subcell. Biochem. 49, 413–440 [DOI] [PMC free article] [PubMed] [Google Scholar]
- 24. Pyne N. J., and Pyne S. (2010) Sphingosine 1-phosphate and cancer. Nat. Rev. Cancer 10, 489–503 [DOI] [PubMed] [Google Scholar]
- 25. Widmer D. S., Cheng P. F., Eichhoff O. M., Belloni B. C., Zipser M. C., Schlegel N. C., Javelaud D., Mauviel A., Dummer R., and Hoek K. S. (2012) Systematic classification of melanoma cells by phenotype-specific gene expression mapping. Pigment Cell Melanoma Res. 25, 343–353 [DOI] [PubMed] [Google Scholar]
- 26. Saied E. M., and Arenz C. (2014) Small molecule inhibitors of ceramidases. Cell Physiol. Biochem. 34, 197–212 [DOI] [PubMed] [Google Scholar]
- 27. Camacho L., Meca-Cortés O., Abad J. L., García S., Rubio N., Díaz A., Celiá-Terrassa T., Cingolani F., Bermudo R., Fernández P. L., Blanco J., Delgado A., Casas J., Fabriàs G., and Thomson T. M. (2013) Acid ceramidase as a therapeutic target in metastatic prostate cancer. J. Lipid Res. 54, 1207–1220 [DOI] [PMC free article] [PubMed] [Google Scholar]
- 28. Cheng J. C., Bai A., Beckham T. H., Marrison S. T., Yount C. L., Young K., Lu P., Bartlett A. M., Wu B. X., Keane B. J., Armeson K. E., Marshall D. T., Keane T. E., Smith M. T., Jones E. E., Drake R. R. Jr., Bielawska A., Norris J. S., and Liu X. (2013) Radiation-induced acid ceramidase confers prostate cancer resistance and tumor relapse. J. Clin. Invest. 123, 4344–4358 [DOI] [PMC free article] [PubMed] [Google Scholar]
- 29. Hara S., Nakashima S., Kiyono T., Sawada M., Yoshimura S., Iwama T., Banno Y., Shinoda J., and Sakai N. (2004) p53-Independent ceramide formation in human glioma cells during γ-radiation-induced apoptosis. Cell Death Differ. 11, 853–861 [DOI] [PubMed] [Google Scholar]
- 30. Morales A., París R., Villanueva A., Llacuna L., García-Ruiz C., and Fernández-Checa J. C. (2007) Pharmacological inhibition or small interfering RNA targeting acid ceramidase sensitizes hepatoma cells to chemotherapy and reduces tumor growth in vivo. Oncogene 26, 905–916 [DOI] [PubMed] [Google Scholar]
- 31. Selzner M., Bielawska A., Morse M. A., Rüdiger H. A., Sindram D., Hannun Y. A., and Clavien P. A. (2001) Induction of apoptotic cell death and prevention of tumor growth by ceramide analogues in metastatic human colon cancer. Cancer Res. 61, 1233–1240 [PubMed] [Google Scholar]
- 32. Samsel L., Zaidel G., Drumgoole H. M., Jelovac D., Drachenberg C., Rhee J. G., Brodie A. M., Bielawska A., and Smyth M. J. (2004) The ceramide analog, B13, induces apoptosis in prostate cancer cell lines and inhibits tumor growth in prostate cancer xenografts. Prostate 58, 382–393 [DOI] [PubMed] [Google Scholar]
- 33. Flowers M., Fabriás G., Delgado A., Casas J., Abad J. L., and Cabot M. C. (2012) C6-ceramide and targeted inhibition of acid ceramidase induce synergistic decreases in breast cancer cell growth. Breast Cancer Res. Treat. 133, 447–458 [DOI] [PubMed] [Google Scholar]
- 34. Bedia C., Canals D., Matabosch X., Harrak Y., Casas J., Llebaria A., Delgado A., and Fabriás G. (2008) Cytotoxicity and acid ceramidase inhibitory activity of 2-substituted aminoethanol amides. Chem. Phys. Lipids 156, 33–40 [DOI] [PubMed] [Google Scholar]
- 35. Pizzirani D., Pagliuca C., Realini N., Branduardi D., Bottegoni G., Mor M., Bertozzi F., Scarpelli R., Piomelli D., and Bandiera T. (2013) Discovery of a new class of highly potent inhibitors of acid ceramidase: synthesis and structure-activity relationship (SAR). J. Med. Chem. 56, 3518–3530 [DOI] [PubMed] [Google Scholar]
- 36. León F., Brouard I., Torres F., Quintana J., Rivera A., Estévez F., and Bermejo J. (2008) A new ceramide from Suillus luteus and its cytotoxic activity against human melanoma cells. Chem. Biodivers. 5, 120–125 [DOI] [PubMed] [Google Scholar]
- 37. Raisova M., Bektas M., Wieder T., Daniel P., Eberle J., Orfanos C. E., and Geilen C. C. (2000) Resistance to CD95/Fas-induced and ceramide-mediated apoptosis of human melanoma cells is caused by a defective mitochondrial cytochrome c release. FEBS Lett. 473, 27–32 [DOI] [PubMed] [Google Scholar]
- 38. Han W. S., Yoo J. Y., Youn S. W., Kim D. S., Park K. C., Kim S. Y., and Kim K. H. (2002) Effects of C2-ceramide on the Malme-3M melanoma cell line. J. Dermatol. Sci. 30, 10–19 [DOI] [PubMed] [Google Scholar]
- 39. Halder K., Banerjee S., Bose A., Majumder S., and Majumdar S. (2014) Overexpressed PKCδ downregulates the expression of PKCα in B16F10 melanoma: induction of apoptosis by PKCδ via ceramide generation. PLoS One 9, e91656. [DOI] [PMC free article] [PubMed] [Google Scholar] [Retracted]
- 40. Feng L. X., Li M., Liu Y. J., Yang S. M., and Zhang N. (2014) Synergistic enhancement of cancer therapy using a combination of ceramide and docetaxel. Int. J. Mol. Sci. 15, 4201–4220 [DOI] [PMC free article] [PubMed] [Google Scholar]
- 41. Tran M. A., Smith C. D., Kester M., and Robertson G. P. (2008) Combining nanoliposomal ceramide with sorafenib synergistically inhibits melanoma and breast cancer cell survival to decrease tumor development. Clin. Cancer Res. 14, 3571–3581 [DOI] [PubMed] [Google Scholar]
- 42. Yu T., Li J., and Sun H. (2010) C6 ceramide potentiates curcumin-induced cell death and apoptosis in melanoma cell lines in vitro. Cancer Chemother. Pharmacol. 66, 999–1003 [DOI] [PubMed] [Google Scholar]
- 43. Li F. Z., Dhillon A. S., Anderson R. L., McArthur G., and Ferrao P. T. (2015) Phenotype switching in melanoma: implications for progression and therapy. Front. Oncol. 5, 31. [DOI] [PMC free article] [PubMed] [Google Scholar]
- 44. Hoek K. S., and Goding C. R. (2010) Cancer stem cells versus phenotype-switching in melanoma. Pigment Cell Melanoma Res. 23, 746–759 [DOI] [PubMed] [Google Scholar]
- 45. Kemper K., de Goeje P. L., Peeper D. S., and van Amerongen R. (2014) Phenotype switching: tumor cell plasticity as a resistance mechanism and target for therapy. Cancer Res. 74, 5937–5941 [DOI] [PubMed] [Google Scholar]
- 46. O'Connell M. P., and Weeraratna A. T. (2013) Change is in the air: the hypoxic induction of phenotype switching in melanoma. J. Invest. Dermatol. 133, 2316–2317 [DOI] [PubMed] [Google Scholar]
- 47. Widmer D. S., Eichhoff O. M., Dummer R., and Levesque M. P. (2015) Melanoma's next top model, it is in the air. Exp. Dermatol. 24, 659–660 [DOI] [PubMed] [Google Scholar]
- 48. Hoek K. S., Schlegel N. C., Brafford P., Sucker A., Ugurel S., Kumar R., Weber B. L., Nathanson K. L., Phillips D. J., Herlyn M., Schadendorf D., and Dummer R. (2006) Metastatic potential of melanomas defined by specific gene expression profiles with no BRAF signature. Pigment Cell Res. 19, 290–302 [DOI] [PubMed] [Google Scholar]
- 49. Hoath S. B., and Leahy D. G. (2003) The organization of human epidermis: functional epidermal units and φ proportionality. J. Invest. Dermatol. 121, 1440–1446 [DOI] [PubMed] [Google Scholar]
- 50. Ceol C. J., Houvras Y., Jane-Valbuena J., Bilodeau S., Orlando D. A., Battisti V., Fritsch L., Lin W. M., Hollmann T. J., Ferré F., Bourque C., Burke C. J., Turner L., Uong A., Johnson L. A., Beroukhim R., Mermel C. H., Loda M., Ait-Si-Ali S., Garraway L. A., Young R. A., and Zon L. I. (2011) The histone methyltransferase SETDB1 is recurrently amplified in melanoma and accelerates its onset. Nature 471, 513–517 [DOI] [PMC free article] [PubMed] [Google Scholar]
- 51. Stelzl U., Worm U., Lalowski M., Haenig C., Brembeck F. H., Goehler H., Stroedicke M., Zenkner M., Schoenherr A., Koeppen S., Timm J., Mintzlaff S., Abraham C., Bock N., Kietzmann S., Goedde A., Toksöz E., Droege A., Krobitsch S., Korn B., Birchmeier W., Lehrach H., and Wanker E. E. (2005) A human protein-protein interaction network: a resource for annotating the proteome. Cell 122, 957–968 [DOI] [PubMed] [Google Scholar]
- 52. Gray-Schopfer V., Wellbrock C., and Marais R. (2007) Melanoma biology and new targeted therapy. Nature 445, 851–857 [DOI] [PubMed] [Google Scholar]
- 53. Hartman M. L., and Czyz M. (2015) MITF in melanoma: mechanisms behind its expression and activity. Cell Mol. Life Sci. 72, 1249–1260 [DOI] [PMC free article] [PubMed] [Google Scholar]
- 54. Hoek K. S., Schlegel N. C., Eichhoff O. M., Widmer D. S., Praetorius C., Einarsson S. O., Valgeirsdottir S., Bergsteinsdottir K., Schepsky A., Dummer R., and Steingrimsson E. (2008) Novel MITF targets identified using a two-step DNA microarray strategy. Pigment Cell Melanoma Res. 21, 665–676 [DOI] [PubMed] [Google Scholar]
- 55. Tsao H., Chin L., Garraway L. A., and Fisher D. E. (2012) Melanoma: from mutations to medicine. Genes Dev. 26, 1131–1155 [DOI] [PMC free article] [PubMed] [Google Scholar]
- 56. Trotter S. C., Sroa N., Winkelmann R. R., Olencki T., and Bechtel M. (2013) A global review of melanoma follow-up guidelines. J. Clin. Aesthet. Dermatol. 6, 18–26 [PMC free article] [PubMed] [Google Scholar]
Associated Data
This section collects any data citations, data availability statements, or supplementary materials included in this article.


