Abstract
A large amount of the fission products released by the Fukushima Daiichi Nuclear Power Plant (FDNPP) accident on 11 March 2011 was deposited in a wide area from Tohoku to northern Kanto. A map of the estimated cumulative β-ray dose (70 μm dose equivalent) on the soil surface for one year after the FDNPP accident has been prepared using previously reported calculation methods and the 2-km mesh survey data by MEXT. From this map of estimated dose, areas with a high cumulative β-ray dose on the soil surface for one year after the FDNPP accident were found to be located in the Akogi-Teshichiro to Akogi-Kunugidaira region in Namie Town, and in the southern Futaba Town to the northern Tomioka Town region. The highest estimated cumulative β-ray dose was 710 mSv for one year at Akogi-Teshichiro, Namie Town.
Keywords: Fukushima Daiichi Nuclear Power Plant accident, β-ray dose, radiotellurium, radioiodine, radiocesium
INTRODUCTION
The nuclear accident at the Fukushima Daiichi Nuclear Power Plant (FDNPP) occurred after the enormous earthquake and associated tsunami on 11 March 2011. A large amount of fission products was released and deposited over a wide area from the Tohoku region to the northern Kanto region [1–4]. The deposited radionuclides were mainly 129mTe, 129Te, 131I, 132Te, 132I, 134Cs, 136Cs and 137Cs. These radionuclides emit both γ rays and β rays. Because β rays do not contribute to the effective dose, dose evaluations have been focused on γ rays. However, β rays contribute to the skin dose for humans, the whole-body dose for small insects, and the total dose for plant leaves.
In our previous publication, the time variation in the β-ray dose rate and the cumulative β-ray dose as 70 μm dose equivalent were estimated for the conditions of an initial 137Cs deposition of 1000 kBq/m2, using a Monte Carlo calculation [5]. In the current study, the deposition ratios of 129mTe, 129Te, 131I, 132Te, 132I and 134Cs to 137Cs were taken into account, values for which ratios were mainly taken from the Iitate Village contamination study [5]. For example, the 131I/137Cs ratio was assumed to be 9.2 at the time of deposition [4]. However, the 131I/137Cs ratio has a range of values for the various areas between the northwestern region and the southern region of the FDNPP [1, 2].
In addition, the Ministry of Education, Culture, Sports, Science and Technology (MEXT) conducted a 2-km mesh contamination study from June to August 2011 [6]. This study started three months after the main deposition occurred on 15 March 2011. Therefore, the short-half-life radionuclides, such as 132I and 132Te (half-life: 3.204 days), had already decayed out. 131I was also decayed by a factor of 2000 due to its short half-life (8.021 days). In the MEXT study, 131I radioactivity was detected in only 19% of 2181 soil sampling locations. Consequently, the 131I/137Cs ratio is available for only 415 locations in the Fukushima prefecture.
The purpose of this paper was to evaluate the cumulative β-ray dose (70 μm dose equivalent) for one year after the FDNPP accident on the ground surface and to create a β-ray dose map of contaminated areas in the Fukushima prefecture, using our previous β-ray calculation method [5] coupled with the MEXT 2-km mesh soil data [6].
MATERIALS AND METHODS
Calculation technique for the cumulative soil surface β-ray dose for one year
A previously published β-ray dose calculation technique [5, 7, 8] was used in this study. The transport of β-rays was simulated with Monte Carlo N-Particle transport code version 4C (MCNP-4C) [9]. Beta-ray sources were uniformly distributed in a surface soil layer of 5-mm thickness. Beta-ray energy spectra were used for the radionuclides: 129mTe, 129Te, 131I, 132Te, 132I, 134Cs and 137Cs [5]. Energy deposition in the air cell is accumulated as a function of height from the soil surface. The initial β-ray dose rate for each of seven radionuclides was calculated. Then, seven values of β-ray dose rates for the radionuclide i at the time of deposition () were combined according to the deposition ratio with that of 137Cs: fi, where fi is the radionuclide ratio: 129mTe/137Cs, 129Te/137Cs, 131I/137Cs, 132Te/137Cs, 132I/137Cs, 134Cs/137Cs and 137Cs/137Cs. In order to estimate the time variation, each β-ray dose rate component was reduced by the time after deposition according to each half-life time. The cumulative β-ray dose for one year was calculated by integration of the time after deposition. In the previous publication, the fi was assumed to be 1: 0.7: 9.2: 8.3: 8.3: 1: 1, where i means 129mTe, 129Te, 131I, 132Te, 132I, 134Cs and 137Cs [5]. In our study, in the calculation process for the cumulative β-ray dose, radionuclide ratios of 131I/137Cs and 129mI/137Cs were treated as two parameters of: rI and rT, respectively. Also, 129Te/137Cs and 132I/137Cs ratios were scaled to the 129mTe/137Cs ratio by factors of 0.7 and 8.3, respectively. Therefore, a relation of 129Te/137Cs = 0.7 x 129mTe/137Cs and 132I/137Cs = 8.3 x 129mTe/137Cs were used here, respectively. Consequently, the deposition ratio of fi was set to rT: (0.7·rT): rI : (8.3·rT): (8.3·rT): 1: 1. The β-ray dose rate () and the cumulative β-ray dose on the ground surface for one year (DA) are under conditions of an initial deposition density of 137Cs. The cumulative dose of D(rI , rT) for one year at unit deposition of 137Cs (kBq/m2) can be written as follows:
| Eq. 1 |
| Eq. 2 |
where Ti is the half-life of radionuclide i, and rI and rT are 131I/137Cs and 131I/137Cs ratios, respectively. After this calculation, the relationships between the cumulative soil surface β-ray dose for one year and conditions of deposition density of 137Cs were determined. The cumulative soil surface β-ray dose for one year (DA) was calculated by:
| Eq. 3 |
where is the 137Cs deposition density (kBq/m2) taken from the MEXT 2-km mesh soil contamination data [6]. The dose conversion factor from Gy to Sv for β-rays was assumed to be 1 in this analysis.
129mTe/137Cs ratio interpolation
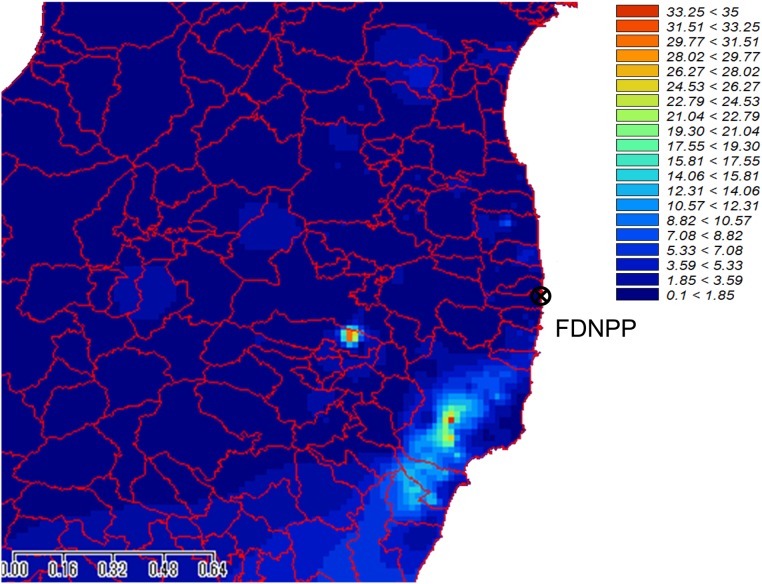
The 129mTe/137Cs ratio was obtained from the MEXT data (which includes 2181 sampling locations) at 797 locations. However, both ratios of 129mTe/137Cs and 131I/137Cs were obtained at only 175 locations. At the locations without 129mTe/137Cs data, 129mTe/137Cs data were interpolated with geographic information techniques (GIS): a multilevel B spline interpolation by SAGA-GIS [10]. The resultant 129mTe/137Cs map is shown in Fig. 1.
Fig. 1.
Map of 129mTe/137Cs ratio of the MEXT data [6] interpolated with a multilevel B spline interpolation by SAGA-GIS [10].
RESULTS AND DISCUSSION
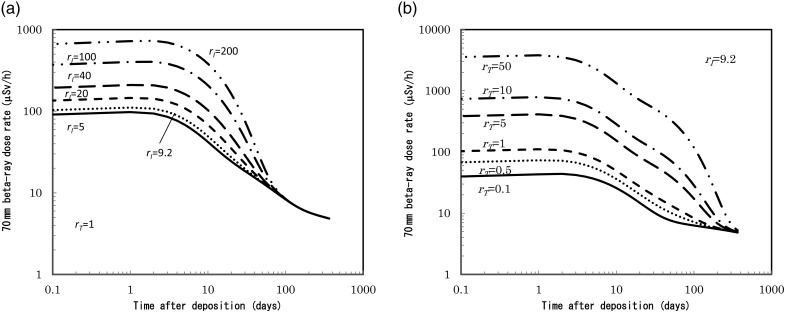
The time dependence of the β-ray dose (70-μm dose equivalent) rate on the ground surface is shown in Fig. 2a for a fixed value of rT = 1.0, with parameter values of rI = 5, 9.2, 20, 40, 100 and 200. The 131I contribution diminishes about 80 days after deposition due to the decay from Fig. 2a. Figure 2b shows the time dependence of the β-ray dose rate for a fixed rI of 9.2 with various rT of 0.1, 0.5, 1, 5, 10 and 50. In case of rT being >5, small increases in the β-ray dose appear from 20 days. This increase is caused by the contribution of β-rays from 129,129mTe nuclides, which have a half-life of 33.6 days. For detailed calculation methods, please refer to the previous publication [5].
Fig. 2.
Beta-ray dose rate, μSv h-1, on soil surface as a function of time after deposition for variable 131I/137Cs and 129mTe/137Cs. (a) 129mTe/137Cs = 1 with 131I/137Cs = 5, 9.2, 20, 40, 100 and 200. (b) 131I/137Cs = 9.2 with 129mTe/137Cs = 0.1, 0.5, 1, 5, 10 and 50.
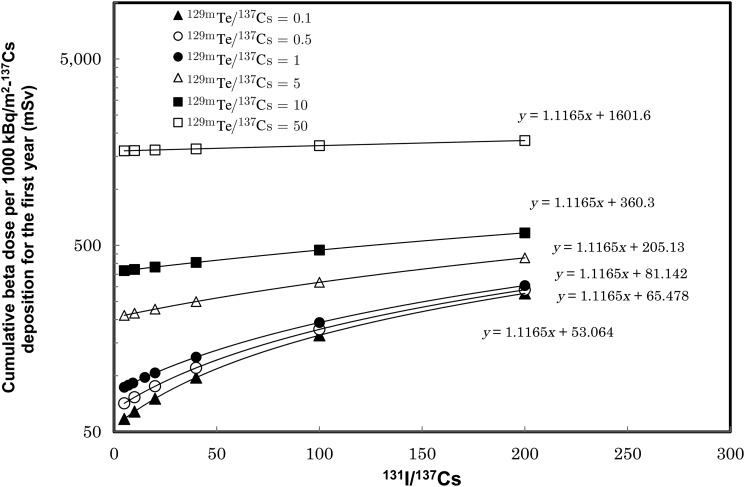
The cumulative β-ray dose on the ground surface can be obtained by integrating the time-dependent dose rate as Eq. 2. Results of cumulative β-ray dose calculation for various sets of rI and rT values are plotted in Fig. 3, respectively. The cumulative dose per 137Cs deposition of 1000 kBq/m2 is increasing with the 131I/137Cs ratio. The least square fitted function was determined to be D(rI, rT) = 1.1165 rI + b, as shown in Fig. 3. The fitted parameter values of b for several values of rT are listed in Table 1. The fitted parameter: b was re-fitted by linear function and determined to be b(rT) = 31.032 rT + 50.009. The fitted result is shown in Fig. 4. Finally, the cumulative β-ray dose on the ground surface per initial137Cs deposition for one year, D(rI, rT), can be expressed as a function of rI and rT as:
| Eq. 4 |
The cumulative soil surface β-ray dose for one year was calculated for 415 MEXT sampling locations using Eq. 4. The representative 72 locations selected from 415 locations are listed in Table 2. The calculated results show that higher cumulative β-ray doses appear around the Akogi region in Namie Town and from Futaba Town to northern Tomioka Town. The values for cumulative soil surface β-ray dose were estimated to be 710 mSv at Namie-Akogi-Teshichiro, 477 mSv at Namie-Akogi-Kunugidaira, 246 mSv at Futaba-Ishiguma and 620 mSv at Tomioka-Osuge. Also, the southern Iitate Village had a relatively high cumulative β-ray dose of 100–150 mSv. In Fukushima City, the cumulative soil surface β-ray dose around the eastern region was estimated to be 20–60 mSv higher than that around the western region (4–10 mSv). On the other hand, areas with a high 131I/137Cs ratio of 69 ± 39 (maximum: 285) around Iwaki City showed a relatively low deposition density of 137Cs of 20–50 kBq/m2; thus, the cumulative β-ray dose showed slightly lower values: ∼1–24 mSv.
Fig. 3.
Cumulative β-ray dose per 137Cs deposition of 1000 kBq/m2 for the first year as a function of 131I/137Cs and 129mTe/137Cs ratio.
Table 1.
Fitted parameter b for 132I/137Cs of 0.1, 0.5, 1, 5, 10 and 50
| 132I/137Cs | Parameter b |
|---|---|
| 0.1 | 53.064 |
| 0.5 | 65.478 |
| 1 | 81.142 |
| 5 | 205.13 |
| 10 | 360.3 |
| 50 | 1601.6 |
Fig. 4.
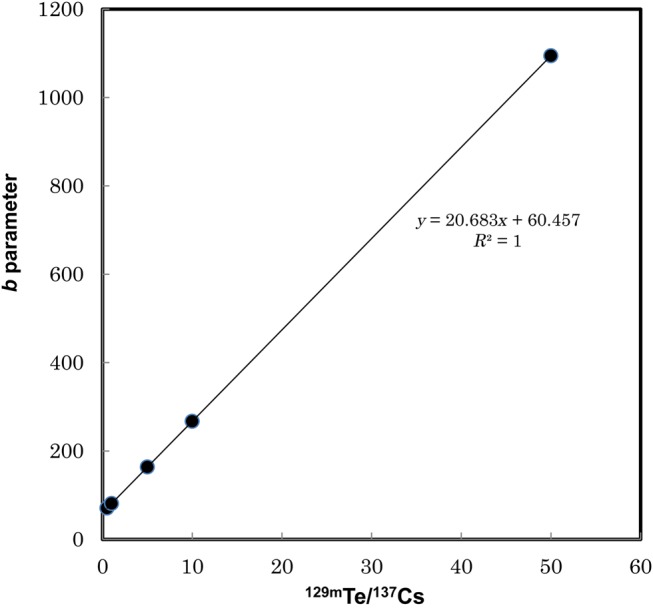
Fitted parameter b as a function of 132I/137Cs ratio.
Table 2.
Cumulative soil surface β-ray dose for one year at representative 72 locations selected from the calculated results of 415 locations using the 2-km mesh soil deposition density (kBq/m2) by MEXT [6]
| Location | Longitude | Latitude | 131I | 137Cs | 129mTe | 131I/137Cs | 129mTe/137Cs | D(rI,rT) (mSv) | DA (mSv) |
|---|---|---|---|---|---|---|---|---|---|
| Iwaki City, Hisanohama | 37.17292 | 140.9993 | 0.6 | 59 | 26.5 | 3.8 | 199 | 11.7 | |
| Iwaki City, Yamada | 36.92822 | 140.7411 | 0.86 | 44 | 88 | 50.9 | 11.5 | 465 | 20.4 |
| Iwaki City, Yotsukura | 37.10747 | 140.9664 | 0.76 | 35 | 8.8 | 56.5 | 2.3 | 187 | 6.6 |
| Iwaki City, Taira | 37.03022 | 140.9233 | 0.82 | 26 | 6.9 | 82.1 | 1.7 | 199 | 5.2 |
| Otama Village | 37.54375 | 140.332 | 0.41 | 130 | 16 | 8.2 | 1.1 | 92.5 | 12.0 |
| Kuwaori Town, Yachi | 37.86128 | 140.5363 | 0.32 | 83 | 18 | 10.0 | 1.3 | 103 | 8.5 |
| Kuwaori Town, Kamikori | 37.84794 | 140.5284 | 1 | 200 | 36 | 13.0 | 1.3 | 105 | 20.9 |
| Kunimi Town, Okido | 37.89039 | 140.5723 | 0.69 | 110 | 18 | 16.3 | 1.1 | 103 | 11.3 |
| Kawamata Town, Yamakiya | 37.583 | 140.7186 | 3.6 | 870 | 190 | 10.8 | 1.3 | 104 | 90.0 |
| Kawamata Town, Akiyama | 37.69419 | 140.5603 | 0.25 | 51 | 11 | 12.8 | 1.3 | 105 | 5.4 |
| Kawamata Town, Kotsunagai | 37.63153 | 140.6581 | 0.46 | 81 | 22 | 14.8 | 1.4 | 111 | 9.0 |
| Date City, Ryozan | 37.784 | 140.6704 | 0.15 | 49 | 8.0 | 1.5 | 105 | 5.1 | |
| Date City, Yanagawa | 37.85194 | 140.5667 | 0.84 | 180 | 35 | 12.1 | 1.2 | 101 | 18.2 |
| Date City, Miyoda | 37.74461 | 140.6127 | 1.7 | 320 | 52 | 13.8 | 1.2 | 104 | 33.2 |
| Aizuwakamatsu City, Oto | 37.37189 | 139.9251 | 0.49 | 4.5 | 283 | 1.3 | 421 | 1.9 | |
| Kagamiishi Town | 37.25781 | 140.3391 | 0.25 | 76 | 8.6 | 1.6 | 110 | 8.3 | |
| Tenei Village | 37.22039 | 140.2581 | 0.35 | 140 | 21 | 6.5 | 1.0 | 89.8 | 12.6 |
| Koriyama City, Hiwada | 37.45531 | 140.3889 | 0.12 | 170 | 5.3 | 1.8 | 0.7 | 75.3 | 12.8 |
| Koriyama City, Narukami | 37.39411 | 140.3381 | 0.49 | 230 | 5.5 | 1.0 | 87.2 | 20.1 | |
| Sukagawa City, Moriya | 37.33333 | 140.2456 | 0.089 | 200 | 1.2 | 1.4 | 94.2 | 18.8 | |
| Sukagawa City, HokotsukiFurudate | 37.26972 | 140.2694 | 0.6 | 130 | 20 | 12.0 | 1.0 | 95.3 | 12.4 |
| Saigo Village | 37.17011 | 140.2939 | 0.45 | 44 | 7.7 | 26.6 | 1.2 | 118 | 5.2 |
| Kodono Town | 37.07803 | 140.5705 | 0.04 | 33 | 0.82 | 3.2 | 0.4 | 66.5 | 2.2 |
| Hirata Village | 37.23067 | 140.5666 | 0.35 | 8.1 | 112 | 1.5 | 228 | 1.8 | |
| Katsurao Village, Ochiai-Karogawa | 37.48575 | 140.8077 | 0.68 | 160 | 11.1 | 1.2 | 100 | 16.0 | |
| Katsurao Village, Katsurao | 37.53778 | 140.7802 | 7.3 | 1600 | 11.9 | 1.2 | 102 | 163 | |
| Hirono Town, Oriki | 37.19908 | 141.0019 | 2.1 | 250 | 21.9 | 4.5 | 215 | 53.7 | |
| Hirono Town, Yusuji | 37.18967 | 140.9977 | 1.3 | 55 | 42 | 61.5 | 4.4 | 257 | 14.1 |
| Kawauchi Village, Shimokawauchi | 37.27697 | 140.8097 | 0.7 | 480 | 64 | 3.8 | 0.9 | 81.2 | 39.0 |
| Kawauchi Village, Kamikawauchi | 37.30375 | 140.7622 | 0.15 | 52 | 1.8 | 7.5 | 0.3 | 69.5 | 3.6 |
| Futaba Town, Ishikuma | 37.43553 | 140.954 | 31 | 1700 | 320 | 47.4 | 1.3 | 145 | 246 |
| Okuma Town, Kumakawa | 37.39225 | 141.0124 | 32 | 1700 | 250 | 49.0 | 1.1 | 141 | 240 |
| Naraha Town, Yamadaoka | 37.24358 | 140.9665 | 3.2 | 130 | 64.0 | 3.0 | 217 | 28.1 | |
| Naraha Town, Shimokobana | 37.25817 | 140.9692 | 5.7 | 130 | 47 | 114 | 2.5 | 261 | 33.9 |
| Tomioka Town, Osuge | 37.37439 | 141.0081 | 55 | 5000 | 1100 | 28.6 | 1.3 | 124 | 620 |
| Tomioka Town, Motooka | 37.34036 | 140.9807 | 26 | 530 | 93 | 128 | 1.5 | 245 | 130 |
| Namie Town, Minamitsushima | 37.55683 | 140.7897 | 4.4 | 2100 | 5.5 | 1.1 | 90.4 | 190 | |
| Namie Town, Akogi-Teshichiro | 37.59606 | 140.7541 | 17 | 7900 | 920 | 5.6 | 1.1 | 89.9 | 710 |
| Namie Town, Akogi-Hirusone | 37.54186 | 140.8622 | 2.8 | 1300 | 220 | 5.6 | 1.1 | 91.5 | 119 |
| Namie Town, Akogi-Kunugidaira | 37.56053 | 140.8238 | 19 | 5700 | 450 | 8.7 | 0.8 | 83.6 | 477 |
| Namie Town, Akougi-Shiobite | 37.56683 | 140.8021 | 10 | 2500 | 10.4 | 1.0 | 91.8 | 230 | |
| Shinchi Town | 37.85694 | 140.8808 | 0.65 | 45 | 9.2 | 37.6 | 1.2 | 130 | 5.9 |
| Iitate Village, Komiya | 37.62881 | 140.7731 | 3.2 | 1300 | 190 | 6.4 | 1.1 | 92.4 | 120 |
| Iitate Village, Warabidaira | 37.62539 | 140.8105 | 3.7 | 1400 | 6.9 | 1.5 | 103 | 144.4 | |
| Iitate Village, Okura | 37.72678 | 140.8348 | 0.49 | 140 | 29 | 9.1 | 1.3 | 102 | 14.2 |
| Iitate Village, Notegami | 37.63806 | 140.7982 | 5.3 | 1500 | 9.2 | 1.3 | 103 | 154 | |
| Iitate Village, Matsuzuka | 37.68981 | 140.7201 | 3.6 | 1000 | 9.4 | 1.1 | 94.5 | 94.5 | |
| Iitate Village, Kusano | 37.71753 | 140.7633 | 1.2 | 300 | 10.4 | 1.4 | 106 | 31.6 | |
| Iitate Village, Iitoi | 37.66136 | 140.6972 | 1.5 | 280 | 13.9 | 1.0 | 97.6 | 27.3 | |
| Soma City, Nokikitahara | 37.84108 | 140.8961 | 0.064 | 52 | 8.8 | 3.2 | 1.1 | 87.8 | 4.6 |
| Soma City, Otsubo-Maenosawa | 37.82283 | 140.8953 | 0.2 | 55 | 11 | 9.5 | 1.1 | 95.3 | 5.2 |
| Soma City, Hatsuno-Nishihara | 37.82603 | 140.8707 | 0.23 | 27 | 3.3 | 22.2 | 0.9 | 104 | 2.8 |
| Miharu Town, Nanakusagi | 37.475 | 140.4906 | 0.56 | 100 | 22 | 14.6 | 0.9 | 94.1 | 9.4 |
| Miharu Town, Omachi | 37.44297 | 140.4891 | 0.48 | 64 | 12 | 19.5 | 1.1 | 106 | 6.8 |
| Ono Town | 37.30439 | 140.6186 | 0.11 | 23 | 3.5 | 12.4 | 0.7 | 87.4 | 2.0 |
| Tanura City, Miyakoji | 37.45814 | 140.7183 | 0.24 | 160 | 16 | 3.9 | 0.8 | 79.8 | 12.8 |
| Tanura City, Funehiki | 37.51436 | 140.6562 | 0.68 | 88 | 20.1 | 1.2 | 109 | 9.6 | |
| Samekawa Village | 37.07261 | 140.4606 | 0.14 | 19 | 2.7 | 19.2 | 0.9 | 99.6 | 1.9 |
| Tanakura Town | 37.01122 | 140.3368 | 0.22 | 76 | 2.8 | 7.5 | 0.8 | 82.8 | 6.3 |
| Minami-Soma City, Takanokura | 37.62867 | 140.8983 | 0.77 | 250 | 8.0 | 2.4 | 133 | 33.3 | |
| Minami-Soma City, Haramachi | 37.62383 | 140.9612 | 0.42 | 100 | 25 | 10.9 | 1.4 | 105 | 10.5 |
| Minami-Soma City, Karasuzaki | 37.68547 | 141.0106 | 0.15 | 6.8 | 57.4 | 1.4 | 160 | 1.1 | |
| Nihonmatsu City, Kawasaki | 37.61136 | 140.4875 | 0.63 | 270 | 6.1 | 1.0 | 88.3 | 23.8 | |
| Nihonmatsu City, Hatsumori | 37.52533 | 140.5335 | 0.7 | 180 | 32 | 10.1 | 1.1 | 96.2 | 17.3 |
| Nihonmatsu City, Babadaira | 37.57969 | 140.3518 | 0.26 | 56 | 12.1 | 1.4 | 107 | 6.0 | |
| Nihonmatsu City, Dake-Onsen | 37.60419 | 140.3556 | 0.28 | 29 | 8.7 | 25.1 | 1.7 | 131 | 3.8 |
| Fukushima City, Arai | 37.71081 | 140.3873 | 0.18 | 39 | 12.0 | 1.2 | 100 | 3.9 | |
| Fukushima City, Watari | 37.72 | 140.4994 | 1.7 | 400 | 11.1 | 1.4 | 106 | 42.5 | |
| Fukushima City, Onami | 37.757083 | 140.55381 | 2.9 | 570 | 110 | 13.2 | 1.4 | 108 | 61.3 |
| Fukushima City, Matsukawacho | 37.68006 | 140.3562 | 0.41 | 67 | 15.9 | 1.2 | 105 | 7.0 | |
| Motomiya City, Motomiya | 37.52286 | 140.4116 | 0.12 | 92 | 6.5 | 3.4 | 0.8 | 78.3 | 7.2 |
| Motomiya City, Arai | 37.48628 | 140.3833 | 0.33 | 24 | 6.6 | 35.8 | 1.3 | 131 | 3.2 |
The ratios decay-corrected to 15 March 2011. The 129mTe/137Cs ratios interpolated with a multilevel B spline by SAGA-GIS [10] are listed.
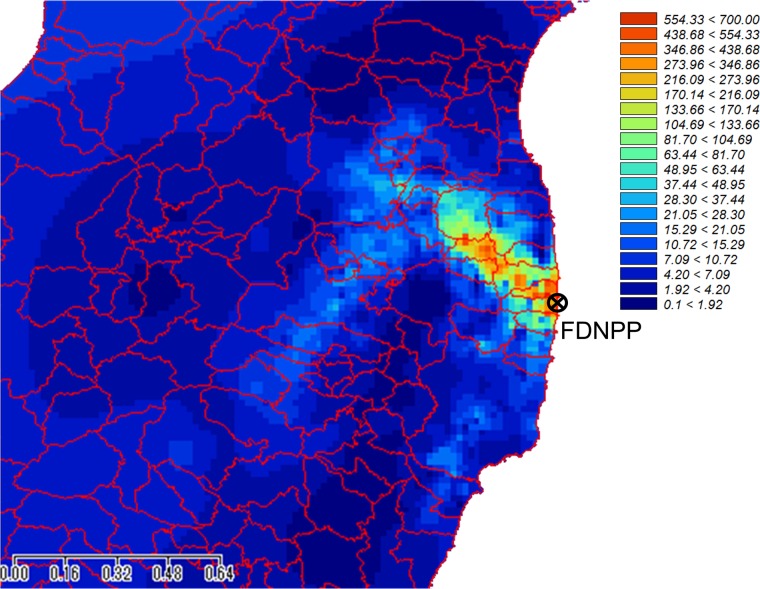
The map of the estimated cumulative soil surface β-ray dose is shown in Fig. 5, edited by interpolating the results with the multilevel B spline interpolation using SAGA-GIS [10]. Three higher cumulative β-ray dose regions can be clearly seen in the Akogi-Teshichiro and Akogi-Kunugidaira regions in Namie Town, and also from Futaba Town to northern Tomioka Town. Compared with the cumulative γ-ray dose map produced by MEXT [11], the β-ray dose is slightly larger than the γ-ray dose around Iwaki City. This is due to the 129m,129Te contributions, which have longer half-lives (33.6 days) than 131I (8.021 days) and higher β-ray emission rates of ∼90% compared with the γ-ray emission rates (<10%).
Fig. 5.
Map of the cumulative β-ray dose (mSv) on ground surface in the first year after deposition.
As already stated in the Introduction, our estimation used the 70-μm dose equivalent as the skin dose for humans. These estimates are based on the assumption that people stay outside houses or buildings continuously for a year. Therefore, this skin dose is not strictly accurate for humans; however, the doses are fairly accurate for organisms living in the outside environment, such as small insects, plant leaves, etc.
CONCLUSION
The cumulative soil surface β-ray dose was calculated using the 2-km mesh soil contamination data by MEXT and our previously published β-ray dose calculation technique. From that, an estimated cumulative soil surface β-ray dose map was produced. As a result of this map, areas estimated to have a higher cumulative β-ray dose on the soil surface for the first year after the FDNPP accident were found to be located in the Akogi-Teshichiro to Akogi-Kunugidaira region in Namie Town and from Futaba Town to northern Tomioka Town. The highest estimated cumulative β-ray dose was 710 mSv for one year at Akogi-Teshichiro, Namie Town.
FUNDING
This study was supported by Grant-in-Aid for Challenging Exploratory Research No. 26550031 from the Japan Society for the Promotion of Science (JSPS). Funding to pay the Open Access publication charges for this special issue was provided by the Grant-in-Aid from the Japan Society for the Promotion of Science (JSPS) [KAKENHI Grant No. 26253022].
Acknowledgements
The authors are grateful to Prof. Shizuma, Hiroshima University, for discussions about the data analysis.
REFERENCES
- 1.Endo S, Kimura S, Takatsuji T, et al. Measurement of soil contamination by radionuclides due to Fukushima Dai-ichi Nuclear Power Plant accident and associated cumulative external dose estimation. J Environ Radioact 2012;111:18–27. [DOI] [PubMed] [Google Scholar]
- 2.Yamamoto M, Takada T, Nagao S, et al. Early survey of radioactive contamination in soil due to the Fukushima Dai-ichi Nuclear Power Plant accident: with emphasis on Pu analysis, Geolochem J 2012;46:341–53. [Google Scholar]
- 3.Institute De Radioprotection Et De Surete Nuclaire (IRSN). Fukushima, One Year Later. Initial Analyses of the Accident and its Consequences. Report IRSN/DG/2012-003, 12 March 2012.
- 4.Imanaka T, Endo S, Sugai M, et al. Early radiation survey of the Iitate Village heavily contaminated by the Fukushima Daiichi accident, conducted on March 28th and 29th, 2011. Health Phys 2012;102:680–6. [DOI] [PubMed] [Google Scholar]
- 5.Endo S, Tanaka K, Kajimoto T, et al. Estimation of β-ray dose in air and soil from Fukushima Daiichi Power Plant accident. J Radiat Res 2014;55:476–83. [DOI] [PMC free article] [PubMed] [Google Scholar]
- 6.Minister of Education, Culture, Sports, Science and Technology (MEXT). Map of Radiocesium in Soil, 2011. http://www.mext.go.jp/b_menu/shingi/chousa/gijyutu/017/shiryo/_icsFiles/afieldfile/2011/09/02/1310688_2.pdf (29 August 2011, date last accessed).
- 7.Tanaka K, Endo S, Imanaka T, et al. Skin dose from neutron-activated soil for early entrants following the A-bomb detonation in Hiroshima: contribution from β and γ rays. Radiat Environ Biophys 2008;47:323–30. [DOI] [PubMed] [Google Scholar]
- 8.Endo S, Tanaka K, Shizuma K, et al. Estimation of beta-ray skin dose from exposure to fission fallout from the Hiroshima atomic bomb. Radiat Prot Dos 2012;149:84–902. [DOI] [PubMed] [Google Scholar]
- 9.Transport Methods Group in Los Alamos National Laboratory. TSICC Computer Code Collection MCNP4B Monte Carlo N-Particle Transport Code System CCC-660, 1997. [Google Scholar]
- 10.Cimmery V. SAGA User Guide, Updated for SAGA Version 2.0.5, 2007–2010. http://www.saga-gis.org/en/index.html. [Google Scholar]
- 11.Minister of Education, Culture, Sports, Science and Technology (MEXT). Distribution Map of Radiation Dose Around Fukushima Dai-ichi & Dai-Ni NPP (as of April 24, 2011). Monitoring Information of Environmental Radioactivity Level. http://radioactivity.nsr.go.jp/en/contents/5000/4160/view.html. [Google Scholar]


