

Abstract
Objective
Vitamin D modulates the immune response and blocks induction of an interferon signature by SLE sera. We investigated the effects of vitamin D supplementation on the IFN signature in SLE patients.
Methods
57 SLE patients with stable, inactive disease, a serum 25OH vitamin D (25OHD) ≤20ng/ml, elevated anti-DNA antibodies and an IFN signature (determined by measurement of 3 interferon responsive genes) were randomized into a 12 week double-blind placebo controlled trial of 0, 2000IU or 4000IU of vitamin D3. An IFN signature response required a 50% reduction in expression of 1 gene or a 25% decrease in 2 genes. Disease activity, adverse events and endocrine effects were assessed.
Results
Baseline characteristics of the 3 treatment groups were similar. No subjects receiving placebo repleted (achieved 25OHD levels ≥30ng/ml) compared to 16 of 33 subjects receiving vitamin D3. The percent of subjects achieving an IFN signature response did not differ between treatment groups. Moreover, there was no difference in the IFN signature response in vitamin D deficient versus repleted subjects. Modular microarray analysis of a subset (n=40) revealed no changes in any modules including the IFN-inducible module between any treatment group, nor when comparing expression data from vitamin D repleted to persistently deficient subjects. Vitamin D3 was well-tolerated with no safety concerns.
Conclusions
Vitamin D3 supplementation up to 4000IU daily was safe and well-tolerated but failed to diminish the IFN signature in vitamin D deficient SLE patients. Higher 25OHD levels sustained for longer duration may be required to affect immunological outcomes.
Keywords: Vitamin D3, SLE, interferon signature
Vitamin D is enzymatically converted to the hormone, 1,25-dihydroxyvitamin D (1,25(OH)2D), which has known effects on calcium and bone homeostasis. The presence of the vitamin D receptor on immune cells, including B cells, T cells and antigen presenting cells, has prompted investigations of potential immunologic functions of vitamin D. These immune cells express the enzymes required to convert vitamin D into its biologically active form, 1,25(OH)2D, acting in a paracrine or autocrine manner in the local immunologic milieu (1). In vitro, vitamin D modulates innate and adaptive immune responses, blocks B cell proliferation and differentiation, and suppresses immunoglobulin production (2-5). Additionally, it decreases T cell proliferation and shifts maturing T cells away from Th1 or Th17 phenotypes towards Th2 and Treg phenotypes (6). It may additionally attenuate expression of inflammatory cytokines induced by stimulation of TLRs 3,4, and 7/8 (7).
Vitamin D also limits the differentiation and maturation of dendritic cells (DCs) (8). This observation is important in the context of autoimmunity because immature DCs maintain tolerance while mature DCs can present self-antigens in an immunogenic fashion. Serum from patients with systemic lupus erythematosus (SLE) promotes DC maturation, presumably due to immune complex activation of toll like receptors and excessive interferon (IFN)α activity (9). The “IFN signature” ie the overexpression of IFN inducible genes, is observed in approximately 50% of SLE patients and is more frequently detected in patients with active disease (10-13). Previous studies have demonstrated an increased expression of IFN inducible genes in polymorphonuclear cells) derived from vitamin D deficient lupus patients (25-hydroxyvitamin D (25(OH)D)<20 ng/ml) compared to patients with normal levels of vitamin D (25(OH)D ≥ 30 ng/ml) (4) and a negative correlation between 25(OH)D levels and both plasma and gene expression of IFNα (14). Additionally, the transfer of the IFN signature is attenuated by vitamin D (15). We hypothesized that vitamin D deficiency in SLE patients contributes to the perpetuation of disease, and the sustained presence of the overexpression of IFN inducible genes. Open-label pilot studies demonstrated that vitamin D supplementation reduced the IFN signature in 3 patients with SLE (4). We therefore prospectively evaluated the effects of two doses of vitamin D supplementation upon the IFN signature in stable, vitamin D deficient, SLE patients in a double-blinded randomized placebo-controlled clinical trial.
Study design
The objective of this study was to determine if vitamin D3 supplementation reduces the expression of IFNα inducible genes in SLE, leading to an “IFN signature response” in vitamin D deficient, clinically stable SLE patients who possess an IFN signature. For this study, the IFN signature was defined by the levels of three IFNα inducible genes: M×1 (myxovirus resistance 1; Hs00182073 m1), Ifit1 (interferon induced protein with tetricopeptide repeats 1; Hs01675197 m1) and Ifi44 (interferon induced protein 44; Hs00197427m1). The “IFN signature response” was defined as either a ≥50% reduction in the baseline expression of one of these three genes or a ≥25% reduction in the expression of two of the three genes with expression of the remaining gene(s) increasing by no more than 25%.
This was a multicenter, randomized, double-blind, placebo-controlled phase II study (ClinicalTrials.gov Identifier NCT00710021). The first 2 authors designed the trial in collaboration with the clinical development team at NIAID and Rho Inc. which managed data collection and quality control and performed the statistical analyses. The NIAID Autoimmune DSMB provided study oversite. Eligible subjects were randomized 1:1:1 to receive placebo, 2000IU (low dose), or 4000IU (high dose) of oral vitamin D3 daily for 12 weeks. Gene expression, vitamin D levels and urinary calcium/creatinine ratios were measured at baseline, Weeks 6 and 12. Parathyroid hormone (PTH) was measured at baseline and Week 12. Disease activity was assessed at each visit using the SELENA-SLE Disease Activity Index (SELENA-SLEDAI), modified to allow use of a spot urine protein/creatinine ratio for estimation of proteinuria, and the British Isles Lupus Assessment Group (BILAG) index. Adverse events were assessed throughout the study.
Objectives
The primary objective was to explore the impact of vitamin D3 supplementation on the expression of IFNα inducible genes, specifically, whether supplementation would induce an IFN signature response. Analyses also evaluated potential associations between 25(OH)D levels and the IFN signature response. Additional relationships between 25(OH)D levels and secondary gene-expression endpoints, the presence of an IFN signature and changes in expression of individual IFN inducible genes and treatment group were explored.
Secondary objectives included evaluating the effects of vitamin D3 on disease activity, complement levels and anti-dsDNA levels, and determining safety and tolerability associated with vitamin D3 supplementation.
Entry criteria
Subjects meeting 1997 ACR Classification Criteria for SLE aged ≥ 18 years with a serum 25(OH)D ≤ 20 ng/ml were recruited for this study. Presence of an IFN signature was required, defined either as the expression of one of three IFNα inducible genes (M×1, Ifit1 or Ifi44) at a level ≥ 4 standard deviations (SD) above the mean of normal controls, or the expression of 2 of these 3 genes greater than 2 SD above the mean of normal controls. Patients were required to have stable inactive disease with a SELENA-SLEDAI ≤ 4 and could not have a BILAG A or B score in any organ system with the exception of the mucocutaneous system where BILAG B was allowed. Other inclusion criteria included anti-dsDNA positivity and stable background immunosuppressive medications; the prednisone dose could not be ≥ 20mg/day.
Subjects were excluded if they had received a vitamin D supplement greater than 800 IU daily within 3 months prior to screening. Subjects with hypercalcemia (serum calcium > 10.4 mg/dl), hypercalciuria (urinary calcium/creatinine ratio ≥ 0.8), a history of renal stones or hyperparathyroidism at screening were excluded. Additional pertinent exclusion criteria included: unwillingness to halt the use of agents that interfere with fat absorption, history of chronic viral infections, active tuberculosis, ALT or AST ≥ 2× upper limit of normal, dialysis or a creatinine > 1.5 mg/dl, treatment with a biologic agent or with cyclophosphamide within 3 months prior to screening, treatment with rituximab within 12 months prior to screening, pregnancy, lactation, treatment with digoxin, or treatment with teriparatide (Forteo™).
Approval for this study was obtained at the Institutional Review Board of each clinical site and informed consent was obtained from all study participants prior to study screening.
Laboratory assessments
Clinical laboratory assessments including screening 25(OH)D assays to determine study eligibility were performed by local laboratories at each study site. Measurements of 25(OH)D and PTH for all randomized subjects were determined centrally at the Hollis laboratory at the Medical University of South Carolina. Serum 25(OH)D was measured using a radioimmunoassay (DiaSorin, Stillwater, Minnesota) as previously described (16). PTH concentrations were measured by immunoradiometric assay (DiaSorin). Expression of M×1, Ifit1, and Ifi44 genes and HPRT (a housekeeping gene) were determined on whole blood collected using Pax gene tubes, using RT-PCR (TaqMan assay) at the Diamond laboratory at Feinstein Institute for Medical Research. Expression of each IFNα inducible gene was computed relative to that gene's average expression in a set of 20 normal controls with no family history of autoimmune disease, using the comparative threshold cycle method (17).
Gene expression was additionally determined in a post-hoc analysis on a subset of 40 randomly selected study participants and a control group of 23 normal individuals of similar age and demographic features using a modular microarray analysis (18). The 28 immune related gene expression modules include an IFN module, as well as plasma cell, myeloid lineage and inflammation modules. We used an Illumina HT12v4 platform. The original modules were determined on an Affymetrix platform, and hence Affymetrix probes were mapped to Illumina probes via their corresponding Entrez gene IDs.
Sample size and statistical analysis
Sample size calculations were based on the assumptions of a 70% IFN signature response in the groups receiving vitamin D3 and a response no greater than 25% in the placebo group. Accordingly, a sample size of 17 in each treatment group was estimated to give 80% power to detect a significant difference between groups receiving placebo and those receiving vitamin D3. The sample size was increased to 19 subjects per arm to account for potential loss of subjects.
Fisher's Exact statistics or Cochran-Mantel-Haenzsel (CMH) statistics were used to compare categorical outcomes among treatment groups. Pearson's χ2 statistics were used to evaluate relationships between 25(OH)D repletion status and categorical outcomes or baseline characteristics. Analysis of variance (ANOVA) or analysis of covariance (ANCOVA) models were used for continuous outcomes. Pearson's partial correlation coefficient was used to examine the relationship between 25(OH)D and PTH levels.
To examine changes in relative gene expression from baseline to Week 12 for each IFNα inducible gene, log2 of the ratio of expression of each gene at Week 12 to baseline was calculated for each subject. A positive value equals the number of times gene expression doubled in 12 weeks, while negative values equal the number of times expression was halved. ANOVA or ANCOVA models were used to evaluate the relationships between changes in gene expression and vitamin D levels and treatment groups.
For the modular microarray analysis, a moderated t-test from the R/Bioconductor package ‘limma’ was first used to identify probes that were significantly up or downregulated between groups. Hypergeometric tests were used to determine the statistical significance of whole modules in a given list of up/down regulated probes and of the total number of probes on the chip.
Results
125 subjects were screened at 8 centers between 12/03/2008 and 04/19/2011 with randomization of 57 subjects. The modified intent-to-treat (mITT) population was comprised of 54 subjects (3 subjects never received a dose of study medication); 7 subjects without an IFN signature were enrolled into the study. The per-protocol (PP) population only consisted of 31 subjects (Figure 1).
Figure 1.
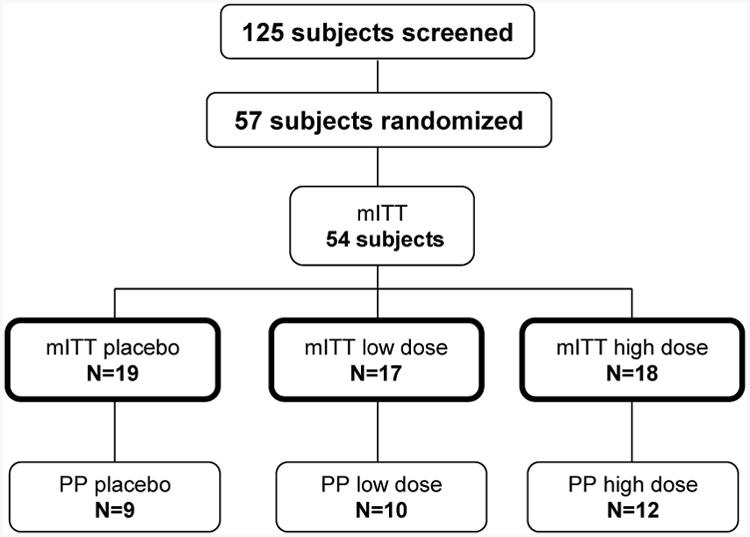
125 subjects were screened for eligibility into this study with randomization of 57 subjects (19 per treatment arm). The modified intent-to-treat (mITT) population was comprised of 54 subjects as 3 subjects never received a dose of study medication. The per-protocol (PP) population consisted of 31 subjects who had an overall treatment compliance 80-120% and had no substantive protocol deviations. (Subjects were excluded from the PP population if they had at least one of the following: noncompliant (n=6), negative IFN signature at baseline (n=7), receipt of prohibited medications at baseline (n=3), increase of immunosuppression during course of study (n=5), or, missing week 12 vitamin D (n=2) or IFN signature data (n=5)).
Baseline characteristics
Baseline characteristics of the 3 mITT treatment groups were similar (Table 1). Mean age, body habitus, disease duration and disease activity were balanced between treatment groups. Serum 25(OH)D levels (mean (SD)) were comparable: 11.3 (5.16), 11.8 (4.79) and 13.8 (7.15) ng/mL for placebo, low dose and high dose groups respectively (NS). Expression of each IFN inducible gene, was not notably different across the 3 groups. (Table 1).
Table 1.
Baseline characteristics of subjects by treatment group (mITT).
| Parameter | Summary Statistics | Placebo N=19 | Low Dose N=17 | High dose N=18 |
|---|---|---|---|---|
| Demographic features | ||||
| Female | n (%) | 18 (94.7%) | 17 (100%) | 16 (88.9%) |
| Age | Mean (SD) | 38.7 (12.27) | 36.5 (10.90) | 38.3 (12.88) |
| Black | n (%) | 8 (42.1%) | 11 (64.7%) | 10 (55.6%) |
| Hispanic | n (%) | 5 (26.3%) | 1 (5.9%) | 2 (11.1%) |
| BMI | Mean (SD) | 29.3 (8.78) | 30.4 (5.74) | 31.4 (6.11) |
| Serum 25 OH Vit D (ng/mL) | Mean (SD) | 11.3 (5.16) | 11.8 (4.79) | 13.8 (7.15) |
|
| ||||
| Disease features | ||||
| Years with SLE | Mean (SD) | 10.9 (7.77) | 10.7 (7.75) | 8.7 (5.97) |
| # ACR criteria met | Mean (SD) | 5.4 (1.34) | 5.5 (1.12) | 5.8 (1.25) |
| SELENA-SLEDAI * | Mean (SD) | 2.9 (1.22) | 2.7 (1.16) | 2.6 (1.04) |
| Mucocutaneous BILAG B | n (%) | 2 (10.5%) | 0 (0 %) | 2 (11.1%) |
|
| ||||
| Expression of IFN inducible genes** | ||||
| lfi44 relative to normal | Mean (SD) [min, max] | 14.0 (14.46) [0.50, 55.20] | 16.0 (13.74) [0.63, 57.81] | 12.0 (9.46) [1.03, 41.16] |
| lfi44>2SD above normal | n (%) | 13 (68.4%) | 14 (82.3%) | 12 (66.7%) |
| lfit1 relative to normal | Mean (SD) [min, max] | 36.5 (39.78) [0.63, 137.19] | 39.7 (49.14) [2.73, 187.84] | 27.1 (23.49) [1.84, 94.79] |
| lfit>2SD above normal | n (%) | 17 (89.5%) | 16 (94.1%) | 16 (88.9%) |
| M×1 relative to normal | Mean (SD) [min, max] | 12.1 (12.85) [1.34, 55.59] | 11.6 (14.77) [1.04, 65.04] | 10.4 (9.37) [1.51, 43.92] |
| M×1>2SD above normal | n (%) | 15 (79.0%) | 15 (88.2%) | 15 (83.3%) |
SELENA-SLEDAI was modified so that a spot protein/creatinine urinary ratio was used for estimation of proteinuria.
Expression of IFN genes were determined using RT-PCR. The relative expression levels were calculated using the comparative threshold cycle method. For each subject, the expression level of each IFNα inducible gene was computed relative that gene's average expression in a set of 20 normal controls; a subject's expression level is represented as a fold change over normal controls.
Vitamin D levels
Mean 25(OH)D levels increased over time in subjects receiving vitamin D3 and remained stable in subjects receiving placebo (Figure 2). Levels were slightly higher in the group receiving 4000IU/day compared to 2000IU/day (NS). Repletion, defined as achieving a serum 25(OH)D level of ≥30 ng/mL was reached by 0% of placebo, 33% of low dose and 61% of high dose subjects at Week 12 (p-value=0.17, high versus low dose, p<0.001 pooled supplementation versus placebo). There was no effect of age, race, BMI or compliance on achievement of repletion.
Figure 2.
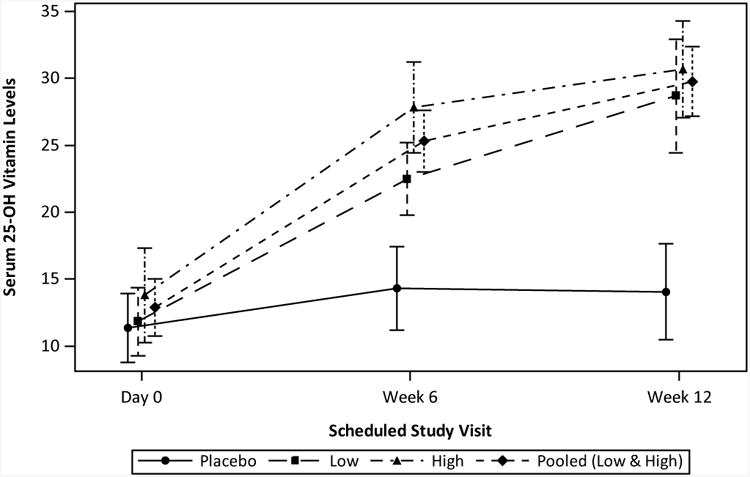
Serum 25(OH)D levels over time by treatment group. Mean serum 25(OH)D values and SD are shown for baseline, Week 6 and Week 12 study visits for each treatment group as well as for the pooled (low and high dose) group. mITT population with available data.
The frequency of repletion did, however, correlate with baseline 25(OH)D levels independent of vitamin D3 dose. Repletion was achieved in 22% of subjects with baseline 25(OH)D <10 ng/mL, 40% of subjects with baseline 25(OH)D of 10-15 ng/mL and 83% of subjects with baseline 25(OH)D of 15-20 ng/mL (n=6), p-value=0.029.
IFN signature response
At Week 12, 4 of 19 subjects taking placebo and 2 of 17 taking low dose vitamin D3 were missing gene expression data; these subjects were assumed to be non-responders for the primary analysis of the IFN signature response but are excluded from secondary analyses. Therefore, secondary analyses were performed on 48 subjects.
The IFN signature response at Week 12, the primary outcome, in the mITT population was not significantly different in subjects receiving placebo compared to subjects receiving vitamin D3 (Table 2). An IFN signature response was seen in 37% placebo, 24% low dose and 28% high dose subjects. 26% of subjects receiving any vitamin D3 had an IFN signature response (p-value=0.53, placebo versus any vitamin D3). Similar findings were observed in the PP population
Table 2. Interferon signature response by (A) treatment group and (B) Week 12 25(OH)D level.
| IFN signature response | ||
|---|---|---|
| (A) Treatment | N | n (%) |
| mITT population | ||
| Placebo | 19 | 7 (37%) |
| 2000IU/day | 17 | 4 (24%) |
| 4000IU/day | 18 | 5 (28%) |
| Pooled vitamin D3 | 35 | 9 (26%) |
| PP population | ||
| Placebo | 9 | 4 (44%) |
| 2000IU/day | 10 | 2 (20%) |
| 4000IU/day | 12 | 4 (33%) |
| Pooled vitamin D3 | 22 | 6 (27%) |
|
| ||
| (B) Week 12 25(OH)D level | N | n (%) |
|
| ||
| Serum 25(OH)D < 30ng/ml | 31 | 11 (35%) |
| Serum 25(OH)D ≥ 30ng/ml | 16 | 5 (31%) |
| Serum 25(OH)D < 25ng/ml | 22 | 8 (36%) |
| Serum 25(OH)D ≥ 25ng/ml | 25 | 8 (32%) |
| Serum 25(OH)D < 20ng/ml | 14 | 4 (29%) |
| Serum 25(OH)D ≥ 20ng/ml | 33 | 12 (36%) |
Serum 25(OH)D levels had no significant effect on the IFN signature response at Week 12 (Table 2). An IFN signature response was observed in 31% of subjects attaining a 25(OH)D level ≥30 ng/ml compared to 35% with a 25(OH)D level <30 ng/ml (p-value=0.77). Findings were similar using alternative cut-points of 25 or 20 ng/ml 25(OH)D (32% versus 36% for 25(OH)D levels ≥ or <25 ng/ml, respectively; 36% versus 29% for 25(OH)D levels ≥ or <20 ng/ml, respectively.) Furthermore, after adjusting for baseline levels, there was no significant difference in mean 25(OH)D levels at Week 6 or Week 12 between subjects with and without an IFN signature response at Week 12 (p-values: 0.93 at Week 6, 0.78 at Week 12; ANCOVA).
Historical data for the presence of anti-Sm, RNP, Ro or La antibodies, i.e. ribonuclear binding proteins (RBP), were available for 44 subjects in the mITT population. Although the proportion of responders was lower among subjects with a history of an antibody to at least one RBP compared to those with no history (28% versus 50%, respectively), the difference was not statistically significant.
Subjects were allowed to maintain stable doses of immunosuppressive or immunomodulatory medications taken for SLE. Anti-malarials were taken by 69%. Subjects taking anti-malarials were 3.2 times more likely to achieve an IFN signature response than subjects not taking this agent ((42% versus 13%), respectively; p-value= 0.057, Fisher's Exact). Concurrent glucocorticoids were taken by 54% of subjects, and 65% took concurrent immunosuppressives (azathioprine, methotrexate, or mycophenolate). Response rates for those on and off concurrent agents did not differ significantly for either glucocorticoid use (27% versus 41% in non-users) or immunosuppressant use (31% versus 47% in non-users).
IFN signature
At Week 12, the IFN signature was persistent in 79%, 94%, and 100% of placebo, low dose, and high dose subjects, respectively, in the mITT population (p=0.047 comparing placebo to pooled vitamin D groups). The persistence of the IFN signature for the duration of the study was irrespective of treatment with vitamin D3; all repleted subjects had an IFN signature at both Week 6 and Week 12.
Individual IFNα inducible gene expression
There was no correlation between individual IFN inducible baseline gene expression and 25(OH)D levels, To examine changes in expression for each IFN inducible gene, we used the log2 expression ratio of each gene at Week 12 to baseline (see methods); there were no significant correlations between changes in expression of individual IFN inducible genes and 25(OH)D levels at Week 12. Scatter plots show no evidence of a downward linear trend as there is neither a predominance of responders receiving vitamin D supplementation in the lower right quadrants nor non-responders/placebo subjects in the upper left quadrants (Figure 3). To further explore the relationship between changes in gene expression and vitamin D3 levels, the log2 expression ratio for each gene was also modeled as a linear function of baseline gene expression, 25(OH)D at Week 12, treatment group, and baseline gene expression by treatment group interaction. Neither Week 12 25(OH)D nor the interaction terms were significantly correlated with the change in gene expression. Changes in expression of each gene, however, did significantly correlate with baseline expression levels. Furthermore, there were no significant differences among treatment groups for any gene after adjustment for baseline expression levels (Figure 4). Analogous models exploring the relationship between a change in gene expression and repletion status at Week 12 showed no significant differences between repleted and nonrepleted groups for any gene with or without adjustment for baseline expression (data not shown).
Figure 3.
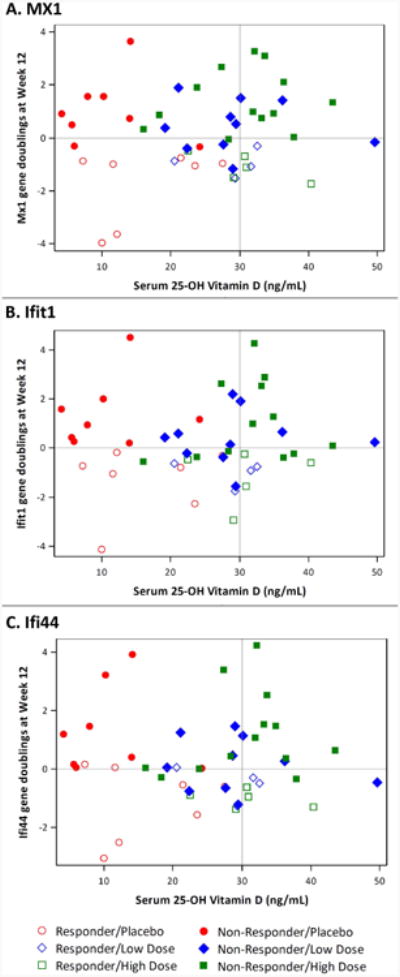
Scatter plots of M×1 (A), Ifit1 (B), and Ifi44 (C) log2 ratios of Week 12 to baseline gene expression versus serum 25(OH)D at Week 12 are displayed. Changes in gene expression in responders (open symbols) and non-responders (closed symbols) are shown for subjects in each treatment group.
Figure 4.
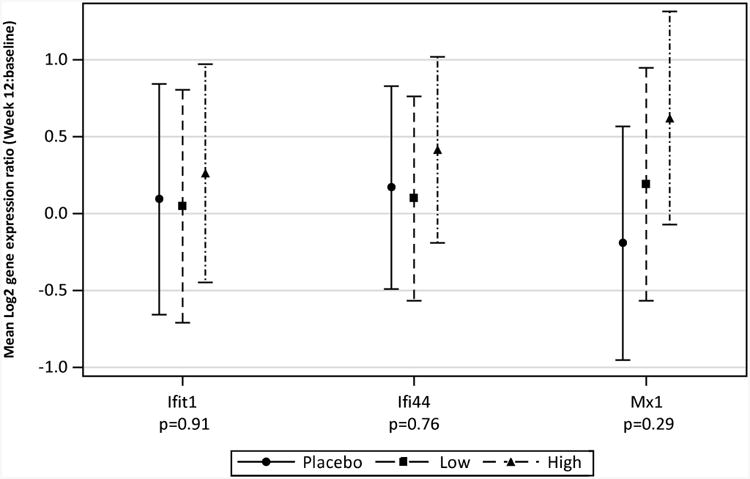
Change in expression of each gene from baseline. Mean (95% CI) for gene expression ratio (Week 12: baseline), on the log2 scale, after adjustment for baseline gene expression. Log2 of the gene expression ratio equals, if positive, the number of time expression doubled in 12 weeks, if negative, the number of times expression was halved. P-values are for the overall treatment effect (df=2) after adjustment for baseline expression levels (ANCOVA).
Microarray analysis
Modular gene expression was performed on mRNA prepared from a randomly selected subset of 40 study participants representing 14, 11 and 15 subjects in the placebo, low dose and high dose groups respectively at baseline and 12 weeks and 23 normal controls (data not shown). This subset was similar to the overall study population. There were significant differences in modular expression when comparing pooled SLE samples to samples from normal controls with increased expression of IFN, inflammation and myeloid modules and decreased expression of modules including T cell modules. There was no change in modular expression when comparing pooled SLE patients at baseline and Week 12 or when comparing treatment groups, and, there were no significant differences in the IFN inducible module between baseline and Week 12 within any treatment group. Comparison of gene expression at Week 12 in subjects grouped by vitamin D levels (25(OH)D >30 ng/ml (n=13) versus 25(OH)D <20 ng/ml (n=10)) demonstrated no significant differences in modular expression, including the IFN module except for a minimal change in module 2_11, an indeterminate module (18).
Disease activity
Disease activity measured with the SELENA-SLEDAI was stable over time with no significant differences among treatment groups after adjustment for baseline scores. Additionally, for most subjects, anti-dsDNA antibody status (determined at local laboratories) did not change from screening to Week 12, with only 2 subjects, both in the high dose group, shifting from positive to negative.
At week 12, no BILAG A or B scores were present in systems other than Musculoskeletal and Cardiorespiratory. One low dose group subject scored a Cardiorespiratory BILAG B and 3 patients had a Musculoskeletal BILAG B scores (1 in placebo and 2 in the high dose group). Four subjects entered the trial with a Mucocutaneous BILAG B, 2 in placebo and 2 in the high dose arms. Mucocutaneous disease fluctuated during the study and there were no suggestions that vitamin D supplementation targeted mucocutaneous features.
Parathyroid hormone
PTH and 25(OH)D levels at Week 12 were inversely correlated. After adjusting for baseline levels, the change in PTH from baseline to Week 12 correlated with the change in 25(OH)D (Pearson's partial correlation ρ=-0.38, p-value=0.008).
Safety
The study drug was well tolerated. Adverse events were balanced between the treatment groups with 54 adverse events occurring in 15 subjects in the placebo group, 49 events in 16 low dose subjects and 68 events in 15 subjects receiving high dose supplementation. Ten adverse events among 6 subjects distributed evenly among the treatment groups were associated with known toxicities to vitamin D, all were mild and none prompted withdrawal from the trial.. These events included 2 cases of hypercalcemia in addition to gastrointestinal complaints and arthralgia. Grade 1 hypercalcemia occurred in 2 subjects, each with a serum calcium of 10.3mg/dl. The corresponding 25(OH)D levels in these subjects were 20.8 and 35.5 ng/ml. There were no SAEs attributed to the study drug and no hypercalciuria was observed. A decrease in neutrophil count associated with a change in grade from baseline was significantly greater in the high dose treatment arm (p-value=0.01). No absolute neutrophil count values fell below 1000/mm3.
Discussion
Vitamin D deficiency is an attractive candidate as a modifiable environmental risk factor for increased SLE activity and susceptibility to disease. In numerous studies of SLE cohorts worldwide, vitamin D deficiency is observed more frequently in patients than in healthy controls (19). In most studies, levels of 25(OH)D correlate inversely with SLE disease activity. Even among otherwise healthy individuals, levels of 25(OH)D are lower among those who are antinuclear antibody (ANA) positive compared to those negative for ANA (20).
We examined the potential impact of vitamin D3 supplementation on the overexpression of IFN inducible genes (the IFN signature) in SLE patients with vitamin D deficiency and observed no reduction in the IFN signature response after 12 weeks of supplementation with vitamin D3 compared to placebo. An IFN signature response occurred in 37%, 24% and 28% of subjects receiving placebo, 2000IU or 4000IU vitamin D3 daily, respectively. The IFN response was assessed by measuring the expression of three IFN inducible genes. We defined a meaningful response as a 50% reduction in one gene or a 25% reduction in two of the genes provided that there was no significant increase in expression in the remaining gene(s). Since the baseline expression of each IFN inducible gene was exceedingly high, it was possible to fulfill the definition of a signature response and still maintain the interferon signature. One potential explanation for the lack of an effect of vitamin D3 on the IFN signature response could be the definitions utilized which required an arbitrary percent reduction of gene expression from baseline (25 or 50%). However, after adjustment for baseline gene expression, there were no significant differences in individual gene expression if analyzed using non-categorical methods of analysis, confirming a lack of a vitamin D effect on the overexpression of IFN inducible genes. Another explanation of our results relates to the use of only 3 IFN inducible genes to define the IFN signature and signature response as numerous scoring systems have been used to quantitate the overexpression of IFN inducible genes in SLE. Although each of the 3 genes we measured has been repeatedly reported as an IFN inducible gene, these 3 genes do not represent the entirety of the IFN signature. To explore the possibility that our definition of the IFN signature was overly narrow, we performed a post-hoc analysis of mRNA from a subset of study subjects using microarray analyses. We again determined that neither supplementation with vitamin D3 nor achieving levels of 25(OH)D >30 ng/ml reduced overall expression of the IFN inducible genes. In addition to the IFN module, modular microarray analysis examined the effects of treatment on other pathways and cell lineages known to be abnormal in SLE. Vitamin D had no effect on the expression of genes grouped by myeloid, B cell or T cell modules.
The mITT analysis examined the IFN signature response in all randomized subjects. As we were ultimately interested in the biologic effect of vitamin D3, we compared the IFN signature response of subjects achieving 25(OH)D levels ≥ 30ng/ml to those who did not. Repletion was surprisingly infrequent in subjects receiving low or high dose vitamin D3. However, the frequency of an IFN response was not statistically different between subjects who repleted versus those who did not replete their 25(OH)D to levels associated with bone health. There was also no correlation of individual gene expression and 25(OH)D levels. Additionally, examination of gene expression using modular microarray analyses grouping subjects by 25(OH)D repletion status showed no significant differences in modular expression between persistently deficient subjects and repleted subjects.
Although an IFN signature response was observed in 24% and 30% of subjects receiving low dose and high dose supplementation with vitamin D, these results were not significant compared to placebo. The IFN response in 37% of subjects in the placebo arm was unexpected and suggests that significant variation in the expression of IFN inducible genes occurs even in the setting of clinically stable disease. Expression of individual IFN inducible genes appears to fluctuate but because the levels remain well above the normal levels the IFN signature persists, consistent with previous reports of stability (21-23). Of note, we observed that subjects on hydroxychloroquine were more likely to achieve an IFN signature response.
As our study population had minimal disease activity, we did not expect to see a reduction in clinical disease; no significant differences were observed among the treatment groups. Subjects were also required to be anti-dsDNA antibody positive at study entry. Antibody titers remained relatively stable during the study. This is in contrast to findings by Abou-Raya et al who reported a small but statistically significant decrease in disease activity in SLE patients randomized to 2000IU of vitamin D3 daily compared to those receiving placebo (5). Anti-dsDNA antibodies and proinflammatory cytokine levels were significantly reduced among patients given vitamin D3. The longer duration of the Abou-Raya trial compared to our study, 12 months versus 12 weeks, may account for the differences observed between these studies.
There were no concerning safety signals during our study. Hypercalciuria, the most sensitive indicator of vitamin D toxicity, was not detected in any study participant; hypercalcemia was mild and infrequent. The decrease in neutrophils seen within the 4000IU/day treatment group was unexpected and was not associated with adverse clinical manifestations. It has not been previously reported with vitamin D supplementation.
The optimal level of 25(OH)D for bone health is believed to be 30 ng/ml, however the optimal level for immunologic homeostasis is not known. While 15 subjects achieved levels ≥30 ng/ml, only 3 subjects achieved 25(OH)D levels ≥40 ng/ml. An open-label study of vitamin D in SLE in which 25(OH)D levels increased from 18.7 ±6.7 ng/ml at baseline to 51.4 ±14.1 ng/ml at 2 months and to 41.5 ±10 ng/ml at 6 months demonstrated an increase in naive CD4+ T cells and Tregs with a decrease in effector Th1, Th17 cells, memory B cells and anti-dsDNA antibodies (24). These data suggest that higher 25(OH)D levels may be required, and that a longer trial using a treat-to-target approach may be a more appropriate trial design for future studies of the immunologic effects of vitamin D3.
Our findings show that vitamin D3 supplementation up to 4000IU daily for 12 weeks is safe and well-tolerated but does not diminish the expression of IFNα inducible genes among patients with stable, relatively clinically inactive SLE. We cannot exclude the possibility that higher doses of vitamin D3, achievement of higher 25(OH)D levels, and/or a longer duration of supplementation would result in diminution of the IFN signature.
Acknowledgments
The authors wish to acknowledge Dr Josiah Wedgwood (deceased) formerly of NIAID/NIH for his leadership, guidance and commitment to this project.
Funding Sources: This study was supported by the Autoimmunity Centers of Excellence (U19 AI-056363 and U19 AI-0563626) a consortium funded by the National Institute of Allergy and Infectious Disease (NIAID). Research reported in this publication was additionally supported by the National Center for Advancing Translational Sciences (NCAT) of the National Institutes of Health (NIH) under award number UL1TR00165 (UAB), National Center for Research Resources (NCRR) of the NIH under award number UL1 RR029882 (MUSC) and the National Institute of Arthritis and Musculoskeletal and Skin Diseases (NIAMS) of the NIH, K23 AR052364 (MUSC).
Footnotes
Financial Disclosures and Conflict of Interest: none
Vitamin D3 supplied by Bio-Tech Pharmacal, Inc. (Fayetteville, AR).
References
- 1.Adorini L, Penna G. Control of autoimmune diseases by the vitamin D endocrine system. Nat Clin Pract Rheumatol. 2008;4(8):404–12. doi: 10.1038/ncprheum0855. [DOI] [PubMed] [Google Scholar]
- 2.Linker-Israeli M, Elstner E, Klinenberg JR, Wallace DJ, Koeffler HP. Vitamin D(3) and its synthetic analogs inhibit the spontaneous in vitro immunoglobulin production by SLE-derived PBMC. Clin Immunol. 2001;99(1):82–93. doi: 10.1006/clim.2000.4998. [DOI] [PubMed] [Google Scholar]
- 3.Chen S, Sims GP, Chen XX, Gu YY, Chen S, Lipsky PE. Modulatory effects of 1,25-dihydroxyvitamin D3 on human B cell differentiation. J Immunol. 2007;179(3):1634–47. doi: 10.4049/jimmunol.179.3.1634. [DOI] [PubMed] [Google Scholar]
- 4.Aranow C. Vitamin D and the immune system. J Investig Med. 2011;59(6):881–6. doi: 10.231/JIM.0b013e31821b8755. [DOI] [PMC free article] [PubMed] [Google Scholar]
- 5.Abou-Raya A, Abou-Raya S, Helmii M. The effect of vitamin D supplementation on inflammatory and hemostatic markers and disease activity in patients with systemic lupus erythematosus: a randomized placebo-controlled trial. J Rheumatol. 2013;40(3):265–72. doi: 10.3899/jrheum.111594. [DOI] [PubMed] [Google Scholar]
- 6.Daniel C, Sartory NA, Zahn N, Radeke HH, Stein JM. Immune modulatory treatment of trinitrobenzene sulfonic acid colitis with calcitriol is associated with a change of a T helper (Th) 1/Th17 to a Th2 and regulatory T cell profile. J Pharmacol Exp Ther. 2008;324(1):23–33. doi: 10.1124/jpet.107.127209. [DOI] [PubMed] [Google Scholar]
- 7.Ojaimi S, Skinner NA, Strauss BJ, Sundararajan V, Woolley I, Visvanathan K. Vitamin D deficiency impacts on expression of toll-like receptor-2 and cytokine profile: a pilot study. J Transl Med. 2013;11:176. doi: 10.1186/1479-5876-11-176. [DOI] [PMC free article] [PubMed] [Google Scholar]
- 8.Piemonti L, Monti P, Sironi M, Fraticelli P, Leone BE, Dal Cin E, et al. Vitamin D3 affects differentiation, maturation, and function of human monocyte-derived dendritic cells. J Immunol. 2000;164(9):4443–51. doi: 10.4049/jimmunol.164.9.4443. [DOI] [PubMed] [Google Scholar]
- 9.Blanco P, Palucka AK, Gill M, Pascual V, Banchereau J. Induction of dendritic cell differentiation by IFN-alpha in systemic lupus erythematosus. Science. 2001;294(5546):1540–3. doi: 10.1126/science.1064890. [DOI] [PubMed] [Google Scholar]
- 10.Baechler EC, Batliwalla FM, Karypis G, Gaffney PM, Ortmann WA, Espe KJ, et al. Interferon-inducible gene expression signature in peripheral blood cells of patients with severe lupus. Proc Natl Acad Sci U S A. 2003;100(5):2610–5. doi: 10.1073/pnas.0337679100. [DOI] [PMC free article] [PubMed] [Google Scholar]
- 11.Kirou KA, Lee C, George S, Louca K, Peterson MG, Crow MK. Activation of the interferon-alpha pathway identifies a subgroup of systemic lupus erythematosus patients with distinct serologic features and active disease. Arthritis Rheum. 2005;52(5):1491–503. doi: 10.1002/art.21031. [DOI] [PubMed] [Google Scholar]
- 12.Kirou KA, Lee C, George S, Louca K, Papagiannis IG, Peterson MG, et al. Coordinate overexpression of interferon-alpha-induced genes in systemic lupus erythematosus. Arthritis Rheum. 2004;50(12):3958–67. doi: 10.1002/art.20798. [DOI] [PubMed] [Google Scholar]
- 13.Feng X, Wu H, Grossman JM, Hanvivadhanakul P, FitzGerald JD, Park GS, et al. Association of increased interferon-inducible gene expression with disease activity and lupus nephritis in patients with systemic lupus erythematosus. Arthritis Rheum. 2006;54(9):2951–62. doi: 10.1002/art.22044. [DOI] [PubMed] [Google Scholar]
- 14.Mandal M, Tripathy R, Panda AK, Pattanaik SS, Dakua S, Pradhan AK, et al. Vitamin D levels in Indian systemic lupus erythematosus patients: association with disease activity index and interferon alpha. Arthritis Res Ther. 2014;16(1):R49. doi: 10.1186/ar4479. [DOI] [PMC free article] [PubMed] [Google Scholar]
- 15.Ben-Zvi I, Aranow C, Mackay M, Stanevsky A, Kamen DL, Marinescu LM, et al. The impact of vitamin D on dendritic cell function in patients with systemic lupus erythematosus. PLoS ONE. 2010;5(2):e9193. doi: 10.1371/journal.pone.0009193. [DOI] [PMC free article] [PubMed] [Google Scholar]
- 16.Hollis BW, Kamerud JQ, Selvaag SR, Lorenz JD, Napoli JL. Determination of vitamin D status by radioimmunoassay with an 125I-labeled tracer. Clin Chem. 1993;39(3):529–33. [PubMed] [Google Scholar]
- 17.Livak KJ, Schmittgen TD. Analysis of relative gene expression data using realtime quantitative PCR and the 2(-Delta Delta C(T)) Method. Methods. 2001;25(4):402–8. doi: 10.1006/meth.2001.1262. [DOI] [PubMed] [Google Scholar]
- 18.Chaussabel D, Quinn C, Shen J, Patel P, Glaser C, Baldwin N, et al. A modular analysis framework for blood genomics studies: application to systemic lupus erythematosus. Immunity. 2008;29(1):150–64. doi: 10.1016/j.immuni.2008.05.012. [DOI] [PMC free article] [PubMed] [Google Scholar]
- 19.Kamen DL, Aranow C. The link between vitamin D deficiency and systemic lupus erythematosus. Curr Rheumatol Rep. 2008;10(4):273–80. doi: 10.1007/s11926-008-0044-3. [DOI] [PubMed] [Google Scholar]
- 20.Ritterhouse LL, Crowe SR, Niewold TB, Kamen DL, Macwana SR, Roberts VC, et al. Vitamin D deficiency is associated with an increased autoimmune response in healthy individuals and in patients with systemic lupus erythematosus. Ann Rheum Dis. 2011;70(9):1569–74. doi: 10.1136/ard.2010.148494. [DOI] [PMC free article] [PubMed] [Google Scholar]
- 21.MacDermott EJ, Cherian J, Santiago AG, Taimeh Z, Barillas-Arias L, Crow MK, et al. Type 1 interferon pathway activation predicts flares of disease activity in SLE [abstract] Arthritis Rheum. 2008;58(12):3974–5. [Google Scholar]
- 22.Petri M, Singh S, Tesfasyone H, Dedrick R, Fry K, Lal P, et al. Longitudinal expression of type I interferon responsive genes in systemic lupus erythematosus. Lupus. 2009;18(11):980–9. doi: 10.1177/0961203309105529. [DOI] [PMC free article] [PubMed] [Google Scholar]
- 23.Landolt-Marticorena C, Bonventi G, Lubovich A, Ferguson C, Unnithan T, Su J, et al. Lack of association between the interferon-alpha signature and longitudinal changes in disease activity in systemic lupus erythematosus. Ann Rheum Dis. 2009;68(9):1440–6. doi: 10.1136/ard.2008.093146. [DOI] [PubMed] [Google Scholar]
- 24.Terrier B, Derian N, Schoindre Y, Chaara W, Geri G, Zahr N, et al. Restoration of regulatory and effector T cell balance and B cell homeostasis in systemic lupus erythematosus patients through vitamin D supplementation. Arthritis Res Ther. 2012;14(5):R221. doi: 10.1186/ar4060. [DOI] [PMC free article] [PubMed] [Google Scholar]