

Abstract
Hyperpolarized 13C MRI has recently been used to dynamically image metabolism in vivo. This technique provides the capability to investigate metabolic changes in mouse brain development over multiple time points. In this study, we used 13C MR spectroscopic imaging and hyperpolarized 13C-1 labeled pyruvate to analyze its conversion into lactate. We also applied T2-weighted anatomical imaging to examine brain volume changes starting from postnatal day 18. We combined these results with body weight measurements for a comprehensive interpretation of mouse brain maturation. Both the produced lactate level and pyruvate to lactate conversion rate decreased with increasing age in a linear manner. Total brain volume remained the same after P18, even though body weight continued to grow exponentially. Our results have shown that the rate of metabolism of 13C-1 pyruvate to lactate in brain is high in the young mouse and decreases with age. The brain at P18 is still relatively immature and continues to develop even as the total brain volume remains the same.
Keywords: MRI, hyperpolarized 13C MR, brain maturation, lactate metabolism
Introduction
Understanding normal brain maturation is essential to establish a baseline for the assessment of developmental diseases that involve the brain. The biomarkers of normal brain development include global and local volume changes, increase in cortical complexity, microstructural changes resulting from white matter growth and myelination, and variations in metabolic rate and metabolite production. Magnetic Resonance Imaging (MRI) provides a non-invasive method to study in vivo brain development and subsequently enables quantification of the aforementioned biomarkers.
Most of MRI studies of normal brain maturation use T1- and T2-weighted and diffusion-weighted imaging (DTI) to assess morphological and microstructural changes, and subsequently, their inference on anatomical growth and functional segregation [1–3]. 1H Magnetic Resonance Spectroscopy (MRS) offers the ability to examine metabolic properties during brain maturation [4–6] but, until most recently, it has only provided steady state information of metabolites due to low metabolic concentrations and the long acquisition time needed to obtain diagnostic information. 13C spectroscopy provides another perspective, allowing investigation of metabolic exchanges and labeled neurotransmitters such as glutamate, GABA and aspartate in the developing murine brain [7–9]. Sensitivity of 13C had been low because its natural abundance is only about 1% in living organisms, and is, therefore, hard to detect within a limited scan time. Thus, most of the 13C MRI studies require a long scan time, which can only be achieved in cultured cells and extracted tissues [10–13], hampering the feasibility of longitudinal scanning to study maturation. Some of the in vivo studies require constant infusion of metabolites for minutes or hours [14, 15], which is impossible for young mice with small body volumes. Moreover, long scan time hinders the capability of measuring dynamic changes of metabolites.
In 2003, Golman et al [16] introduced a new method to dynamically quantify metabolism using hyperpolarized 13C, which enabled an entirely different avenue to study metabolism in vivo, in real time. Dynamic nuclear polarization (DNP) has been proven to increase 13C NMR signal more than 10,000 fold, allowing investigation of 13C metabolic exchanges in vivo [17]. DNP depends on nuclear spin polarization in the solid state. It requires a free radical, which is an unpaired electron, to transfer its electron spin polarization to the nuclear spins by microwave irradiation at low temperature. Once a hyperpolarized substrate is injected into a living mammal, we are able to collect real-time 13C metabolic imaging to study metabolism by following the substrate as it participates in a biochemical process. However, the hyperpolarization of the nuclear spins return to thermal equilibrium after a very short time at room temperature. Therefore, a metabolite must be carefully chosen in order to visualize the metabolic pathway within this time period. Hyperpolarized 13C-1 labeled pyruvate has been shown to demonstrate in vivo metabolism in murine [18], non-human primate [19], and human [20] due to its rapid delivery and uptake by the cells in various organs, and its quick conversion into lactate, alanine and/or carbon dioxide due to various metabolic pathways.
In this study, we applied DNP using 13C-1 labeled pyruvate to investigate the changes in pyruvate to lactate conversion over the course of mouse brain maturation, and combined this with T2-weighted MRI to obtain voxel-based volume changes in relation to maturation in mouse brain.
Methods
Experimental procedure
8 normal mice were scanned starting on postnatal day 18 and repeated every 10 days. A few time points were delayed due to technical issues. Mice were anesthetized with 1.5% isoflurane and 1 L/min oxygen during scans. A catheter was inserted into the tail vein for proceeding injection of hyperpolarized pyruvate. During the experiment, 0.3mL of mixed saline and heparin was injected into the mouse every 15 minutes to prevent blood clot. All experiments were conducted on a vertical 14.1T (Agilent) 600WB NMR spectrometer with 55mm 1000mT/m gradients. A 38mm diameter 1H and 13C dual-tuned coil was used, where 1H frequency was for main field shimming and T2-weighted anatomical imaging, and 13C coil was used for hyperpolarized 13C spectroscopic imaging.
48μL of C1 labeled 13C pyruvate was polarized using an Oxford HypersenseTM DNP instrument at 3.5T under 1.5K for an hour. Before injecting into the mouse, the hyperpolarized 13C-1 pyruvate was mixed with 4.5mL of NaOH buffer, which resulted a 160mM pyruvate solution with pH~7.5. The dissolution mixture was then injected into the tail vein through a catheter over a span of 12 seconds. The total volume injected was 300 μL with 150 μL into the mouse and 150 μL left in the catheter.
Data acquisition
13C spectroscopic imaging
Data were acquired on a 24mm×24mm×5mm slice centered on the brain, with 2D chemical-shift imaging. Center-out k-space trajectory was used with 7x7 phase encoding (zero-filled to 8x8). 128 spectral points were acquired with 2500 Hz bandwidth. The acquisition was started simultaneously with the pyruvate injection and repeated every 4s (3s acquisition time with 1s delay between each repetition) for a total of 60s (or 15 repetitions) with constant flip angle of 10°.
T2-weighted anatomical imaging
A 2D fast spin echo (FSE) sequence was applied for anatomical imaging with TR/TE=1.3s/12ms, and 8 echo train length with 12 ms echo spacing. The field of view was 30mmx30mm with 256 frequency and phase encodes, resulting in a 0.12mmx0.12mm in-plane resolution. The slice thickness was 1mm, and 10 slices were acquired without gap, covering most of the brain. The total scan time was 11 minutes.
Data processing
13C spectroscopic imaging
A 5Hz Lorentzian apodization was applied to each free-induction decay before Fourier transforming the data. After Fourier transformation, each voxel could be referred to a 15-time-point spectrum (Figure 1a). The peak height of pyruvate and lactate at each time point for each voxel were measured. Then we chose the six voxels matching the location from the T2-weighted anatomical image (Figure 1b), and averaged signal intensities among the six voxels for pyruvate and lactate separately. The pyruvate signal intensity depended on the polarization level, which varied between experiments, and consequently, the lactate signal intensity was affected, due to a linear relationship between pyruvate and lactate [21]. In order to compare lactate signal at different ages, we normalized the data by dividing lactate signal by the total carbon signal in the slab at each time point. We recorded the 5 highest intensities of normalized lactate in each scan for every mouse.
Figure 1.
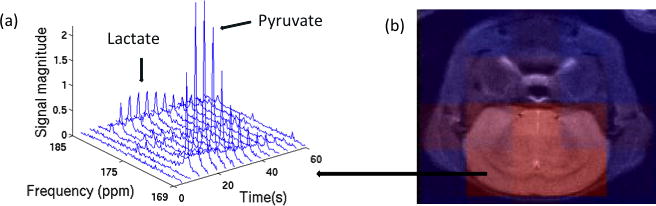
The 15-time-point dynamic spectrum (a) is depicted for a voxel. The six voxels matched with the brain (b) were chosen for 13C analysis.
T2-weighted anatomical imaging
To investigate brain volume changes through maturation, we used linear co-registration between the brains of two consecutive scans (i.e., 1st to 2nd, 2nd to 3rd, and so on) for each individual mouse (Figure 2). To achieve this, we first manually masked the brain mask of the 1st scan from non-brain tissues and parts including other organs of the head, the feet and water tubes running under the mouse to keep its body temperature. Then we linearly registered the 2nd scan to the 1st brain mask. This process subsequently created a brain mask of the 2nd scan by transforming the mask of the 1st scan. In the same manner, we registered the 3rd scan to the 2nd scan to create the brain mask of the 3rd scan, and so on. Multiplication of the three scaling parameters (in x, y, and z-axes) in the transformation matrix measured brain volume changes.
Figure 2.

Linear registration scheme between subsequent scans within each subject. The multiplication of the 3 scaling parameters T1, T2 and T3 from the resultant transformation matrix was used for volume change calculation.
Kinetic modeling
The hyperpolarized 13C-pyruvate was converted into lactate rapidly in the brain, allowing us to investigate real-time change of this metabolic process. To quantify the rate of this change, we applied the kinetic model from Zierhut et al [22] to fit the pyruvate and lactate signal over time. We averaged the peak height of pyruvate and lactate separately from the six voxels in the brain for each time point, and then we could obtain a curve of signal build up and decay for pyruvate and lactate individually (Figure 3).
Figure 3.

Dynamic data of the averaged peak height of pyruvate (x) and lactate (*) from six voxels in the brain. Kinetic models were fitted to pyruvate (—) and lactate (—).
The model was first fit into the pyruvate curve:
where Mpyr (t) is the pyruvate signal at time t, and tend is the time when pyruvate signal reaches the highest value. The parameters estimated from the fitting are: rateinj, the of pyruvate injection; kpyr, the rate of pyruvate signal decay, which is , where T1pyr is the T1 constant of hyperpolarized pyruvate at 14T field strength; and tarrival, the time when pyruvate arrives in the brain. Then we used these estimated parameters to fit into the lactate curve:
where Mlac(t) is the lactate signal at time t. We could estimate klac, the rate of lactate decay, and kpl, the conversion rate from pyruvate to lactate from this fitted model. The conversion rate, kpl, is another parameter besides normalized lactate level to imply metabolic rate in maturation.
Statistical analysis
To examine the association between age and the lactate level, pyruvate to lactate conversion rate or brain volume, we used a mixed effect linear model on the 5 highest intensities of normalized lactate, the pyruvate to lactate conversion rate, and the volume scaling separately using SurfStat (http://www.math.mcgill.ca/keith/surfstat/) [23]. This model permitted multiple measurements per subject while controlling for between-subject variation, thus increasing statistical power. We tested linear and nonlinear polynomial fitting.
In addition, we recorded body weight for each experiment, because body weight can also be an empirical indicator of maturation besides brain volume. The body weight was measured before experiment since the injection of hyperpolarized pyruvate would change the total body weight.
Results
By plotting the normalized lactate level versus age for each individual mouse, we observed significant decrease in normalized lactate signal with increasing age using a mixed effect model on the normalized lactate intensities (t=−3.84; p=0.001) (Figure 4).
Figure 4.

Linear fitting (—) of the mixed effect model to the peak normalized lactate level against age.
We plotted the estimated pyruvate to lactate conversion rate, kpl, against age for each individual mouse (Figure 5). Linear fitting resulted in the highest significance when we evaluated the mixed effect model on kpl. Similar to lactate level, kpl also decreased with increasing age (t=−2.11; p=0.044).
Figure 5.

Linear fitting (—) of the mixed effect model to the pyruvate to lactate conversion rate, Kpl, against age.
Analysis of linear regression on brain volume changes (i.e., multiplication of 3D scaling factors) showed no relationship between volume and age (t=0.82; p>0.4). However, total body weight increased with age (Figure 6) even though the global brain volume did not change after P18. Body weight almost doubled from P18 to P30, and the rate of weight growth slowed down after P30 (Figure 6). It follows an exponential growth (t=5.07; p=0.000025).
Figure 6.

The plot of body weight against age for each individual subject, with general-exponential fitting ( ).
Discussion
Our 13C metabolic imaging results demonstrated that pyruvate to lactate conversion was higher at younger age, and decreased linearly with increasing age. At a young age, brain and body consume more energy for brain development and body growth. Lactate can be used as an energy fuel for brain activation [24–32], and thus, its production is higher at younger age to support neuronal and other functional needs. It has been shown in cultured cells that both neurons and astrocytes utilize lactate as a source of energy and a precursor of lipids [33] and these results further were supported by 13C MR studies [11–13]. Moreover, the utilization of lactate by oligodendrocytes is three times higher than that by neurons and astrocytes [34]. The combination of these published findings suggests that lactate is greatly used for lipogenesis during myelin synthesis and may support a further explanation that long-lasting microstructural changes can occur in relation to brain maturation even at the stage where macroscopic volume growth stops, which is demonstrated in our results.
In this study, the analysis of total body weight showed that the mouse continued to grow after P18 and the rate of growth slowed down after P30. Our volumetric analysis based on T2-weighted images, on the other hand, did not show a significant change of overall brain volume after P18. This is consistent with findings of a previous high-resolution ex vivo T2-weighted MRI study that global and local volumes of mouse brain remained constant in size after P18 [3]. This may imply that the mouse brain reaches its maximum volume earlier than the whole body does. Another study has, however, shown that the lipid composition of myelin and microsomal fractions of mouse brain appeared to greatly increase from P14 to P24 and continued growing until P47 [35]. Protein composition of mouse brain myelin also continues to increase until P300, with the highest rate of increase between P20–P25 and decreasing rate of increase afterwards [36]. Although there is cross-subject variation in determining maturation stage [37], these published findings together with our result suggest that the microstructural growth of the mouse brain may continue even after adolescence although its total volume did not change.
In addition to total lactate level, pyruvate to lactate conversion rate is another parameter to measure the degree of metabolic change during brain development. The higher the conversion rate, the faster the metabolism takes place, and consequently, more lactate is produced within a limited amount of time. The maximum reaction rate of pyruvate, Vmax, is a more accurate and commonly recognized parameter to measure the rate of metabolism than the pyruvate to lactate conversion rate. If we can vary the concentration of pyruvate, we will get different kpl from different pyruvate concentration. Based on the different conversion rates and pyruvate concentrations, we can apply Michaelis-Menten kinetics model to estimate the maximum reaction rate of pyruvate, , where [pyr] is the concentration of pyruvate and Km is the Michaelis constant which refers to the concentration of pyruvate at half Vmax. However, the main obstacle of achieving this is that the mouse is too small to receive multiple shots of pyruvate within one experiment at young age. This can be improved by reducing the dead volume of saline and heparin in the catheter. We are working on a technical solution to divert the dead volume before injection through a custom-built cog system for this purpose. With minimal dead volume, we will be able to perform multiple experiments at a younger age when brain volume is still growing and access the correlation between metabolic rate and brain growth.
A notable strength of the current study lies in the longitudinal in vivo MRI imaging, yielding multiple measurements per individual. Our analysis was based on the global measurement of brain metabolism and volume. Although regional metabolism may be important to understand pattern of brain development, low resolution in the hyperpolarized 13C acquisitions is a major technical challenge, limiting the ability for regional analyses. The hyperpolarized substrate returns to polarization at thermal equilibrium very quickly after taken out of the polarizer. Moreover, T1 of hyperpolarized substrate is shorter at the higher field strength of our 14T animal scanner as compared to lower fields such as 1.5T or 3T. Nevertheless, we achieved a very important advance in obtaining a dynamic spectroscopic image, where the acquisition was repeated every 4 seconds for a total of 60 seconds. The image spatial resolution of 3mm x 3mm was the highest we could achieve within 4 seconds by current technique. There is a tradeoff between temporal resolution and spatial resolution. With future improvement in the MRI pulse sequence, we will be able to reach comparable 13C spectroscopic image resolution with anatomical image resolution, enabling the analysis of brain local changes in metabolism and volume from a young age to P18 and later ages.
Our study demonstrates the effectiveness of hyperpolarized 13C MRI to examine the dynamic metabolic changes of pyruvate to lactate conversion during brain maturation, suggesting other substrates can be used in the same manner to explore dynamic changes of other metabolic pathways. In our kinetic modeling, we neglected the oxidation from lactate to pyruvate by assuming its rate was negligible. Sometimes it is important to consider the lactate to pyruvate conversion rate, especially at very young age or with brain abnormalities such as hypoxia or hypoglycemia, in which lactate is utilized as substitute for glucose as energy source [38]. In a future study, we plan to evaluate this by injecting hyperpolarized lactate into the mouse to estimate its conversion rate to pyruvate [39]. This can also be measured by using Metabolic Activity Decomposition Stimulated-echo Acquisition Mode (MAD-STEAM), which results a more robust and accurate modeling fitting with both conversion rates of pyruvate to lactate and lactate to pyruvate simultaneously [40, 41].
Overall, our longitudinal study using hyperpolarized 13C MR spectroscopic imaging is the first to show in vivo dynamic changes of pyruvate to lactate conversion in the brain during normal brain maturation. The results from normal brain studies can serve as a baseline for future metabolic studies of injured developing brain such as hypoxic ischemic encephalopathy.
Acknowledgments
Our study was funded by NIH R01EB009756, R01NS033997, P41EB013598.
References
- 1.Mori S, Itoh R, Zhang J, Kaufmann WE, van Zijl PC, Solaiyappan M, et al. Diffusion tensor imaging of the developing mouse brain. Magnetic resonance in medicine : official journal of the Society of Magnetic Resonance in Medicine / Society of Magnetic Resonance in Medicine. 2001;46(1):18–23. doi: 10.1002/mrm.1155. Epub 2001/07/10. [DOI] [PubMed] [Google Scholar]
- 2.Zhang J, Richards LJ, Yarowsky P, Huang H, van Zijl PC, Mori S. Three-dimensional anatomical characterization of the developing mouse brain by diffusion tensor microimaging. NeuroImage. 2003;20(3):1639–48. doi: 10.1016/s1053-8119(03)00410-5. Epub 2003/12/04. [DOI] [PubMed] [Google Scholar]
- 3.Chuang N, Mori S, Yamamoto A, Jiang H, Ye X, Xu X, et al. An MRI-based atlas and database of the developing mouse brain. NeuroImage. 2011;54(1):80–9. doi: 10.1016/j.neuroimage.2010.07.043. Epub 2010/07/27. [DOI] [PMC free article] [PubMed] [Google Scholar]
- 4.Tkac I, Henry PG, Andersen P, Keene CD, Low WC, Gruetter R. Highly resolved in vivo 1H NMR spectroscopy of the mouse brain at 9.4 T. Magnetic resonance in medicine : official journal of the Society of Magnetic Resonance in Medicine / Society of Magnetic Resonance in Medicine. 2004;52(3):478–84. doi: 10.1002/mrm.20184. Epub 2004/08/31. [DOI] [PubMed] [Google Scholar]
- 5.Larvaron P, Bielicki G, Boespflug-Tanguy O, Renou JP. Proton MRS of early post-natal mouse brain modifications in vivo. NMR in biomedicine. 2006;19(2):180–7. doi: 10.1002/nbm.997. Epub 2006/02/14. [DOI] [PubMed] [Google Scholar]
- 6.Bluml S, Wisnowski JL, Nelson MD, Jr, Paquette L, Gilles FH, Kinney HC, et al. Metabolic maturation of the human brain from birth through adolescence: insights from in vivo magnetic resonance spectroscopy. Cerebral cortex (New York, NY : 1991) 2013;23(12):2944–55. doi: 10.1093/cercor/bhs283. Epub 2012/09/07. [DOI] [PMC free article] [PubMed] [Google Scholar]
- 7.Morken TS, Brekke E, Ha°berg A, Widerøe M, Brubakk A-M, Sonnewald U. Neuron–astrocyte interactions, pyruvate carboxylation and the pentose phosphate pathway in the neonatal rat brain. Neurochemical research. 2014;39(3):556–69. doi: 10.1007/s11064-013-1014-3. [DOI] [PubMed] [Google Scholar]
- 8.Chowdhury GM, Patel AB, Mason GF, Rothman DL, Behar KL. Glutamatergic and GABAergic neurotransmitter cycling and energy metabolism in rat cerebral cortex during postnatal development. Journal of Cerebral Blood Flow & Metabolism. 2007;27(12):1895–907. doi: 10.1038/sj.jcbfm.9600490. [DOI] [PubMed] [Google Scholar]
- 9.Novotny EJ, Ariyan C, Mason GF, O’Reilly J, Haddad GG, Behar KL. Differential increase in cerebral cortical glucose oxidative metabolism during rat postnatal development is greater in vivo than in vitro. Brain research. 2001;888(2):193–202. doi: 10.1016/s0006-8993(00)03051-1. [DOI] [PubMed] [Google Scholar]
- 10.Hassel B, Brathe A. Cerebral metabolism of lactate in vivo: evidence for neuronal pyruvate carboxylation. Journal of cerebral blood flow and metabolism : official journal of the International Society of Cerebral Blood Flow and Metabolism. 2000;20(2):327–36. doi: 10.1097/00004647-200002000-00014. Epub 2000/03/04. [DOI] [PubMed] [Google Scholar]
- 11.Waagepetersen HS, Bakken IJ, Larsson OM, Sonnewald U, Schousboe A. Comparison of lactate and glucose metabolism in cultured neocortical neurons and astrocytes using 13C–NMR spectroscopy. Developmental neuroscience. 1998;20(4–5):310–20. doi: 10.1159/000017326. Epub 1998/10/21. [DOI] [PubMed] [Google Scholar]
- 12.Alves PM, McKenna MC, Sonnewald U. Lactate metabolism in mouse brain astrocytes studied by [13C]NMR spectroscopy. Neuroreport. 1995;6(16):2201–4. doi: 10.1097/00001756-199511000-00024. Epub 1995/11/13. [DOI] [PubMed] [Google Scholar]
- 13.Bouzier-Sore AK, Voisin P, Canioni P, Magistretti PJ, Pellerin L. Lactate is a preferential oxidative energy substrate over glucose for neurons in culture. Journal of cerebral blood flow and metabolism : official journal of the International Society of Cerebral Blood Flow and Metabolism. 2003;23(11):1298–306. doi: 10.1097/01.wcb.0000091761.61714.25. Epub 2003/11/06. [DOI] [PubMed] [Google Scholar]
- 14.Cerdan S, Künnecke B, Seelig J. Cerebral metabolism of [1, 2-13C2] acetate as detected by in vivo and in vitro 13C NMR. Journal of Biological Chemistry. 1990;265(22):12916–26. [PubMed] [Google Scholar]
- 15.Sibson N, Dhankhar A, Mason G, Behar K, Rothman D, Shulman R. In vivo 13C NMR measurements of cerebral glutamine synthesis as evidence for glutamate–glutamine cycling. Proceedings of the National Academy of Sciences. 1997;94(6):2699–704. doi: 10.1073/pnas.94.6.2699. [DOI] [PMC free article] [PubMed] [Google Scholar]
- 16.Golman K, Ardenkjaer-Larsen JH, Petersson JS, Mansson S, Leunbach I. Molecular imaging with endogenous substances. Proceedings of the National Academy of Sciences of the United States of America. 2003;100(18):10435–9. doi: 10.1073/pnas.1733836100. Epub 2003/08/22. [DOI] [PMC free article] [PubMed] [Google Scholar]
- 17.Ardenkjaer-Larsen JH, Fridlund B, Gram A, Hansson G, Hansson L, Lerche MH, et al. Increase in signal-to-noise ratio of > 10,000 times in liquid-state NMR. Proceedings of the National Academy of Sciences of the United States of America. 2003;100(18):10158–63. doi: 10.1073/pnas.1733835100. Epub 2003/08/22. [DOI] [PMC free article] [PubMed] [Google Scholar]
- 18.Golman K, in 't Zandt R, Thaning M. Real-time metabolic imaging. Proceedings of the National Academy of Sciences of the United States of America. 2006;103(30):11270–5. doi: 10.1073/pnas.0601319103. Epub 2006/07/14. [DOI] [PMC free article] [PubMed] [Google Scholar]
- 19.Park I, Bok R, Ozawa T, Phillips JJ, James CD, Vigneron DB, et al. Detection of early response to temozolomide treatment in brain tumors using hyperpolarized 13C MR metabolic imaging. Journal of magnetic resonance imaging : JMRI. 2011;33(6):1284–90. doi: 10.1002/jmri.22563. Epub 2011/05/19. [DOI] [PMC free article] [PubMed] [Google Scholar]
- 20.Nelson SJ, Kurhanewicz J, Vigneron DB, Larson PE, Harzstark AL, Ferrone M, et al. Metabolic imaging of patients with prostate cancer using hyperpolarized [1-(1)(3)C]pyruvate. Science translational medicine. 2013;5(198):198ra08. doi: 10.1126/scitranslmed.3006070. Epub 2013/08/16. [DOI] [PMC free article] [PubMed] [Google Scholar]
- 21.Dienel GA, Cruz NF. Imaging brain activation: simple pictures of complex biology. Annals of the New York Academy of Sciences. 2008;1147:139–70. doi: 10.1196/annals.1427.011. Epub 2008/12/17. [DOI] [PMC free article] [PubMed] [Google Scholar]
- 22.Zierhut ML, Yen YF, Chen AP, Bok R, Albers MJ, Zhang V, et al. Kinetic modeling of hyperpolarized 13C1-pyruvate metabolism in normal rats and TRAMP mice. Journal of magnetic resonance (San Diego, Calif : 1997) 2010;202(1):85–92. doi: 10.1016/j.jmr.2009.10.003. Epub 2009/11/04. [DOI] [PMC free article] [PubMed] [Google Scholar]
- 23.Worsley KJ, Taylor JE, Carbonell F, Chung MK, Duerden E, Bernhardt B, Lyttelton O, Boucher M, Evans AC. SurfStat: A Matlab toolbox for the statistical analysis of univariate and multivariate surface and volumetric data using linear mixed effects models and random field theory. NeuroImage. 2009;47:S102. [Google Scholar]
- 24.Pellerin L, Pellegri G, Martin JL, Magistretti PJ. Expression of monocarboxylate transporter mRNAs in mouse brain: support for a distinct role of lactate as an energy substrate for the neonatal vs. adult brain. Proceedings of the National Academy of Sciences of the United States of America. 1998;95(7):3990–5. doi: 10.1073/pnas.95.7.3990. Epub 1998/05/09. [DOI] [PMC free article] [PubMed] [Google Scholar]
- 25.Gladden LB. Lactate metabolism: a new paradigm for the third millennium. The Journal of physiology. 2004;558(Pt 1):5–30. doi: 10.1113/jphysiol.2003.058701. Epub 2004/05/08. [DOI] [PMC free article] [PubMed] [Google Scholar]
- 26.Medina JM, Tabernero A. Lactate utilization by brain cells and its role in CNS development. Journal of neuroscience research. 2005;79(1–2):2–10. doi: 10.1002/jnr.20336. Epub 2004/12/02. [DOI] [PubMed] [Google Scholar]
- 27.Dienel GA. Brain lactate metabolism: the discoveries and the controversies. Journal of cerebral blood flow and metabolism : official journal of the International Society of Cerebral Blood Flow and Metabolism. 2012;32(7):1107–38. doi: 10.1038/jcbfm.2011.175. Epub 2011/12/22. [DOI] [PMC free article] [PubMed] [Google Scholar]
- 28.Brooks GA. Mammalian fuel utilization during sustained exercise. Comparative biochemistry and physiology Part B, Biochemistry & molecular biology. 1998;120(1):89–107. doi: 10.1016/s0305-0491(98)00025-x. Epub 1998/10/27. [DOI] [PubMed] [Google Scholar]
- 29.Medina J, Fernández E, Bolańos J, Vicario C, Arizmendi C. Fuel Supply to the Brain During the Early Postnatal Period. In: Cuezva J, Pascual-Leone A, Patel M, editors. Endocrine and Biochemical Development of the Fetus and Neonate. Reproductive Biology. Springer; US: 1990. pp. 175–94. [Google Scholar]
- 30.Dringen R, Gebhardt R, Hamprecht B. Glycogen in astrocytes: possible function as lactate supply for neighboring cells. Brain research. 1993;623(2):208–14. doi: 10.1016/0006-8993(93)91429-v. Epub 1993/10/01. [DOI] [PubMed] [Google Scholar]
- 31.Vicario C, Arizmendi C, Malloch G, Clark JB, Medina JM. Lactate utilization by isolated cells from early neonatal rat brain. Journal of neurochemistry. 1991;57(5):1700–7. doi: 10.1111/j.1471-4159.1991.tb06370.x. Epub 1991/11/01. [DOI] [PubMed] [Google Scholar]
- 32.Arizmendi C, Medina JM. Lactate as an oxidizable substrate for rat brain in vitro during the perinatal period. The Biochemical journal. 1983;214(2):633–5. doi: 10.1042/bj2140633. Epub 1983/08/15. [DOI] [PMC free article] [PubMed] [Google Scholar]
- 33.Vicario C, Tabernero A, Medina JM. Regulation of lactate metabolism by albumin in rat neurons and astrocytes from primary culture. Pediatric research. 1993;34(6):709–15. doi: 10.1203/00006450-199312000-00002. Epub 1993/12/01. [DOI] [PubMed] [Google Scholar]
- 34.Sanchez-Abarca LI, Tabernero A, Medina JM. Oligodendrocytes use lactate as a source of energy and as a precursor of lipids. Glia. 2001;36(3):321–9. doi: 10.1002/glia.1119. Epub 2001/12/18. [DOI] [PubMed] [Google Scholar]
- 35.Horrocks LA. Composition of mouse brain myelin during development. Journal of neurochemistry. 1968;15(6):483–8. doi: 10.1111/j.1471-4159.1968.tb08945.x. Epub 1968/06/01. [DOI] [PubMed] [Google Scholar]
- 36.Morell P, Greenfield S, Costantino-Ceccarini E, Wisniewski H. Changes in the protein composition of mouse brain myelin during development. Journal of neurochemistry. 1972;19(11):2545–54. doi: 10.1111/j.1471-4159.1972.tb01313.x. Epub 1972/11/01. [DOI] [PubMed] [Google Scholar]
- 37.Semple BD, Blomgren K, Gimlin K, Ferriero DM, Noble-Haeusslein LJ. Brain development in rodents and humans: identifying benchmarks of maturation and vulnerability to injury across species. Progress in neurobiology. 2013;106:1–16. doi: 10.1016/j.pneurobio.2013.04.001. [DOI] [PMC free article] [PubMed] [Google Scholar]
- 38.Vannucci RC, Vannucci SJ. Glucose metabolism in the developing brain. Seminars in perinatology. 2000;24(2):107–15. doi: 10.1053/sp.2000.6361. Epub 2000/05/11. [DOI] [PubMed] [Google Scholar]
- 39.Chen AP, Kurhanewicz J, Bok R, Xu D, Joun D, Zhang V, et al. Feasibility of using hyperpolarized [1-13C]lactate as a substrate for in vivo metabolic 13C MRSI studies. Magnetic resonance imaging. 2008;26(6):721–6. doi: 10.1016/j.mri.2008.01.002. Epub 2008/05/16. [DOI] [PMC free article] [PubMed] [Google Scholar]
- 40.Larson PE, Kerr AB, Swisher CL, Pauly JM, Vigneron DB. A rapid method for direct detection of metabolic conversion and magnetization exchange with application to hyperpolarized substrates. Journal of magnetic resonance (San Diego, Calif : 1997) 2012;225:71–80. doi: 10.1016/j.jmr.2012.09.014. Epub 2012/11/13. [DOI] [PMC free article] [PubMed] [Google Scholar]
- 41.Swisher CL, Larson PE, Kruttwig K, Kerr AB, Hu S, Bok RA, et al. Quantitative measurement of cancer metabolism using stimulated echo hyperpolarized carbon-13 MRS. Magnetic resonance in medicine. 2014;71(1):1–11. doi: 10.1002/mrm.24634. Epub 2013/02/16. [DOI] [PMC free article] [PubMed] [Google Scholar]