Abstract
Arteries can adapt to sustained changes in blood pressure and flow, and it is thought that these adaptive processes often begin with an altered smooth muscle cell activity that precedes any detectable changes in the passive wall components. Yet, due to the intrinsic coupling between the active and passive properties of the arterial wall, it has been difficult to delineate the adaptive contributions of active smooth muscle. To address this need, we used a novel experimental-computational approach to quantify adaptive functions of active smooth muscle in arterial rings excised from the proximal descending thoracic aorta (DTA) of mice and subjected to short-term sustained circumferential stretches while stimulated with various agonists. A new mathematical model of the adaptive processes was derived and fit to data to describe and predict the effects of active tone adaptation. It was found that active tone was maintained when the artery was adapted close to the optimal stretch for maximal active force production, but tone was reduced when adapted below the optimal stretch; there was no significant change in passive behavior in either case. Such active adaptations occurred only upon smooth muscle stimulation with phenylephrine, however, not stimulation with KCl or angiotensin-II. Numerical simulations using the proposed model suggested further that active tone adaptation in vascular smooth muscle could play a stabilizing role for wall stress in large elastic arteries.
Keywords: biomechanics, vascular smooth muscle, contraction, adaptation, remodeling, mathematical model
Introduction
Arteries exhibit a remarkable ability to adapt to long-term (days to months) changes in hemodynamic loading, often manifested as an altered caliber in response to changes in flow or an altered thickness in response to changes in pressure. These long-term adaptations necessarily involve changes in extracellular matrix, via both remodeling and turnover, which in many cases are complemented by changes in vessel-level vasoactivity (Langille and Dajnowiec 2005; Dajnowiec and Langille 2007; Valentin et al. 2009). Although not studied previously in arteries, the arteriolar wall can adapt to short-term (hours) changes in induced vasoactivity (Martinez-Lemus et al. 2004, 2009). It has been suggested that these short-term adaptations occur via changes in intracellular proteins within, and interactions between, the vascular smooth muscle cells (SMCs) prior to any detectable changes in the passive matrix. Taken together, these observations at different scales (arterioles to arteries) over different periods (from hours to months) suggest complex intrinsic interactions between the passive and active properties of the vascular wall.
Short-term adaptive functions have been studied primarily in small resistance arteries or arterioles (Buus et al. 2001; Bakker et al. 2002, 2004, 2008; Martinez-Lemus et al. 2004, 2008; Tuna et al. 2013). These studies reveal two key stimuli for adaptation: the level of mechanical strain imposed on the vessel, and hence the SMCs (i.e., the configuration to which the SMCs must adapt), and the level of chemical activation of the actomyosin apparatus (i.e., the contractile state that the SMCs can respond with). In cases wherein intact vessels were studied using a pressure-myograph, the induced mechanical strain was regulated through the luminal pressure and the actomyosin interaction through use of pharmacological agonists. When adapted for only a few hours, the primary change was a reorganization of the SMCs that affected the overall geometry of the vessel (Martinez-Lemus et al. 2004). When subjected to perturbed mechanical or chemical stimuli for longer durations, up to several days, changes were observed in both the active contractile and the passive properties of the wall (Bakker et al. 2004).
Vascular SMC actomyosin activity can be regulated via changes in blood flow (actually the resulting wall shear stress), which alters the production of vasoactive molecules by the endothelial cells. For example, high flow results in endothelial production of nitric oxide synthase (eNOS), which catalyzes the generation of the potent vasodilator, nitric oxide; in contrast, low flow results in endothelial production of the potent vasoconstrictor, endothelin-1. That is, nitric oxide inhibits whereas endothelin-1 heightens actomyosin interactions within the SMCs. In a study of adaptations by mesenteric arteries to 1- or 3-day changes in flow, it was found that the passive and active length-tension relationships for the adapted vessels changed in response to low flow (i.e., high SMC activation) but not high flow (low SMC activation), thus suggesting that actomyosin interactions are necessary for vascular adaptation (Tuna et al. 2013).
Whereas there are many studies of adaptations of the passive properties of large arteries to altered hemodynamics, experimental data are limited on adaptations of active tone. Although SMCs in large arteries are thought to exhibit primarily a synthetic, not contractile, phenotype, Arner et al. (1984) reported significant changes in both the active and passive length-tension relationships of abdominal aortic vessels adapted to long-term (6 weeks) changes in pressure and flow. When pressure and flow were reduced, the inner diameter and wall thickness adapted via inward hypotrophic remodeling (reduction in lumen diameter and decreased cross-sectional area); when pressure and flow were increased, the inner diameter and wall thickness adapted via outward hypertrophic remodeling (increase in lumen diameter and increased cross-sectional area). The mean passive stretch-stress relationship revealed an increase in stiffness after adaptation in both cases, albeit more dramatic in the low pressure/flow case. The maximal active stress decreased in the low pressure/low flow case while there was only a small decrease in the high pressure/high flow case. Hence, similar to resistance arteries, changes in passive and active properties can occur during chronic adaptations in large elastic arteries. Together, these findings across scales support the hypothesis that both mechanical stimuli and active cellular sensing are necessary for active tone adaptation in large arteries.
In the present work, we study experimentally and computationally the acute (< 10 hours) adaptations in active tone of arterial rings excised from the thoracic aorta of the mouse. Data were collected during in vitro chemo-mechanical manipulations of arterial rings that did not cause significant changes in the passive matrix properties. Simulations were performed using a mathematical model that was informed by experimental data and used to predict mechanical mechanisms by which the murine aorta adapted its active properties acutely.
Methods
Experimental protocol
Arterial rings from the proximal descending thoracic aorta (DTA) were harvested from 10 to 14 week old mice. The experiments were performed using two myograph systems: a multi-channel muscle myograph (MYOBATH-4, World Precision Instruments, Sarasota, USA) and a Mulvany-Halpern myograph (620 M Multi Wire Myograph System, Danish MyoTechnology, Aarhus, Denmark). In both systems, arterial rings were mounted on two pins, one connected to a micrometer and the other to a force transducer. The rings were held in an open organ bath with Krebs-Ringer bicarbonate buffer solution at 37°C and continuously oxygenated with 95% O2 and 5% CO2 to maintain a pH of 7.4. The arterial rings were stretched to ~20% of their resting circumference and equilibrated for 30 min in the buffer solution. To precondition the arterial rings, two high K+ contractions were induced by adding 80 mM potassium chloride (KCl) and recording the active tension development for 5 minutes.
The protocol to study possible adaptations consisted of three phases: 1) measurement of passive and active (using high K+ induced contractions) length-tension relationships, 2) exposure to one of three vasoconstrictors for 180 minutes at either low (lower than optimal muscle stretch) or near optimal muscle stretch, and 3) a repeat measurement of the active and passive length-tension relationships to identify changes, if any, following adaptation. The passive length-tension experiments were performed by stretching the rings to the desired value(s) of stretch and measuring the associated force(s) following equilibration for 3 minutes at each stretch. The active relations were obtained by contracting the ring sample with 80 mM KCl and then recording data for 5 minutes at the prescribed stretch; the high K+ was then washed out and the ring relaxed for 5 minutes. The contraction steps were repeated at different muscle stretches until exceeding the optimal value, which was indicated by the development of maximal active tension.
During the adaptation phase, each aortic ring was stretched to the desired “adaptation stretch”, equilibrated for 3 min, and then contracted using one of the three vasoconstrictors: 80M KCl, 2 μM phenylephrine (PE), or 100 nM angiotensin II (Ang II), which tended to result in very different contraction dynamics (Figure 1). The change in active tone during adaptation with PE at low stretch was measured at two different times, 2 and 3 hours after beginning the perturbation. After each adaptation step, the bath was washed out 3 times. The load-free inner diameter for each ring was estimated by measuring the distance between the pins touching the inner wall of the ring without any significant increase in tension.
Fig. 1.
Isometric active tension development of a representative arterial ring that was excised from the proximal descending thoracic aorta (DTA) of a mouse and held near its optimal value of circumferential stretch. Results are for stimulation with 80 mM KCl and its relaxation following a wash-out (left), stimulation with 2 μM PE (middle), then stimulation with 100 nM AngII (right). The attenuated response to AngII was not a function of the order of stimulation.
Mathematical model
An existing semi-phenomenological mathematical model based on a structurally-motivated description of the smooth muscle contractile unit was coupled with a new kinetic model of active tone adaptation to study potential roles of short-term adaptations in large elastic arteries. A parameter sensitivity analysis was performed to assess which parameters could be involved in the active tone adaptation.
The smooth muscle contractile unit model
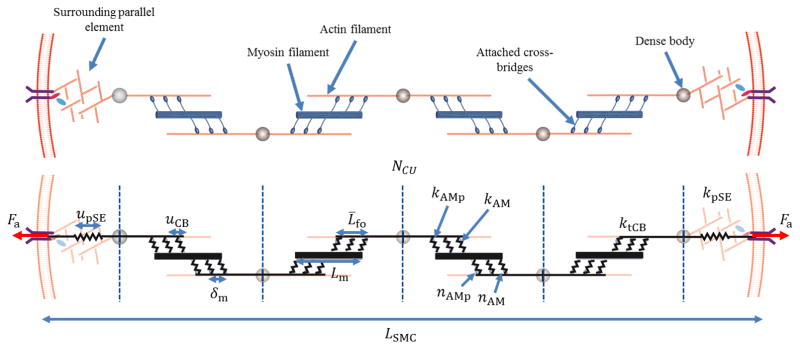
The SMC model built upon a prior model of contractility (Murtada et al. 2010, 2012) that describes the contractile apparatus as a network of contractile units (CU). Referring to Figure 2, two characteristic features of the SMC were modeled to account for the kinematics during isometric contraction: an average elongation of an attached cross-bridge uCB and the deformation of passive surrounding elements (pSE) upSE, here representing the actin cortex. The intracellular myosin and actin filaments were assumed to be arranged as contractile units (CU) and to interact through attached cross-bridges. Two types of cross-bridges were assumed to form, a stronger cycling cross-bridge represented by the elastic stiffness parameter kAMp and a weaker noncycling cross-bridge represented by the elastic stiffness parameter kAM (Stålhand et al. 2008; Murtada et al. 2010; Böl et al. 2012). Thus, the total stiffness of all attached myosin cross-bridges in a half of a CU is
Fig. 2.
Schematic diagram of the proposed smooth muscle cell model, where contractile units (CU) consist of thick myosin filaments of length Lm and thin actin filaments with a relative filament overlap L̄fo. The myosin and actin filaments interact through strong (kAMp, nAMp) and weak (kAM, nAM) cross-bridges and have a total elastic stiffness of ktCB. The CUs form contractile fibers (CFs) via connections, through dense bodies, with a parallel surrounding elastic (pSE) element along each side that have an average elastic stiffness kpSE.
| (1) |
where Lm is the length of a myosin filament, δm is the distance between the myosin monomers heads, and nAMp and nAM are the fractions of attached strong and weak myosin cross-bridges. By assuming a particular normalized overlap distance L̄fo between the actin (thin) and myosin (thick) filaments, the total stiffness ktCU of a number of CUs (NCU) in series can be expressed as
| (2) |
The total active force Fa produced by NCU contractile units in series, with a pSE at each end (cf. Figure 2), can be expressed as
| (3) |
where upSE is the elongation and kpSE is the average stiffness of a pSE. Hence, the current length lSMC of the SMC model is
| (4) |
where LSMC is the reference length of the SMC model and ufs reflects filament sliding between the myosin and actin within a CU. Using equations (2)(3) and (4), the active first Piola-Kirchhoff stress Pa becomes
| (5) |
where NCF is the contractile fiber density (CF/unit area), λθ = lSMC/LSMC is the stretch of the representative SMC model, and ūfs = ufs/LSMC is the normalized filament sliding.
Filament sliding can occur either by cycling the cross-bridges or due to an externally imposed deformation. Thus the normalized filament sliding can be additively described as , where is the relative filament sliding linked to the elongation of the active cross-bridges and the pSE, and is the relative filament sliding caused by changes in λθ. The kinetics of the filament sliding caused by the cycling cross-bridges is described by the evolution law
| (6) |
where β is a fitting parameter and Fc is the total driving force in a CU caused by the cycling of cross-bridges; this driving force Fc represents the sum of all forces that rise due to the power-stroke from a single cycling cross-bridge. Hence, if an attached cycling cross-bridge with elastic stiffness kAMp elongates a distance ups due to a power-stroke, the total driving force in a CU can be expressed as
| (7) |
The myosin cross-bridges are highly dynamic, continuously attaching and detaching to the actin filaments when activated. Thus, any change in stretch λθ is assumed to be taken up by the mechanical filament sliding , whereby . The aforementioned filament overlap L̄fo is described by a Gaussian function that depends on filament sliding ūfs with a maximal filament overlap at an optimal filament sliding . That is,
| (8) |
where sfo > 0 is a fitting parameter and Lm is the average length of a myosin filament. The relationship between filament overlap and myosin filament length was motivated because a more uniform filament overlap distribution would be obtained with shorter myosin filament length.
Estimating values of elastic stiffness
The recruitment of attached cross-bridges can be determined using models of the kinetics of cross-bridge interactions such as the HM model (Hai and Murphy 1988) or the HHM model (Mijailovic et al. 2000). In the present model, the fractions of attached cross-bridges were set as constants at their steady-state values (ñAMp, ñAM), as suggested previously (Murtada et al. 2012). The rate of active tension development was thus regulated mainly by the fitting parameter β in the evolution law for filament sliding by prescribing constant values for the other parameters in equations (5)(6)(7).
The elastic stiffness of attached strong cross-bridges kAMp was determined through the evolution law for filament sliding at steady-state and optimal stretch (6) ( ), thus giving
| (9) |
where is the active stress at optimal stretch and is the filament overlap at optimal stretch. The elastic stiffness of the weak attached cross-bridges was set as kAM = 0.3kAMp (Murtada et al. 2012). With kAMp and kAM known, the elastic stiffness of the passive serial elastic component was obtained through the active stress equation (5)
| (10) |
where is the average steady-state elastic elongation of all attached cross-bridges at optimal muscle stretch.
Parameter sensitivity study
A sensitivity analysis was conducted to investigate relative contributions of particular values of the different model parameters on the magnitude and behavior of the active tone. The parameters studied were: the elastic stiffness of the passive surrounding element kpSE, the length of the myosin filament Lm, the number of CUs in series NCU, and the fraction of attached strong cross-bridges nAMp. Based on this sensitivity study, the model parameter(s) able to mimic changes in active tone observed in the experiments were used as targets for the adaptation model.
Phenomenological adaptation model
The adaptation of active tone was modeled phenomenologically, with the magnitude of the parameters identified as important through the parameter sensitivity analysis modulated via a dimensionless parameter q ∈ [0,1]. A system of two simple logistic differential equations, based on equations used to describe population dynamics and biological growth (Tsoularis et al. 2002), were used to describe the evolution of the adaptation parameter q. The rate of adaptation of q was assumed to depend on two key factors: the stretch in the circumferential direction λθ that corresponds to the mechanical state to which the SMCs were adapting and the concentration of the agonist [Ag] which triggered and set the rate of the adaptation. The agonist could be given exogenously or could correspond to an autocrine chemical stimulus generated by the SMCs when sensing a change in mechanical environment. The governing differential equations in the adaptation model are thus
| (11) |
and
| (12) |
where q̄[Ag] is a function of the agonist concentration and q̄λ is a function of the adaptation stretch . The functions q̄[Ag] and q̄λ were set so that . The parameter C[Ag] is the concentration of the agonist [Ag] that sets 50% of the maximal rate of adaptation , aλ is a fitting parameter, and τ[Ag] and τλ are time constants describing the rate of adaptation to the agonist concentration [Ag] and/or the stretch λθ.
Parameter estimation from data
The mathematical model of the contractile apparatus was formulated so that most model parameters could be associated with measureable values and obtained from experimental data found in the literature or collected herein. The fitting parameter β in the filament sliding evolution law was fit to data on the development of isometric contraction for 1–5 min at the optimal length. The parameter sfo was fit to stretch-tension data extracted after 5 min of isometric contraction at different stretches. The parameters aλ and τ[Ag] in the adaptation model were fit to data measured at 2 and 3 hours of adaptation at the low stretch. All model parameters were fitted using a least-square regression method.
Predictions of vascular adaptation by an intact vessel
To consider effects of active tone adaptation in the murine thoracic aorta in response to acute changes in pressure, we developed a model for a closed cylindrical vessel endowed with passive properties that result from multiple families of fibers and active properties that result from the SMC adaptation model. Assuming isochoric responses in short-term adaptations (hours), the equilibrium equations for an incompressible artery having closed ends and subjected to luminal pressure P and axial force f can be written as
| (13) |
where is the current cross-sectional area of the vessel, ri is the current inner radius, ro is the current outer radius, and σz and σθ are the axial and circumferential Cauchy stresses. Due to the incompressibility constraint, the volume of the artery can be expressed as
| (14) |
where lvessel and Lvessel are the current and reference axial length of the vessel. With lvessel = λzLvessel the current inner radius can be inferred as
| (15) |
where ro = λθRo.
The total Cauchy stress in the arterial wall was described as the sum of the passive and active stresses, where the passive response was described by the strain energy function Wp and the active response was described using the proposed SMC model oriented (on average) in the circumferential direction, thus
| (16) |
where p is a Lagrange multiplier that enforces the incompressibility, F is the deformation gradient tensor, and C = FTF the right Cauchy-Green tensor. The passive behavior of the arterial wall was modeled using a two-fiber family model (Holzapfel et al. 2000)
| (17) |
where I1 = trC and , with a unit vector describing the orientation of fiber family k through the angle computed relative to the axial direction. For simplicity, these fibers were assumed to be oriented in circumferential and axial directions, thus and . This assumption phenomenologically accounts for the typical diagonal orientation of collagen fibers while allowing the model to capture possible effects of lateral cross-links that have yet to be quantified rigorously. Other descriptions could be used similarly, including different fiber types and orientations for the media and adventitial in a bi-layered model.
The closed vessel was initially pressurized to 90 mmHg at a constant axial stretch (λz = 1.5), which was followed by a sustained decrease in pressure to consider possible adaptive changes in diameter and circumferential Cauchy stress. Three different cases of adaptation were simulated: that for a passive vessel without active SMC, that for a vessel with active SMCs, and that for an active vessel with active SMCs which could adapt.
Results
Experimental data and parameter estimation
Control length-tension phase
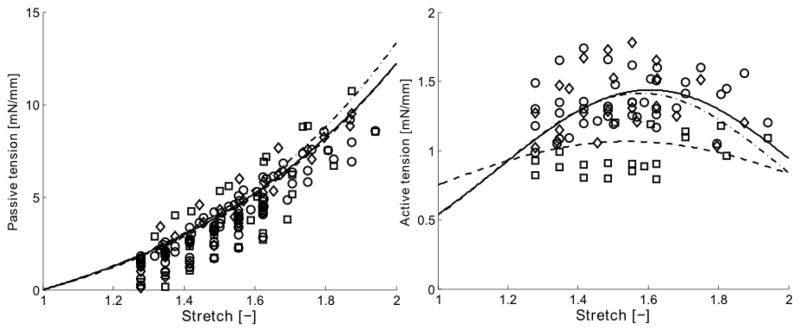
The mean optimal value of the muscle stretch was estimated under baseline conditions to be , which produced a mean maximal active tension . These values were determined by fitting a Gaussian function to data from isometric tests wherein the aortic rings were contracted at different values of stretch using 80 mM KCl (Figure 3). The Gaussian function was,
Fig. 3.
Mean circumferential tension-stretch results in passive (left) and active (right) states for aortic rings subjected to three different loading histories: (○) n = 16 control vessels, (□) n = 8 vessels following 3 hours of adaptation at a low stretch, and (◇) n = 8 vessels following 3 hours of adaptation near the optimal value of stretch. The curves show functional behaviors resulting from the assumed exponential (passive) and Gaussian (active) type relations, given in equations 19 and 18, respectively, together with the mean best-fit model parameters given in Table 1. These behaviors are represented as: (–) for controls, (– –) following adaptation at low stretch, and (–·–) following adaptation near the optimal stretch. The contractions in the active tension-stretch plot were induced by 80 mM KCl and the adaptations occurred while stimulated with 2 μM PE (cf. Fig. 1).
| (18) |
where a corresponds to the maximal active tension after 5 min of contraction, b to the optimal stretch , and c describes the width of the active tension distribution for different stretches. Best-fit values (mean ± SEM) of these parameters as well as those describing the baseline passive length-tension behavior are listed in Table 1. Note, therefore, that two passive parameters A and B described the mildly exponential passive behavior (Figure 3), which for the ring tests was given by
Table 1.
Best-fit parameters for the passive and active tension-stretch behavior based on experimental data from individual arterial rings excised from mouse proximal descending thoracic aorta (n = 16 for control rings and n = 8 for rings adapted at either low stretch (LS) or near optimal stretch (OS)). Shown, too, are normalized changes (“after” relative to “before”) in the active tension-stretch behavior for each type of test following adaptation.
| a [mN/mm] | b [-] | c [-] | aafter/abefore | bafter/bbefore | cafter/cbefore | A [mN/mm] | B [-] | |
|---|---|---|---|---|---|---|---|---|
| Control | 1.438 ± 0.039 | 1.604 ± 0.036 | 0.431 ± 0.123 | - | - | - | 3.835 ± 0.413 | 1.430 ± 0.103 |
| Adapt LS | 1.065 ± 0.050 | 1.544 ± 0.060 | 0.650 ± 0.091 | 0.736 ± 0.020 | 0.947 ± 0.029 | 1.541 ± 0.282 | 3.421 ± 0.720 | 1.519 ± 0.123 |
| Adapt OS | 1.415 ± 0.083 | 1.5785 ± 0.023 | 0.413 ± 0.022 | 0.9856 ± 0.020 | 1.0059 ± 0.022 | 1.0676 ± 0.093 | 3.493 ± 0.614 | 1.571 ± 0.141 |
| (19) |
Note that these two uniaxial relations, (18) and (19), were used to quantify and then compare the active and passive length-tension responses before and after adaptation in the ring tests. Circumferential stresses were calculated from tensions by setting the unloaded baseline value of wall thickness to 105 μm, with the media occupying 70% of the wall (Ferruzzi et al. 2015) resulting in a mean maximal active first Piola-Kirchhoff stress of .
Adaptation step
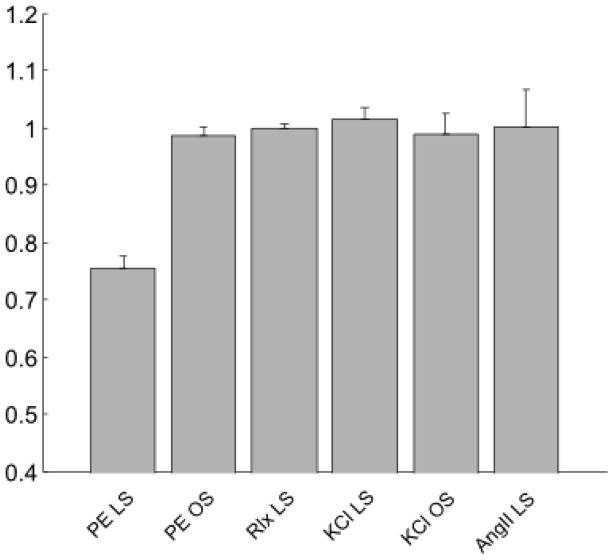
Recalling the very different contractile responses to the three agonists (KCl, PE, and AngII; Figure 1), note that aortic rings adapted at low stretch (below the optimal stretch) during a sustained PE-induced contraction showed a significant decrease in the magnitude of the isometric active tone over large range of stretches due to adaptation. As a result, the active length-tension relationship was less “bell-shaped” following adaptation at low stretch (Figure 3). In contrast, there was no significant change in the active length-tension behavior in rings adapted close to optimal stretch (Figure 3) and there was no significant change in the passive behavior in rings adapted at either the low or optimal stretch (Figure 3). A summary of all of the best fit parameters for equations (18) and (19) are in Table 1. Finally, no significant differences were found in the magnitude of the isometric active tone at optimal muscle stretch in rings adapted (i) during KCl-induced contractions at either the low or optimal stretch (no shown), (ii) during AngII exposure at low stretch, or (iii) when maintaining the rings passive at low stretch, all for 180 minute adaptation periods (Figure 4).
Fig. 4.
Maximum (normalized) active tension developed when the arterial rings were exposed to 80 mM KCl following adaptations at one of two different stretches while stimulated with one of three agonists: low stretch (LS) versus near the optimal stretch (OS) while stimulated with 2 μM phenylephrine (PE), relaxed with no contraction (Rlx), stimulated with 80 mM KCl (KCl), or stimulated with 2 μM angiotensin II (AngII). Note that each value of tension was normalized with the respective the control maximal active tension before adaptation. The PE groups represent mean behaviors with n = 8 per group and the other groups with n = 4 per group; the error bars show the standard error of the mean.
SMC model parameter fitting and behavior
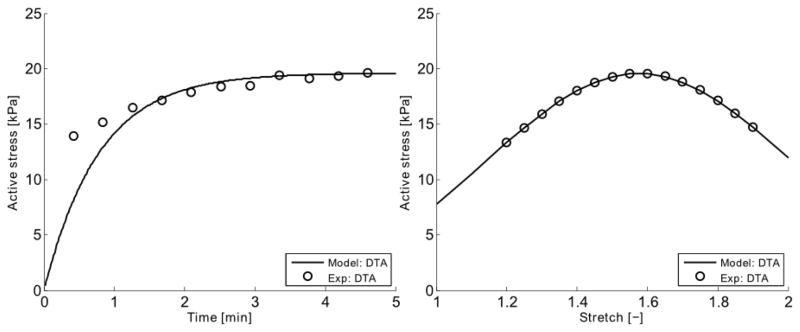
Parameters in the SMC model that could be associated with physically measureable values were taken from the literature (see Table 2.). Note, however, that due to the non-striated arrangements of myosin filaments in SMCs, the number of CUs in series can be difficult to estimate. Herein, the number of CUs in series was assumed to be Ncu = LSMC/(2Lm). Other parameters were fit to the experimental data collected in the present study. The elastic stiffness of the strong cross-bridges and the passive elastic stiffness were found to be kAMp = 1.423·10−3 N/m and kpSE = 4.371·10−4 N/m through equations (9) and (10). The parameter β in the evolution law for filament sliding was fit to the isometric active stress development data, namely = 1.616·10−4 s−1, see Figure 5.
Table 2.
Parameter values for the coupled smooth muscle contraction - adaptation model. See text for equations and further descriptions of the parameters.
| Parameter | Description | Value | Reference | |
|---|---|---|---|---|
| Smooth muscle model | ||||
| Lm | Myosin filament length | 0.3·10−6 [m] | [Liu et al. 2013, Devine & Somlyo 1971] | |
| δm | Distance between myosin monomer | 1.45·10−8 [m] | [Xu et al. 1996] | |
| LSMC | SMC length | 10−4 [m] | [Humphrey 2002] | |
| NCU | Number of CU in series in a CF | LSMC/(2Lm) | ||
| NCF | Number of CF over a unit area | 244·1012 [l/m2] | [Devine & Somlyo 1971] | |
| ups | Average elongation caused by P-S | 7·10−9 [m] | [Sweeney & Houdusse 2010] | |
| ñAMp | Fraction of attached strong x-bridges | 0.389 [-] | [Murtada et al. 2012] | |
| ñAM | Fraction of attached weak x-bridges | 0.556 [-] | [Murtada et al. 2012] | |
| kAMp | Elastic stiffness of strong x-bridges | 1.423·10−3 [N/m] | Eq. (9) | |
| kAM | Elastic stiffness of weak x-bridges | 0.3kAMp | [Murtada et al. 2012] | |
| kpSE | Elastic stiffness of cell cortex | 4.371·10−4 [N/m] | Eq (10) | |
| β |
Fitting parameter to
|
1.616·104 [l/s] | Fitting to experiments | |
| sfo | Fitting parameter for filament overlap | 3.919·10−10 [m] | Fitting to experiments | |
|
|
Filament sliding for max filament overlap | 1.753·10−3 [-] | Eq (4) | |
|
|
Maximal elongation of elastic components | 0.02 [-] | [Arner 1982] | |
|
|
Muscle stretch for maximal active tension | 1.604 [-] | ||
|
|
Maximal active tension for DTA | 1.438 [mN/mm] | ||
|
|
Maximal active 1st PK stress for DTA | 19.57·103 [Pa] | ||
| Ro | Unloaded outer diameter | 827·10−6 [m] | [Ferruzzi et al. 2015] | |
| H | Unloaded wall thickness | 105·10−6 [m] | [Ferruzzi et al. 2015] | |
| hm | Medial wall thickness ratio | 0.7 [-] | [Ferruzzi et al. 2015] | |
| Adaptation model | ||||
| C[Ag] | Concentration of agonist for 50% adaptation rate | 2·10−6 [M] | [Davis et al. 2012] | |
| aλ | Fitting parameter to stretch adaptation | 0.691 [-] | Fitting to experiments | |
| τ[Ag] | Time constant related to agonist | 2.230·103 [s] | Fitting to experiments | |
| τλ | Time constant for adaptation | τ[Ag] | ||
| Passive model | ||||
| μe | Isotropic elastic modulus | 16.03·103 [Pa] | Fitting to experiments | |
|
|
Material parameter for fibers | 34.93·103 [Pa] | Fitting to experiments | |
|
|
Material parameter for fibers | 0.007 [-] | Fitting to experiments | |
Fig. 5.
The smooth muscle model (–) was fit to isometric active first Piola-Kirchhoff stress data (○) extracted near the optimal value of circumferential stretch. Shown are the early development of active stress upon stimulation (left) and the mean active stretch-stress behavior following 5 min of contraction (right). Note that it was assumed that no adaptation occurs within the initial 5 minutes of stimulation, hence yielding the virgin behavior. This fit was obtained by setting kAMp = 1.423·10−3 N/m, kpSE = 4.371·10−4 N/m, and = 1.616·104 s−1
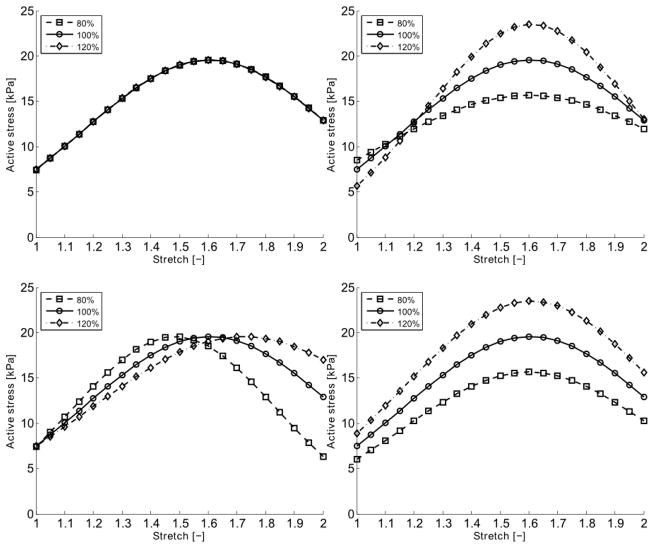
Predicted changes in the maximal magnitude of the active tone were only achieved by altering the values of the length of the myosin filaments Lm and the fraction of the attached strong cross-bridges nAMp (Figure 6). Changing the myosin length was also able to capture the flattening of the “bell-shaped” active stretch-stress relationship observed in the adaptation experiments (cf. Figure 3), and was chosen as the target in the SMC-adaptation model, Lm = L̃m·q(λ,[Ag],t) where L̃m is the original value of the myosin length. The fitting parameter aλ in the adaptation model was found to aλ = 0.691 and the time constant τ[Ag] = 2.230·10−3 s by (i) fitting the coupled SMC-adaptation model to data collected at 120 and 180 minutes at low stretch (λθ = 1.191) and (ii) assuming that the isometric active tension development triggered by PE had reached steady-state within 120 minutes of contraction. The half-activation parameter C[Ag] for adaptation achieved with PE was set to the same concentration as the half-activation concentration for active tension development with PE (Davis et al. 2012). A summary of all the material parameters used in the SMC model can be found in Table 2.
Fig. 6.
Model predicted active stress – stretch behaviors when setting the values of kpSE (upper left), Lm (upper right), NCU (lower left) and ñAMp (lower right) to 80%, 100% or 120% of their original values. The active stress is given as first Piola-Kirchhoff stress in kPa.
Model simulations of active tone adaptation
Arterial Rings
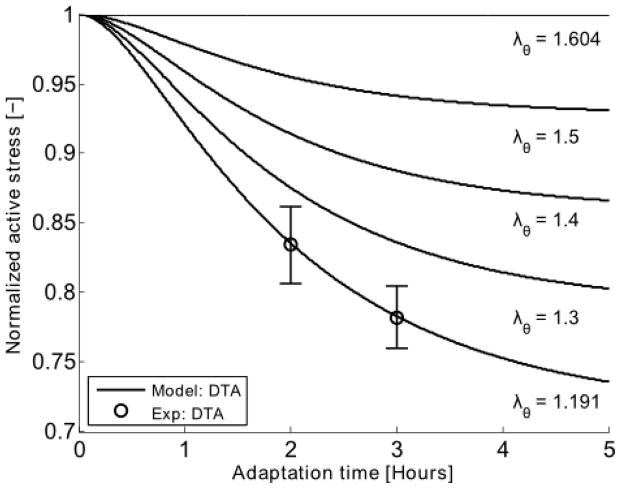
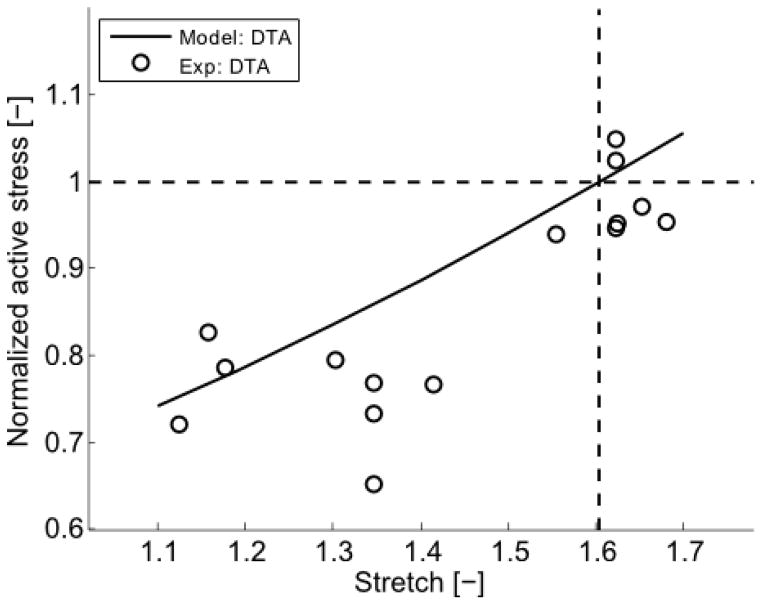
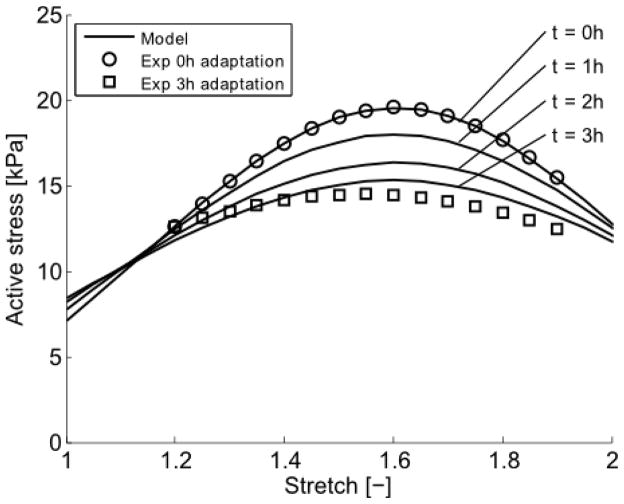
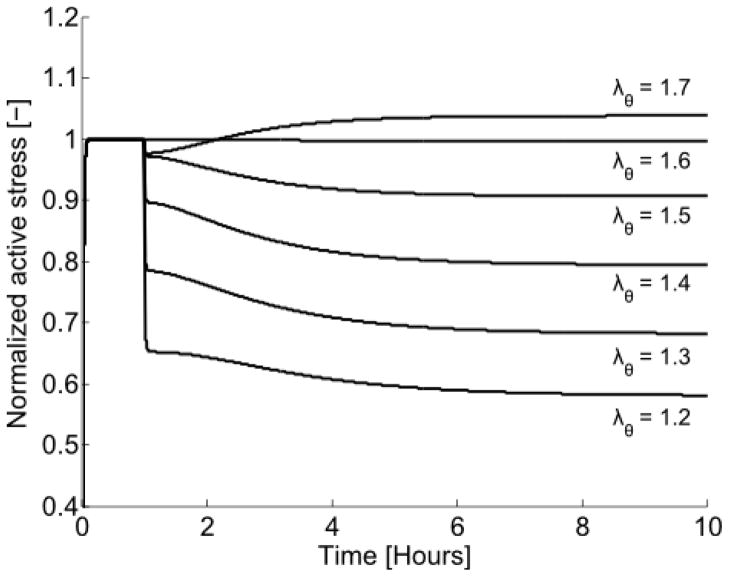
A simulated adaptation was triggered by setting the concentration of the agonist [Ag] = 2 μM and stopped by setting [Ag] = 0. With the fitted values in the adaptation model, an altered behavior due to a change in active tone could be simulated for different values of adaptation stretches and after different durations of stretch adaptations (Figure 7). When simulating a change in active tone after 180 min of adaptation at different adaptation stretches, the model was able to reproduce experimental observations (Figure 8). The complete change in model-predicted active stretch-stress behaviors after 0, 60, 120, and 180 min of stretch adaptations can be found in Figure 9. The active stress behavior for a sudden perturbation in stretch was also simulated. The model vessel was initially contracted at optimal stretch and the effect of the filament overlap on the adaptation was simulated by changing the stretch to different values and holding it constant for a longer time, see Figure 10.
Fig. 7.
Model predicted (–) changes in active stress generation at the optimal circumferential stretch (λθ = 1.604) for vessels previously adapted at particular values of stretch (from 1.191 to 1.604) for durations ranging from 0 to 5 hours. The model parameters were obtained by fitting mean experimental data (○) for n = 4 aortic rings adapted at λθ = 1.191 for 2 and 3 hours. It was assumed that the steady-state isometric active tone triggered through PE contraction was reached before 2 h of contraction. The error bar represents the standard error of the mean.
Fig. 8.
Model predicted (–) values of normalized active stress generation at the optimal stretch when previously adapted for 3 hours at different values of stretch (abscissa). Experimental data (○) are shown for comparison; note that the model was not fit to all of these data, but rather was based on limited data shown in Figure 7. As expected, the model predicts that there would be no change in active stress generation at the optimal stretch if the vessel were “adapted” at the optimal stretch (cross-over of horizontal and vertical lines), consistent with the experimental findings.
Fig 9.
Comparison of predicted (–), following 0, 1, 2 and 3 hours of adaptation at λθ = 1.191, and measured, following 0 (○) and 3 (□) hours of adaptation, active stretch-stress behaviors. The active stress is given as first Piola-Kirchhoff stress in kPa.
Fig. 10.
Model prediction of active stress generation for a sudden change in isometric stretch λθ. The model was initially contracted at the optimal stretch ( ) for 1 hour, then perturbed by changing the stretch to a value from λθ = 1.2–1.7 and holding that stretch constant for the subsequent 9 hours.
Cylindrical Vessels
The possible effects of active tone adaptation were studied further by implementing the proposed SMC adaptation within a model of a closed-ended aorta having an unloaded outer diameter Ro = 827 μm and unloaded wall thickness H = 105μm (Ferruzzi et al. 2015). This model vessel was loaded with an internal pressure of 90 mmHg at a fixed axial stretch λz; = 1.5. Because of the fixed axial stretch, we focused on equilibrium in the circumferential direction, namely equation (13). The material parameters in the passive fiber-reinforced model were determined by fitting the present passive experimental data (Figure 3), but scaled such that the circumferential stretch was for 90 mmHg and λz; = 1.5.
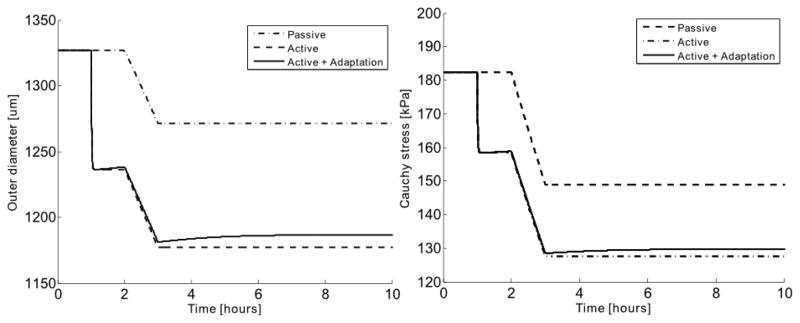
By simulating a pressure drop from 90 mmHg to 80 mmHg, the change in outer diameter and circumferential Cauchy stress was studied for a passive vessel, a vessel with active smooth muscle that did not adapt, and a vessel with active smooth muscle that did adapt (Figure 11). It was found that the adaptive function of the active smooth muscle tone had a stabilizing effect in the vessel, which reduced the overall change in stress due to the pressure drop. When pressure decreased, the active tone in the vessel reduced through adaptive remodeling, thus resulting in a partial recovery of the reduced outer diameter and circumferential stress (Figure 11).
Fig. 11.
Model predicted changes in outer diameter (left) and mean circumferential Cauchy stress (right) of a closed vessel pressurized at 90 mmHg at an axial stretch λz = 1.5. The evolution of these quantities was simulated following a sudden decrease in pressure to 80 mmHg after 2 hours for a vessel with no active smooth muscle (passive), with unchanging active smooth muscle, or with active smooth muscle that adapts. Note that the smooth muscle activity, if any, was triggered at 1 hour, which was 1 hour prior to the step decrease in pressure.
Discussion
Given the continuing lack of information on possible roles of adaptation of smooth muscle contractility in large artery remodeling, we performed novel short-term adaptation experiments on the murine descending thoracic aorta (DTA) and developed an associated biomechanical model that was shown both to describe the experimental data well and to allow simulations of possible adaptations under hypotensive conditions.
Sustained 3-hour contractions of aortic rings at their optimal stretch did not result in any adaptive changes, thus suggesting that the muscle is inherently adapted to function best at its optimal stretch. Conversely, sustained exposures to phenylephrine at a stretch lower than the optimal value resulted in a marked adaptation in active tone. Interestingly, exposures to KCl did not result in an adaptive response when contracted for three hours at low stretch. Although levels of baseline contractions were similar for KCl and PE (cf. Figure 1), the magnitude of contraction was significantly lower in the KCl versus the PE case at low stretch. It would be useful in future studies, therefore, to study possible adaptations at low stretch under similar levels of contractility. It should be noted that high KCl induces contraction through membrane depolarization, which mainly causes contraction by increasing the intracellular calcium concentration and thus myosin light chain kinase (MLCK) activity. In contrast, PE-induced contraction may occur through calcium sensitization in addition to an increase in intracellular calcium concentration, which is regulated by a network of signaling pathways that trigger other events such as actin polymerization. Studies have also shown that stretch of the vascular wall stimulates actin polymerization (Albinsson et al. 2004). Hence, these inherent differences between KCl- and PE-induced contractions, such as catalyzing actin polymerization, may have a role in acute adaptations of the active tone in the DTA and merit further study.
Angiotensin-II binds mainly to two receptors, the AT1 receptor, which results in vasoconstriction as well as general growth and remodeling via the turnover of extracellular matrix, and the AT2 receptor, which can induce vasodilation and inhibit effects of AT1 receptor binding. The AT1 receptor is member of the transmembrane family of G-protein (alpha-subunit) coupled receptors, which in mice can be divided into two subgroups, AT1a and AT1b. The AT1a receptor is considered to have a major role in regulating cardiovascular functions, including growth and remodeling through matrix turnover within the arterial wall, whereas the AT1b receptor is linked to contractile responses to agonist stimulation (Zhou et al. 2003a). The murine DTA exhibited a very weak, transient isometric active force generation when contracted with Ang II, consistent with other reports in the literature (Russells et al. 2000, Zhou et al. 2003b). Hence, no overall change in active tone was observed in the attempt to adapt the vessel with Ang II. It is likely that a strong active contraction is necessary for active tone adaptation in vascular SMC, which would explain why there was no adaptation at either the optimal or the low stretch during Ang II stimulation. It may be that there are too few AT1b receptors in the DTA, as suggested previously (Zhou et al. 2003a).
The model prediction of changes in active tone versus adaptation stretch (Figure 8) suggest that the optimal stretch appears to be a preferred state, not only for maximal active tension generation but also where no acute adaptive changes occur. Of course, any changes from the optimal muscle length will be expected to affect SMC tone and thus circumferential stress. Pilot attempts to study adaptation at high stretches (not shown) suggested a possible increase of active tone, but these experiments were difficult to perform without damaging the arterial rings due to the high local contact stresses at the pins that held the specimens within the myograph.
No significant horizontal shifts in the active length-tension behavior were observed after any active tone adaptation (p > 0.05 for both groups). The main change was in the magnitude of the active length-tension behavior near low stretch (p < 0.00005). A parameter sensitivity study revealed that a change in myosin length mimicked the changes in active tone after adaptation at low stretch most accurately. Recall that only a few of the parameters in the proposed mathematical model were fit to the current isometric contraction, length-tension, and adaptation data. Most of the parameters were inferred from information in the literature.
The elastic stiffness of the cycling cross-bridges in the smooth muscle cells was calculated to be 1.345 pN/nm for the proposed model. In skeletal muscle, the elastic stiffness of cross-bridges has been estimated to be 1–2.2 pN/nm (Barclay 1998) and 2 pN/nm (Huxley and Tideswell 1996), hence the current value is within a reasonable range. The cortical stiffness may allow a cell to adjust its stiffness to its neighboring environment. Associated values for human mesenchymal stem cells have been estimated to be 2 kPa (Tee et al. 2011) which, by considering a cortical thickness of 50–2000 nm (Bray and White 1988), can also be given as 0.1–4.0 pN/nm. The model value of the passive cortical stiffness was 0.4371 pN/nm, which lies within a reasonable range. The thin and thick filaments in the present model were modeled as rigid. Given that the stiffness of the myofilaments has been shown to be in the same range as the stiffness of the cross-bridges (Edman 2009), the approximated mean elasticity presented here would more accurately represent the mean for the myofilaments plus the cross-bridges. The cytoskeleton consists of microtubules, intermediate filaments, and actin filaments, all of which contribute to the passive stiffness in smooth muscle cells. That actin filaments are part of both the contractile unit and the actin cortex was addressed, in part, in the present work by introducing the passive surrounding elements. Martinez-Lemus et al. (2009) discuss the possible impact of the actin cytoskeleton and its ability to polymerize and depolymerize during adaptation. In the present model, only the change in passive surrounding elements representing the actin cortex during adaptation was explored.
The isometric contraction using PE-induced contraction is different in many ways from that due to KCl-induced contraction. One aspect is that it takes longer to reach steady-state for a PE-induced contraction compared to KCl-induced contraction (see figure 1). The isometric force was in fact still increasing after one hour of PE-induced contraction. Consequently, it was difficult to establish if the measured active force was only isometric force development or a sum of active force development and a decrease in active force due to active tone adaptation. The material parameters in the adaptation model were determined based on an assumption that steady-state active force during PE-induced contraction was reached before 2 hours of contraction at low stretch and thus fit only to the change in active tone measured at 2 hours and 3 hours of PE-induced contraction.
Using the proposed mathematical model, it was found that changes in the length of the myosin filaments were able to explain the observed change in magnitude of the active tone. Studies have reported a mean length for myosin ranging from 0.1–0.2 μm (Liu et al. 2013) to 0.6 μm (Devine and Somlyo 1971). In a recent study, the length of the myosin filament was observed to have a dynamic character during contraction and relaxation in sheep pulmonary and rabbit carotid arterial SMC (Liu et al. 2013), thus suggesting a dynamic myosin length could be involved in the active tone adaptation as suggested in the present work. Yet, assuming a fixed pool of myosin monomers, the dynamic myosin filament length would also affect the myosin filament density during adaptation. Similar to myosin length, the myosin filament density varies between contraction and relaxation. The average myosin filament density in porcine tracheal smooth muscle is about 60.8 filaments/μm2 in a relaxed state and 148.4 filaments/μm2 in a contracted state (Herrera et al. 2002). Similarly, the mean myosin filament density in rabbit portal-anterior mesenteric vein was estimated between 160–328 filaments/um2 (Devine and Somlyo 1971). In the present work, a constant value of 244 filaments/um2 was used for the filament density.
By simulating a pressure drop for closed-ended aorta, it was found that the adaptive function had a stabilizing effect for the circumferential Cauchy stress in the vessel. The recovery in stress for a vessel with an adaptive function was nevertheless relatively small in response to a sudden pressure drop. The model predictions were based on adaptation tests conducted on ring samples. The importance of the biaxial (circumferential and axial) state of stress state has been shown previously to have a key role in determining both the passive mechanical behavior of the arterial wall (Ferruzzi et al. 2013) and long-term adaptive changes in response to altered hemodynamic loading (Humphrey et al., 2009). There is a need to extend the present work to biaxial settings both experimentally and theoretically e.g. using a 3D finite element framework (Murtada et al. 2014). The orientation of the vascular smooth muscle cells can also play an important role in dictating the magnitude of active tension. Hence, a change in the orientation of the smooth muscle cells during adaptation could affect the active tone measured in the circumferential direction. Again, future studies are needed for we did not assess the role of SMC orientation either experimentally or theoretically. Moreover, we emphasize that the present study focused only on changes in contractile properties within a time frame wherein major changes in passive properties were unlikely. Hence, there is also a need for future studies to investigate possible intermediate-term changes in biaxial active properties and their possible contributions to overall arterial adaptation.
Summary
Smooth muscle cells subjected to sustained, short-term contractions at their optimal circumferential stretch do not adapt, hence suggesting that this length is a homeostatic value. In contrast, acute, but evolving, adaptive changes in active tone were observed in vascular SMCs when aortic rings were exposed to sustained phenylephrine-induced contractions at a reduced circumference stretch. We conclude that adaptations in active tone may be important in large (murine) arteries just as they are in resistance arteries, not just in long-term adaptations as known for many years, but also in short-term adaptations that have not been quantified previously. Because of the complexity of the contractile apparatus, and its complementary role in remodeling the passive extracellular matrix, mathematical models will continue to help in the interpretation of experimental findings and provide increasing insight.
Acknowledgments
This work was supported, in part, by a grant (#2012419) from the ‘Swedish Research Council’ and grants from the US NIH (HL105297 and EB016810).
References
- Albinsson S, Nordström I, Hellstrand P. Stretch of the vascular wall induces smooth muscle differentiation by promoting actin polymerization. J Biol Chem. 2004;279(33):34849–55. doi: 10.1074/jbc.M403370200. [DOI] [PubMed] [Google Scholar]
- Arner A. Mechanical characteristics of chemically skinned guinea-pig taenia coli. Eur J Physiol. 1982;395:277–284. doi: 10.1007/BF00580790. [DOI] [PubMed] [Google Scholar]
- Arner A, Malmqvist U, Uvelius B. Structural and mechanical adaptations in rat aorta in response to sustained changes in arterial pressure. Acta Physiol Scand. 1984;122(2):119–26. doi: 10.1111/j.1748-1716.1984.tb07489.x. [DOI] [PubMed] [Google Scholar]
- Bakker EN, van der Meulen ET, van den Berg BM, Everts V, Spaan JA, VanBavel E. Inward remodeling follows chronic vasoconstriction in isolated resistance arteries. J Vasc Res. 2002;39(1):12–20. doi: 10.1159/000048989. [DOI] [PubMed] [Google Scholar]
- Bakker EN, Buus CL, VanBavel E, Mulvany MJ. Activation of resistance arteries with endothelin-1: from vasoconstriction to functional adaptation and remodeling. J Vasc Res. 2004;41(2):174–82. doi: 10.1159/000077288. [DOI] [PubMed] [Google Scholar]
- Bakker EN, Matlung HL, Bonta P, de Vries CJ, van Rooijen N, Vanbavel E. Blood flow-dependent arterial remodelling is facilitated by inflammation but directed by vascular tone. Cardiovasc Res. 2008;78(2):341–8. doi: 10.1093/cvr/cvn050. [DOI] [PubMed] [Google Scholar]
- Barclay CJ. Estimation of cross-bridge stiffness from maximum thermodynamic efficiency. J Muscle Res Cell Motil. 1998;19(8):855–64. doi: 10.1023/a:1005409708838. [DOI] [PubMed] [Google Scholar]
- Bray D, White JG. Cortical flow in animal cells. Science. 1988;239(4842):883–8. doi: 10.1126/science.3277283. [DOI] [PubMed] [Google Scholar]
- Buus CL, Pourageaud F, Fazzi GE, Janssen G, Mulvany MJ, De Mey JG. Smooth muscle cell changes during flow-related remodeling of rat mesenteric resistance arteries. Circ Res. 2001;89(2):180–6. doi: 10.1161/hh1401.093575. [DOI] [PubMed] [Google Scholar]
- Böl M, Schmitz A, Nowak G, Siebert T. A three-dimensional chemo-mechanical continuum model for smooth muscle contraction. J Mech Behav Biomed Mater. 2012;13:215–29. doi: 10.1016/j.jmbbm.2012.05.015. [DOI] [PubMed] [Google Scholar]
- Dajnowiec D, Langille BL. Arterial adaptations to chronic changes in haemodynamic function: coupling vasomotor tone to structural remodelling. Clin Sci (Lond) 2007;113(1):15–23. doi: 10.1042/CS20060337. [DOI] [PubMed] [Google Scholar]
- Davis B, Rahman A, Arner A. AMP-activated kinase relaxes agonist induced contractions in the mouse aorta via effects on PKC signaling and inhibits NO-induced relaxation. Eur J Pharmacol. 2012;695(1–3):88–95. doi: 10.1016/j.ejphar.2012.07.025. [DOI] [PubMed] [Google Scholar]
- Devine CE, Somlyo AP. Thick filaments in vascular smooth muscle. J Cell Biol. 1971;49(3):636–49. doi: 10.1083/jcb.49.3.636. [DOI] [PMC free article] [PubMed] [Google Scholar]
- Edman KA. Non-linear myofilament elasticity in frog intact muscle fibres. J Exp Biol. 2009;212:1115–9. doi: 10.1242/jeb.020982. [DOI] [PubMed] [Google Scholar]
- Ferruzzi J, Bersi MR, Humphrey JD. Biomechanical phenotyping of central arteries in health and disease: Advantages of and methods for murine models. Annl Biomed Engr. 2013;41:1311–1130. doi: 10.1007/s10439-013-0799-1. [DOI] [PMC free article] [PubMed] [Google Scholar]
- Ferruzzi J, Bersi MR, Uman S, Yanagisawa H, Humphrey JD. Decreased elastic energy storage, not increased material stiffness, characterizes central artery dysfunction in fibulin-5 deficiency independent of sex. J Biomech Eng. 2015;137(3) doi: 10.1115/1.4029431. [DOI] [PMC free article] [PubMed] [Google Scholar]
- Hai CM, Murphy RA. Cross-bridge phosphorylation and regulation of latch state in smooth muscle. Am J Physiol. 1988;254:C99–106. doi: 10.1152/ajpcell.1988.254.1.C99. [DOI] [PubMed] [Google Scholar]
- Herlihy JT, Murphy RA. Length-tension relationship of smooth muscle of the hog carotid artery. Circ Res. 1973;33(3):275–83. doi: 10.1161/01.res.33.3.275. [DOI] [PubMed] [Google Scholar]
- Herrera AM, Kuo KH, Seow CY. Influence of calcium on myosin thick filament formation in intact airway smooth muscle. Am J Physiol Cell Physiol. 2002;282(2):C310–6. doi: 10.1152/ajpcell.00390.2001. [DOI] [PubMed] [Google Scholar]
- Holzapfel GA, Gasser TC, Ogden RW. A new constitutive framework for arterial wall mechanics and a comparative study of material models. J Elasticity. 2000;61:1–48. [Google Scholar]
- Humphrey JD. Cells, tissues and organs. Springer; NY: 2002. Cardiovascular Solid Mechanics. [Google Scholar]
- Humphrey JD, Eberth JF, Dye WW, Gleason RL. Fundamental role of axial stress in compensatory adaptations by arteries. J Biomech. 2009;42:1–8. doi: 10.1016/j.jbiomech.2008.11.011. [DOI] [PMC free article] [PubMed] [Google Scholar]
- Huxley AF, Tideswell S. Filament compliance and tension transients in muscle. J Muscle Res Cell Motil. 1996;17(4):507–11. doi: 10.1007/BF00123366. [DOI] [PubMed] [Google Scholar]
- Langille BL, Dajnowiec D. Cross-linking vasomotor tone and vascular remodeling: a novel function for tissue transglutaminase? Circ Res. 2005;96(1):9–11. doi: 10.1161/01.RES.0000153883.55971.81. [DOI] [PubMed] [Google Scholar]
- Liu JC-Y, Rottler J, Wang L, Zhang J, Pascoe CD, Lan B, Norris BA, Herrera AM, Paré PD, Seow CY. Myosin filaments in smooth muscle cells do not have a constant length. J Physiol. 2013;19(23):5867–5878. doi: 10.1113/jphysiol.2013.264168. [DOI] [PMC free article] [PubMed] [Google Scholar]
- Martinez-Lemus LA, Hill MA, Bolz SS, Pohl U, Meininger GA. Acute mechanoadaptation of vascular smooth muscle cells in response to continuous arteriolar vasoconstriction: implications for functional remodeling. FASEB J. 2004;18(6):708–10. doi: 10.1096/fj.03-0634fje. [DOI] [PubMed] [Google Scholar]
- Martinez-Lemus LA. Persistent agonist-induced vasoconstriction is not required for angiotensin II to mediate inward remodeling of isolated arterioles with myogenic tone. J Vasc Res. 2008;45(3):211–21. doi: 10.1159/000112513. [DOI] [PubMed] [Google Scholar]
- Martinez-Lemus LA, Hill MA, Meininger GA. The plastic nature of the vascular wall: a continuum of remodelling events contributing to control of arteriolar diameter and structure. Physiology. 2009;24:45–57. doi: 10.1152/physiol.00029.2008. [DOI] [PubMed] [Google Scholar]
- Mijailovich SM, Butler JP, Fredberg JJ. Perturbed equilibria of myosin binding in airway smooth muscle: bond-length distributions, mechanics, and ATP metabolism. Biophys J. 2000;79(5):2667–81. doi: 10.1016/S0006-3495(00)76505-2. [DOI] [PMC free article] [PubMed] [Google Scholar]
- Murtada S-I, Kroon M, Holzapfel GA. A calcium-driven mechanochemical model for prediction of force generation in smooth muscle. Biomech Model Mechanobiol. 2010;9(6):749–62. doi: 10.1007/s10237-010-0211-0. [DOI] [PubMed] [Google Scholar]
- Murtada S-I, Arner A, Holzapfel GA. Experiments and mechanochemical modeling of smooth muscle contraction: significance of filament overlap. J Theor Biol. 2012;297:176–86. doi: 10.1016/j.jtbi.2011.11.012. [DOI] [PubMed] [Google Scholar]
- Murtada S-I, Holzapfel GA. Investigating the role of smooth muscle cells in large elastic arteries: A finite element analysis. J Theor Biol. 2014;358:1–10. doi: 10.1016/j.jtbi.2014.04.028. [DOI] [PubMed] [Google Scholar]
- Russell A, Watts S. Vascular reactivity of isolated thoracic aorta of the C57BL/6J mouse. J Pharmacol Exp Ther. 2000;294(2):598–604. [PubMed] [Google Scholar]
- Somlyo AP, Somlyo AV. Ca2+ sensitivity of smooth muscle and nonmuscle myosin II: modulated by G proteins, kinases, and myosin phosphatase. Physiol Rev. 2003;83(4):1325–58. doi: 10.1152/physrev.00023.2003. [DOI] [PubMed] [Google Scholar]
- Stålhand J, Klarbring A, Holzapfel GA. Smooth muscle contraction: mechanochemical formulation for homogeneous finite strains. Prog Biophys Mol Biol. 2008;96(1–3):465–81. doi: 10.1016/j.pbiomolbio.2007.07.025. [DOI] [PubMed] [Google Scholar]
- Sweeney HL, Houdusse A. Structural and functional insights into the Myosin motor mechanism. Annu Rev Biophys. 2010;39:539–57. doi: 10.1146/annurev.biophys.050708.133751. [DOI] [PubMed] [Google Scholar]
- Tee SY, Fu J, Chen CS, Janmey PA. Cell shape and substrate rigidity both regulate cell stiffness. Biophys J. 2011;100(5):L25–7. doi: 10.1016/j.bpj.2010.12.3744. [DOI] [PMC free article] [PubMed] [Google Scholar]
- Tsoularis A, Wallace J. Analysis of logistic growth models. Math Biosci. 2002;179(1):21–55. doi: 10.1016/s0025-5564(02)00096-2. [DOI] [PubMed] [Google Scholar]
- Tuna BG, Bakker EN, VanBavel E. Relation between active and passive biomechanics of small mesenteric arteries during remodeling. J Biomech. 2013;46(8):1420–6. doi: 10.1016/j.jbiomech.2013.03.010. [DOI] [PubMed] [Google Scholar]
- Valentín A, Cardamone L, Baek S, Humphrey JD. Complementary vasoactivity and matrix remodelling in arterial adaptations to altered flow and pressure. J R Soc Interface. 2009;6(32):293–306. doi: 10.1098/rsif.2008.0254. [DOI] [PMC free article] [PubMed] [Google Scholar]
- Xu JQ, Harder BA, Uman P, Craig R. Myosin filament structure in vertebrate smooth muscle. J Cell Biol. 1996;134(1):53–66. doi: 10.1083/jcb.134.1.53. [DOI] [PMC free article] [PubMed] [Google Scholar]
- Zhou Y, Chen Y, Dirksen WP, Morris M, Periasamy M. AT1b receptor predominantly mediates contractions in major mouse blood vessels. Circ Res. 2003a;93(11):1089–94. doi: 10.1161/01.RES.0000101912.01071.FF. [DOI] [PubMed] [Google Scholar]
- Zhou Y, Dirksen WP, Babu GJ, Periasamy M. Differential vasoconstrictions induced by angiotensin II: role of AT1 and AT2 receptors in isolated C57BL/6J mouse blood vessels. Am J Physiol Heart Circ Physiol. 2003b;285(6):H2797–803. doi: 10.1152/ajpheart.00466.2003. [DOI] [PubMed] [Google Scholar]


