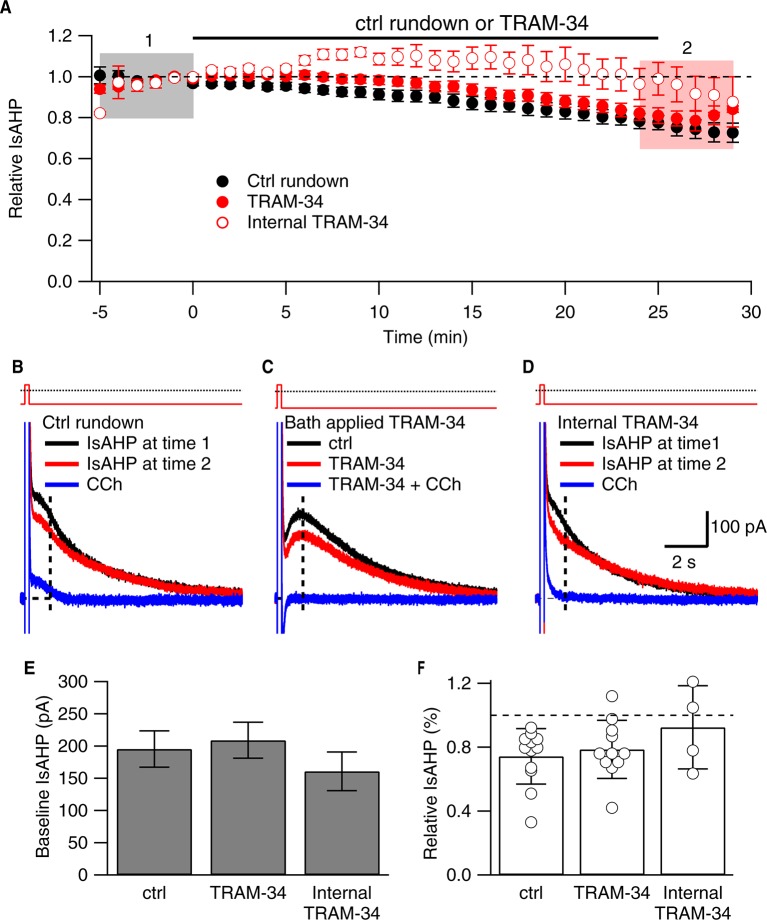
Figure 1. TRAM-34 (1 µM; 22-24˚C) does not affect the IsAHP.
(A) Time course of the normalized amplitude of the IsAHP from control rundown (ctrl, closed black symbols), or TRAM-34 treated cells either bath applied (closed red symbols) or internally delivered (open red symbols) in CA1 pyramidal neurons. (B, C, D) Representative CA1 pyramidal neuron tail currents elicited by the voltage protocol shown above the traces for control rundown (B), bath applied TRAM-34 (C) and internally delivered TRAM-34 (D) at −5 to 0 min (black), 25-30 min (red) and 10– 15 min after CCh application (blue). Vertical dash line at 1 sec after the pulse indicates time point for IsAHP measurement in time course plot of (A). (E) Bar plot of the amplitudes of the IsAHP during a 5 min baseline period for control rundown (Ctrl), bath applied TRAM-34 and internal TRAM-34. (F) Bar plot of the IsAHP measured at 25–30’ (red shaded area panel A) relative to 5 min baseline (black shaded area panel A) for control rundown (Ctrl; n = 10) and bath applied TRAM-34 (n = 11) and internal TRAM-34 (n = 4). Error bars are ± SEM.

