Figure 3. Environment classification.
(a) City classification searchlight revealed a cluster of above chance classification performance throughout much of left CA3/DG and CA1. (b) Pie chart of distribution of voxels in the searchlight showing their predominance in CA3/DG and CA1. (c) Classifier performance of each city revealed above chance performance on cities 1, 2, and 4 and below chance performance on city 3. Further analysis of city 3 classification performance revealed above-chance misclassification of city 3 trials as cities 1 & 2. (d) City 3 (interference city) retrieval performance and city 3 classifier performance were positively correlated. *p<0.05, **p<0.01.

Figure 3—figure supplement 1. Classifier trained with matched number of trials from each city.

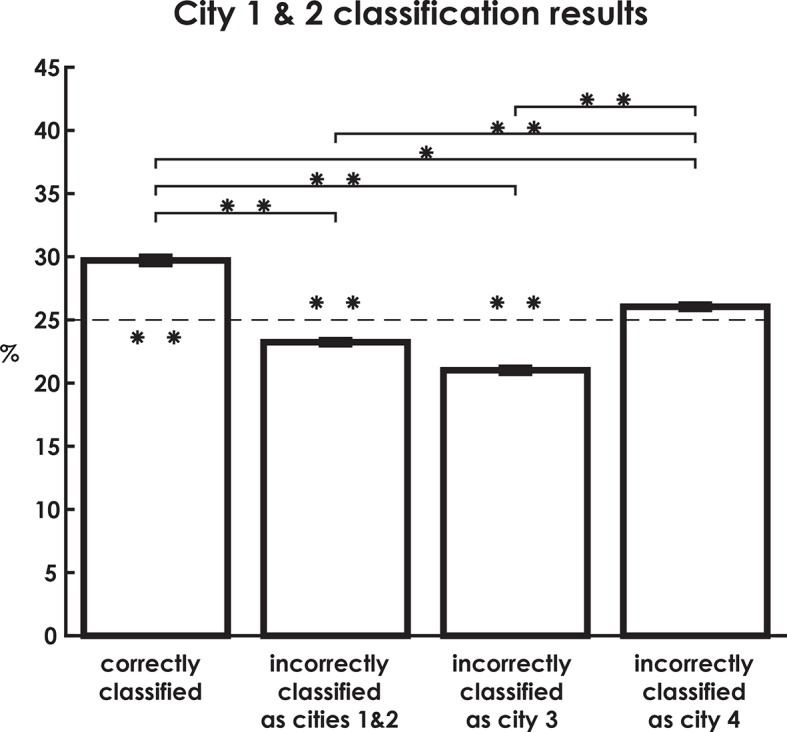
Figure 3—figure supplement 2. City 1 & 2 classification results broken down by correctly classified and incorrectly classified as each city.