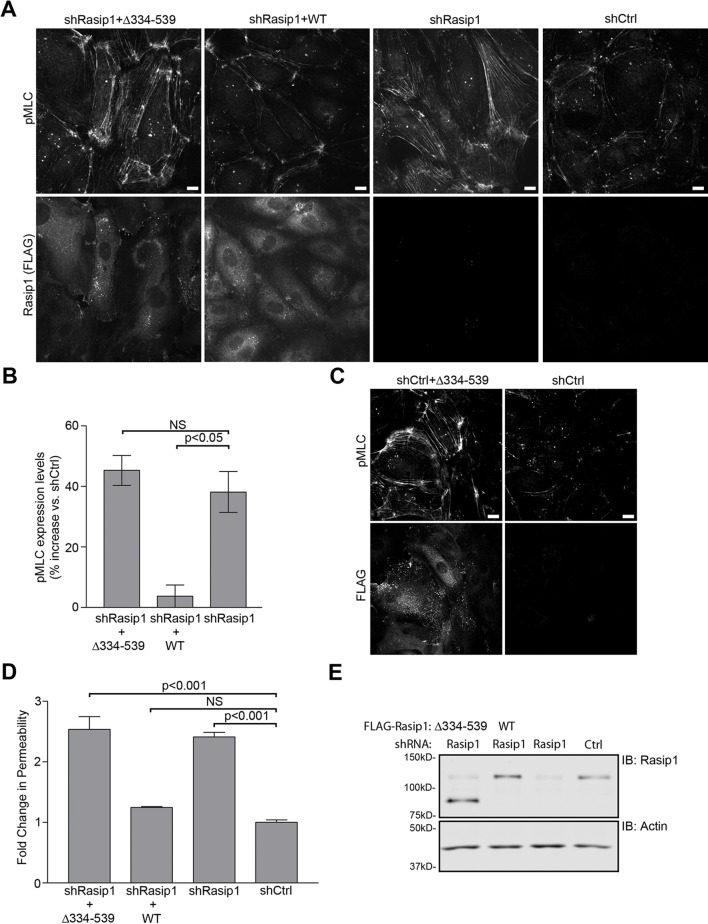
Figure 7. HEG1-binding deficient Rasip1 fails to rescue MLC phosphorylation and EC permeability.
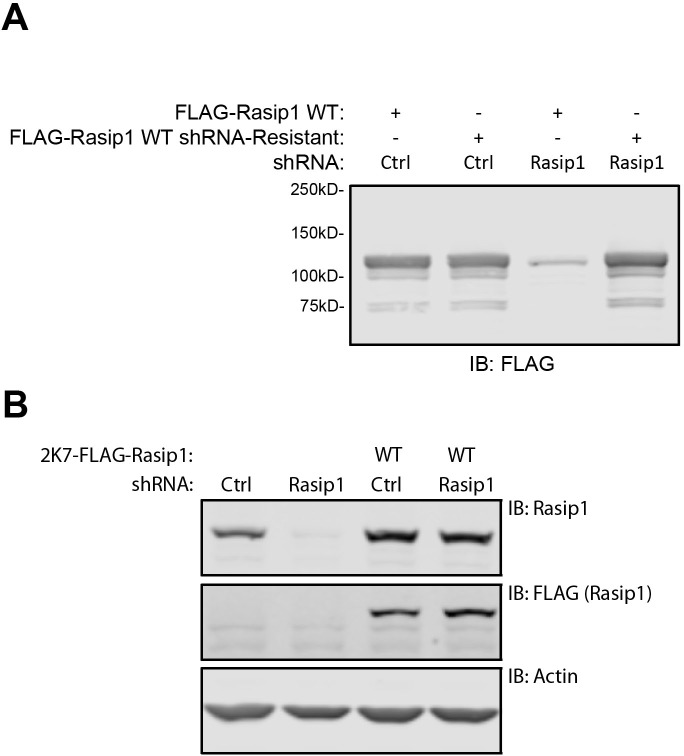
(A and B) Myosin light chain phosphorylation (pMLC) was analyzed by Spinning Disk Confocal Microscopy (SDCM) in Human Umbilical Vein Endothelial Cells (HUVEC), infected as indicated (A). Integrated Density was measured to quantify levels of pMLC expression (B). Lentiviral depletion of Rasip1 (shRasip1) increased levels of pMLC in HUVEC by 40% compared to control cells (shCtrl) which can be rescued by expression of FLAG-tagged shRasip1-resistant wild-type Rasip1. In contrast, HEG1-binding deficient Rasip1(∆334-539) failed to rescue pMLC expression. Expression of rescue constructs is shown by FLAG staining. Mean values ± SEM are shown. One-way analysis of variance (ANOVA) with Bonferroni’s test was used to compare each condition versus Rasip1-depleted cells (shRasip1). Data are from 3 independent experiments. Scale bars, 10 µm. (C) pMLC expression was analyzed by SDCM in control HUVEC (shCtrl) or HUVEC expressing FLAG-tagged Rasip1(∆334-539) (shCtrl+∆334-539). Expression of Rasip1(∆334-539) alone induces expression of pMLC similar to Rasip1 knock-down (Panel A). Scale bars, 10 µm. (D and E) Permeability of HUVEC, seeded on fibronectin-coated Transwell filters (pore size 0.4 μm, membrane diam. 12 mm) and infected as indicated, was measured using 70kD-FITC-Dextran (D). Western blot analysis confirmed Rasip1 knock-down and expression of FLAG-tagged rescue constructs (E). Depletion of Rasip1 (shRasip1) increased permeability by two-fold compared to control cells (shCtrl) which can be rescued by expression shRasip1-resitant wild-type Rasip1. In contrast, HEG1-binding deficient Rasip1(∆334-539) failed to rescue HUVEC permeability. Mean values ± SEM are shown. One-way analysis of variance (ANOVA) with Bonferroni’s test was used to compare each condition versus control cells (shCtrl). Data are from 3 independent experiments. See also Figure 7—figure supplement 1.


