

Abstract
An initial proteomic analysis of the cuprizone mouse model to characterise the breadth of toxicity by assessing cortex, skeletal muscle, spleen and peripheral blood mononuclear cells. Cuprizone treated vs. control mice for an initial characterisation. Select tissues from each group were pooled, analysed in triplicate using two-dimensional gel electrophoresis (2DE) and deep imaging and altered protein species identified using liquid chromatography tandem mass spectrometry (LC/MS/MS). Forty-three proteins were found to be uniquely detectable or undetectable in the cuprizone treatment group across the tissues analysed. Protein species identified in the cortex may potentially be linked to axonal damage in this model, and those in the spleen and peripheral blood mononuclear cells to the minimal peripheral immune cell infiltration into the central nervous system during cuprizone mediated demyelination. Primary oligodendrocytosis has been observed in type III lesions in multiple sclerosis. However, the underlying mechanisms are poorly understood. Cuprizone treatment results in oligodendrocyte apoptosis and secondary demyelination. This initial analysis identified proteins likely related to axonal damage; these may link primary oligodendrocytosis and secondary axonal damage. Furthermore, this appears to be the first study of the cuprizone model to also identify alterations in the proteomes of skeletal muscle, spleen and peripheral blood mononuclear cells. Notably, protein disulphide isomerase was not detected in the cuprizone cohort; its absence has been linked to reduced major histocompatibility class I assembly and reduced antigen presentation. Overall, the results suggest that, like experimental autoimmune encephalomyelitis, results from the standard cuprizone model should be carefully considered relative to clinical multiple sclerosis.
Keywords: Autoimmunity, Multiple sclerosis, Neurodegeneration, Oligodendrocytosis
Introduction
Multiple sclerosis (MS) is most commonly thought to result from a dysregulation of the immune system as peripheral immune cells infiltrate the CNS leading to demyelination of axons. However, as recently discussed, this aetiology remains speculative [1–4]. As with other CNS diseases, there are multiple issues confounding direct research, and thus, understanding the mechanism(s) underlying this disease has been challenging. Accumulating evidence suggests that MS may be initiated by an underlying degeneration of the myelinating cells, oligodendrocytes, within the CNS. The presence of T cells in the CNS may thus represent a secondary immune response [1, 4, 5]. The aetiology of oligodendrocyte degeneration is currently unknown. If a slowly progressing oligodendrocytosis is central to MS, then an animal model of this process would be critical to understanding the initiation and progression of the disease. In the cuprizone model, mice undergo oligodendrocyte cell death resulting in demyelination [6, 7]. Furthermore, studies also implicate mitochondrial dysfunction in this model oligodendrocytosis, as in the aetiology of MS [6–8]. However, the selectivity of the standard cuprizone treatment in terms of more extensively modelling MS is somewhat questionable as the drug also has effects on peripheral tissues [6, 7]. To better characterise these effects of cuprizone, we have undertaken a broader initial top-down proteomic analysis of cortex, spleen, skeletal muscle and peripheral blood mononuclear cells (PBMCs). As part of our top-down proteomic approach, we have also utilised a new deep imaging protocol in order to identify lower abundance protein species [9, 10]. Notably, cuprizone treatment was associated with protein alterations in all the tissues analysed, although all-or-none changes (i.e. uniquely detectable or undetectable by two-dimensional gel electrophoresis (2DE) or deep imaging analyses in samples from the cuprizone-treated mice relative to controls) were not identified in skeletal muscle in contrast to the effects on cortex, spleen and PBMC proteomes in the standard 2DE analysis. Overall, the identified protein changes suggest care in interpreting effects seen following the current standard treatment regimen but should also prove useful in refining the cuprizone model to better reflect clinical MS.
Materials and methods
Ethics statement
C57BL/6 female mice were bred and maintained in a pathogen-free environment. Research and animal care procedures were in strict accordance with the University of Western Sydney Animal Ethics Committee guidelines.
Cuprizone treatment
Demyelination was induced by feeding 8-week-old (16–18 g) female C57BL/6 mice a diet of 0.2 % (w/w) cuprizone (bis-cyclohexanone oxaldihydrazone; Sigma-Aldrich Inc., USA) mixed into ground standard rodent chow for 5 weeks [11, 12]; age- and gender-matched control mice received only the ground chow.
Tissue sampling
Euthanasia was by decapitation following isofluorane exposure. Peripheral blood was collected from all mice and transferred to tubes containing EDTA. PBMCs were isolated using a Percoll gradient, with blood diluted 1:1 with sterile PBS and centrifuged at 400 g for 25 min at 4 °C. The buffy coat consisting of PBMCs was collected, snap frozen and stored at −80 °C. For proteomic analysis, cortex, spleen and skeletal muscle were quickly collected from three mice per group and snap frozen in liquid nitrogen, pooled and stored at −80 °C prior to analyses. For demyelination assessment, the cortex was embedded in optimum cutting temperature compound (OCT), then frozen in liquid nitrogen. Cortex slices (18 μm thickness) were prepared and stained as previously described [13] with the following modifications: Staining was with 0.5 % Sudan Black (Sigma) in 70 % ethanol for 10 min, followed by a wash with 3 % ethanol and finally with PBS.
Protein extraction and analysis
Automated frozen disruption (AFD) of cortex, skeletal muscle and spleen samples, subsequent isolation of total membrane (MP) and soluble protein (SP) fractions and determination of protein concentrations were carried out as previously described [10, 14–19]. Owing to very limited PBMC collected, these were directly solubilised in 2DE buffer containing 8 M urea, 2 M thiourea, 4 % (w/v) CHAPS and a cocktail of protease, kinase and phosphatase inhibitors [14–17].
The PBMC and tissue samples (i.e. isolated MP and SP fractions) were resolved using an established 2DE protocol [10, 15–18, 20]; triplicate gels were resolved for each fraction. As insufficient protein was recovered from these initial PBMC isolates, only a single gel was resolved for the cuprizone treatment and duplicate gels for the parallel controls; as this was the first analysis to test concerns of broader toxicity, we thought it nonetheless prudent to also collect the PBMC data here for further confirmation in more targeted future assessments. Following 2DE, gels were fixed, stained with colloidal Coomassie Brilliant Blue (cCBB) and imaged at 600 V as described previously [19]. Analysis of 2DE gel images was carried out using Delta 2D software (version 4.08; DECODON GmbH, Germany) [10, 19]. For this initial analysis, the strictest selection criteria were applied [16]. For inclusion in the analysis, changes in spot volume (i.e. the abundance of a resolved protein species) had to (1) differ significantly between samples from control and cuprizone-treated mice (t test, p < 0.05, n = 3); (2) be 100 % detectable in all replicate gels and (3) represent all-or-none changes (i.e. uniquely detectable or undetectable by 2DE or deep imaging analyses in samples from the cuprizone-treated mice relative to controls); for PBMC, only the latter criteria could be applied. Protein species meeting the criteria were excised from the gels and identified using liquid chromatography tandem mass spectrometry (LC/MS/MS); peptides were isolated for LC/MS/MS analysis and data analysed as described previously [10, 19]. Deep imaging analysis was carried out as previously described [9, 10]. High abundance spots were excised from the same set of cCBB-stained gels using a scalpel and improvised hole punch. Imaging was repeated at 750 V to enable still higher sensitivity detection of protein species. Image analysis was then carried out as described above with the same criteria applied for excision and identification using LC/MS/MS.
Results
Demyelination
A standard assessment was used to confirm the effectiveness of the cuprizone treatment; loss of CNS myelin was assessed by Sudan Black staining of cortex sections [13]. As well documented in the literature, the effect of cuprizone was quite robust—compared to controls, extensive myelin loss was seen in the corpus callosum (CC) of the cuprizone treatment (Fig. 1).
Fig. 1.

Analysis of myelin in the corpus callosum. Loss of myelin is evident in the representative images of the corpus callosum (CC) from control (a) compared with cuprizone treated (b)
Proteome changes
All samples yielded well-resolved proteomes encompassing the full MW/pI range of the gels. For each tissue and fraction (i.e. MP and SP) from both control and cuprizone-treated mice, images of the gel-resolved proteomes were combined into a single gel image for the quantitative image analyses (i.e. standard and subsequent deep imaging) (Figs. 2 and 3, respectively). The total numbers of resolved protein species for cortex, skeletal muscle and spleen are summarised in Tables 1 and 2 for the standard 2DE analysis and Table 3 for the deep imaging analysis. These initial analyses focused on those protein species undergoing the most substantial changes in abundance (i.e. 100 % changes in ‘spot’ volume between the control and cuprizone-treated samples; see Methods); LC/MS/MS data coupled with Mascot Daemon searches of SwissProt and LudwigNR databases yielded high-quality identifications of all 36 of these select protein species for the standard 2DE analysis (Table 2). Notably however, while alterations of ≥2-fold were readily evident in the skeletal muscle membrane and soluble protein fractions, none met the criteria of all-or-none changes in the standard 2DE analysis (data not shown). Hence, in relation to the cortex, spleen and PBMCs, the protein species alterations in skeletal muscle were minimal. However, following deep imaging analysis, one all-or-none protein species change was identified in the skeletal muscle membrane fraction. Myosin-binding protein C, fast-type, was below detection limit in the MP fraction of skeletal muscle controls. Additionally, a further six all-or-none changes were detected in spleen and PBMCs (Table 4). Thus, a total of 43 all-or-none protein species were identified in this analysis.
Fig. 2.
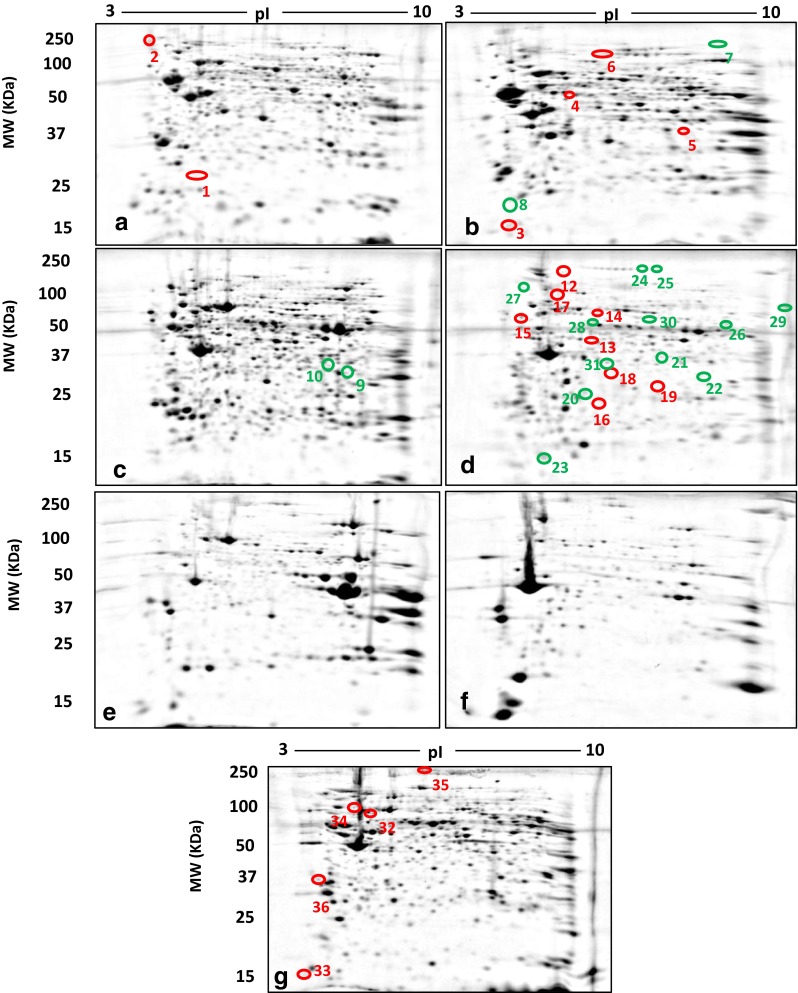
Soluble (a, c, e) and membrane (b, d, f) proteomes resolved by 2DE from cortex (a, b), spleen (c, d) and skeletal muscle (e, f). Total proteome of PBMCs (g). Each gel image represents a fused image of controls and corresponding cuprizone treatments. Red circles represent protein species uniquely detected in controls relative to cuprizone treatments. Green circles represent protein species uniquely detected in cuprizone treatments relative to controls
Fig. 3.

Resolved soluble (a, c, e) and membrane (b, d, f) proteomes assessed by deep imaging analysis of cortex (a, b), spleen (c, d) and skeletal muscle (e, f) 2DE gels. Total proteome of PBMCs (g). Each gel image represents a fused image of controls and corresponding cuprizone treatments. Red circles represent protein species uniquely detected in controls relative to cuprizone treatments. Green circles represent protein species uniquely detected in cuprizone treatments relative to controls
Table 1.
Total protein species resolved by 2DE from cortex, skeletal muscle and spleen (membrane and soluble fractions) from controls and cuprizone-treated mice
| Protein species detected | ||||
|---|---|---|---|---|
| Soluble fraction | Membrane fraction | |||
| Tissue | Control | Cuprizone | Control | Cuprizone |
| Cortex | 693 ± 5 | 685 ± 9 | 662 ± 17 | 682 ± 9 |
| Skeletal muscle | 439 ± 6 | 443 ± 4 | 288 ± 3 | 285 ± 3 |
| Spleen | 643 ± 16 | 658 ± 14 | 504 ± 7 | 546 ± 18 |
Figures given are mean ± SEM
Table 2.
2DE-LC/MS/MS analyses identified a select number of protein species determined to be consistently detectable or not detectable following cuprizone treatment (indicated in Fig. 2)
| Spot ID | Tissue | MP or SP | UniProt ID | Protein identified | Present in cuprizone | Theoretical MW (kDa)/pI | Observed MW (kDa)/pI | Mascot protein score | Sequence coverage % | Number of unique peptides matched |
|---|---|---|---|---|---|---|---|---|---|---|
| 1 | Cortex | SP | Q91XV3 | Brain acid soluble protein 1 | − | 22.07/4.50 | 22.7/4.8 | 196 | 45 % | 4 |
| 2 | Cortex | SP | Q61074 | Protein phosphatase 1G | − | 59.38/4.27 | 104.7/4.4 | 126 | 13 % | 10 |
| 3 | Cortex | MP | Q91X97 | Neurocalcin | − | 22.35/5.23 | 19.8/4.9 | 110 | 10 % | 2 |
| 4 | Cortex | MP | Q9D2G2 | Dihydrolipoyllysine-residue succinyltransferase component of 2-oxoglutarate dehydrogenase complex, mitochondrial | − | 49.31/9.11 | 54.2/5.2 | 209 | 17 % | 12 |
| 5 | Cortex | MP | P45376 | Aldose reductase | − | 36.05/6.71 | 36.8/6.6 | 239 | 17 % | 6 |
| 6 | Cortex | MP | P39053 | Dynamin-1 | − | 98.14/7.61 | 122.3/5.6 | 142 | 19 % | 19 |
| 7 | Cortex | MP | Q91V92 | ATP-citrate synthase | + | 120.56/7.13 | 183.8/7.0 | 59 | 7 % | 8 |
| 8 | Cortex | MP | Q61411 | GTPase HRas | + | 21.63/5.16 | 21.1/4.8 | 102 | 29 % | 7 |
| 9 | Spleen | SP | Q8R1A8 | Ornithine carbamoyltransferase, mitochondrial | + | 39.86/8.81 | 42.4/6.9 | 136 | 25 % | 11 |
| 10 | Spleen | SP | Q61176 | Arginase-1 | + | 34.96/6.51 | 46.3/6.6 | 159 | 8 % | 4 |
| 11 | Spleen | SP | Q8C196 | Carbamoyl-phosphate synthase [ammonia], mitochondrial | + | 165.71/6.48 | 186.8/6.1 | 839 | 28 % | 51 |
| 12 | Spleen | MP | P08113 | Endoplasmin | − | 92.70/4.74 | 117.7/5.0 | 73 | 8 % | 7 |
| 13 | Spleen | MP | Q922R8 | Protein disulphide isomerase A6 | − | 48.47/5.00 | 47.5/5.3 | 311 | 27 % | 10 |
| 14 | Spleen | MP | Q8BGA9 | Mitochondrial inner membrane protein | − | 84.25/6.18 | 66.3/5.3 | 340 | 25 % | 24 |
| 15 | Spleen | MP | F6S5U2 | Protein disulphide isomerase A2 | − | 58.57/4.87 | 63.7/4.7 | 580 | 40 % | 32 |
| 16 | Spleen | MP | P99024 | Tubulin beta-5 chain | − | 50.10/4.78 | 28.2/5.3 | 243 | 20 % | 14 |
| 17 | Spleen | MP | Q99PL5 | Ribosome-binding protein 1 | − | 173.23/9.35 | 93.5/5.0 | 230 | 8 % | 13 |
| 18 | Spleen | MP | Q6ZWX6 | Eukaryotic translation initiation factor 2 subunit 1 | − | 36.37/5.02 | 34.6/5.5 | 98 | 43 % | 16 |
| 19 | Spleen | MP | F6Q404 | Protein disulphide isomerase A3 | − | 57.10/5.88 | 31.6/5.8 | 518 | 25 % | 11 |
| 20 | Spleen | MP | Q9JHI5 | DnaJ homolog subfamily C member 1 | + | 30.21/5.76 | 30.4/5.2 | 191 | 33 % | 11 |
| 21 | Spleen | MP | Q9JHI5 | Isovaleryl-CoA dehydrogenase | + | 46.70/8.53 | 38.9/6.0 | 213 | 10 % | 5 |
| 22 | Spleen | MP | P45376 | Aldose reductase | + | 36.05/6.71 | 33.6/6.6 | 145 | 20 % | 7 |
| 23 | Spleen | MP | Q3THE2 | Myosin regulatory light chain 12B | + | 19.82/4.71 | 18.6/4.7 | 193 | 29 % | 7 |
| 24 | Spleen | MP | Q02788 | Collagen alpha-2(VI) chain | + | 111.41/6.01 | 186.8/5.9 | 268 | 8 % | 10 |
| 25 | Spleen | MP | Q8C196 | Carbamoyl-phosphate synthase [ammonia], mitochondrial | + | 165.71/6.48 | 186.8/6.1 | 140 | 16 % | 23 |
| 26 | Spleen | MP | P29351 | Tyrosine-protein phosphatase non-receptor type 6 | + | 67.86/7.66 | 57.9/7.2 | 100 | 11 % | 7 |
| 27 | Spleen | MP | P08113 | Endoplasmin | + | 92.70/4.74 | 88.4/4.7 | 195 | 20 % | 20 |
| 28 | Spleen | MP | P11983 | T-complex protein 1 subunit alpha | + | 60.87/5.82 | 59.0/5.4 | 211 | 28 % | 18 |
| 29 | Spleen | MP | Q8BMS1 | Trifunctional enzyme subunit alpha, mitochondrial | + | 83.30/9.24 | 70.7/9.6 | 320 | 27 % | 22 |
| 30 | Spleen | MP | D3YUF7 | Prelamin-A/C | + | 74.48/6.54 | 61.2/5.8 | 416 | 33 % | 20 |
| 31 | Spleen | MP | Q9D154 | Leukocyte elastase inhibitor A | + | 42.72/5.85 | 38.4/5.4 | 183 | 36 % | 15 |
| 32 | PBMC | T | Q8R146 | Acylamino-acid-releasing enzyme | − | 82.44/5.36 | 109.6/4.9 | 361 | 22 % | 22 |
| 33 | PBMC | T | Q60605 | Myosin light polypeptide 6 | − | 17.10/4.56 | 19.1/4.4 | 85 | 31 % | 5 |
| 34 | PBMC | T | P08003 | Protein disulphide isomerase A4 | − | 72.30/5.16 | 94.9/4.7 | 211 | 24 % | 27 |
| 35 | PBMC | T | P26039 | Talin 1 | − | 271.82/5.84 | 290.5/5.4 | 3259 | 45 % | 142 |
| 36 | PBMC | T | Q8R5L1 | Complement component 1 Q subcomponent-binding protein, mitochondrial | − | 31.34/4.77 | 34.6/4.4 | 142 | 14 % | 4 |
All identified proteins were from Mus musculus
+ Detectable in cuprizone treatment
− Not detectable in cuprizone treatment
MP membrane protein fraction, SP soluble protein fraction, T total protein fraction, MW molecular weight
Table 3.
Total protein species resolved by deep imaging analysis of cortex, skeletal muscle and spleen (membrane and soluble fractions) from controls and cuprizone-treated mice
| Protein species detected | ||||
|---|---|---|---|---|
| Soluble fraction | Membrane fraction | |||
| Tissue | Control | Cuprizone | Control | Cuprizone |
| Cortex | 849 ± 6 | 849 ± 7 | 835 ± 14 | 832 ± 17 |
| Skeletal muscle | 616 ± 6 | 617 ± 11 | 476 ± 4 | 480 ± 5 |
| Spleen | 817 ± 4 | 801 ± 15 | 765 ± 5 | 773 ± 8 |
Figures given are mean ± SEM
Table 4.
Deep imaging and LC/MS/MS analyses identified a select number of protein species determined to be consistently detectable or not detectable following cuprizone treatment (indicated in Fig. 3)
| Spot ID | Tissue | MP or SP | UniProt ID | Protein identified | Present in cuprizone | Theoretical MW (kDa)/pI | Observed MW (kDa)/pI | Mascot protein score | Sequence coverage % | Number of unique peptides matched |
|---|---|---|---|---|---|---|---|---|---|---|
| 1 | Spleen | SP | P40142 | Transketolase | + | 68.27/7.23 | 106.9/7.1 | 521 | 25 | 15 |
| 2 | Spleen | MP | P07724 | Serum albumin | − | 70.70/5.75 | 77.6/5.1 | 293 | 11 | 7 |
| 3 | Spleen | MP | P48678 | Isoform C of prelamin-A/C | − | 65.47/6.37 | 41.9/5.2 | 191 | 28 | 21 |
| 4 | Spleen | MP | D3YUF7 | Prelamin-A/C | + | 74.48/6.54 | 72.3/5.8 | 289 | 31 | 19 |
| 5 | Spleen | MP | P80316 | T-complex protein 1 subunit epsilon | + | 60.04/5.72 | 58.9/5.2 | 299 | 31 | 22 |
| 6 | Skeletal Muscle | MP | Q5XKE0 | Myosin-binding protein C, fast-type | + | 128.13/6.02 | 88.4/5.3 | 86 | 10 | 11 |
| 7 | PBMC | T | P26039 | Talin 1 | − | 271.82/5.84 | 162.7/5.3 | 101 | 2 | 6 |
All identified proteins were from Mus musculus
+ Detectable in cuprizone treatment
− Not detectable in cuprizone treatment
MP membrane protein fraction, SP soluble protein fraction, T total protein fraction, MW molecular weight
Discussion
There is growing evidence indicating that MS may initiate (and thus in part progress) as a primary degeneration of oligodendrocytes. Currently, the molecular mechanisms underlying this oligodendrocytosis are unknown. The cuprizone model has widely been used to investigate the mechanisms behind such a postulated oligodendrocytosis, particularly with regard to the subsequent remyelination process. However, as with oligodendrocytosis in clinical MS, the mechanism in the animal model is poorly understood as is the broader usefulness of this as a model of the human disease. We thus carried out an initial top-down proteomic analysis of the standard cuprizone model to best characterise the system-wide effects of the compound. In the context of the current standard exposure protocol defined in the literature, the well-characterised effects on oligodendrocytes are indeed robust (Fig. 1), although extensive effects on spleen and PBMCs were also seen (Tables 2 and 4). Notably, changes in the skeletal muscle proteome were much less pronounced, and only one all-or-none protein alteration was detected. Overall however, there were no significant increases or decreases in the total number of protein species resolved from the control and cuprizone-treated animals with regard to the cortex, skeletal muscle and spleen (Table 1). This was also true for the deep imaging; there were no significant increases or decreases in protein species numbers resolved between the control and cuprizone samples from cortex, skeletal muscle and spleen (Table 3).
The altered protein species detected in this initial study reflect the breadth of biochemical and cellular effects of cuprizone treatment (Figs. 1 and 2). Altered protein species identified here participate in a wide array of biological processes (Fig. 4). Protein species altered in the cortex are related to axon growth, calcium signalling and energy metabolism. For the spleen, the most prominent changes were related to the following biological processes: oxidative stress, urea cycle, transport and cytoskeletal. To our knowledge, only one previous proteomic analysis has been carried out on the cuprizone model; this ‘shotgun’ study (i.e. as opposed to a top-down approach used here) identified protein changes of ≥1.5-fold and only in the mouse brain [21]. However, here, we only examined protein species that met the criterion of all-or-none change. As such, we identified only the protein species that were 100 % altered in abundance between the cuprizone treatment and the control (Table 2); these correspond to the most dramatic alterations and as such are a rational starting point for analysis. While some of these pronounced alterations in abundance correspond to proteins also identified in a previous study [21], overall, the majority of proteins identified in the earlier study do not overlap with the current findings. Notably, eight cortex protein species identified as being altered in the cuprizone model in our study were not identified in the previous study. The reasons behind this are likely to be manifold. The previous study used only 20 μg of total protein for each analysis whereas we resolved 100 μg of total protein per technical replicate. Overall, shotgun-based methods have inherent limitations in relation to overall detection, consistency between replicates, quality of the protein identification and limited identification of lower abundance protein species [22, 23]. Importantly, 2DE fully and routinely enables the resolution of splice variants, post-translationally modified protein species and protein isoforms, and offers greater consistency across technical replicates [22]. Notably, here, 2DE in combination with deep imaging enabled the resolution and identification of protein species of markedly lower abundance. As such, 2DE in tandem with deep imaging and MS allows far more routine in depth analysis of a given proteome relative to shotgun-based methods [9, 10, 22].
Fig. 4.

Pie graph of the identified protein species grouped according to biological functions. Representative pie graph displays all protein species identified for all tissues (i.e. cortex, spleen, PBMCs and skeletal muscle) and fractions (i.e. MP and SP) from both the standard and deep imaging analyses
Axonal damage has been reported in both acute (i.e. 5-week treatment duration used in this study) and chronic (i.e. 16-week treatment duration) cuprizone models [24, 25]. Loss of oligodendrocytes results in demyelination, a critical clinical hallmark of MS [26]. In inactive demyelinated MS lesions, the mitochondrial respiratory chain complex IV shows increased activity, suggesting an increased energy demand in chronically demyelinated axons [27]. Thus, it is perhaps not unexpected that prolonged damage to oligodendrocytes may lead to an increase in energy demand of demyelinated axons in chronic cuprizone treatment; cuprizone is after all a copper chelator and would be expected to have some effect on mitochondria [6, 7, 28]. This increased energy demand may lead to degeneration of the axons. The data here indicate a significant reduction in brain acid soluble protein 1 (BASP1) in the cortex following cuprizone treatment. As BASP1 plays a role in neurite growth [29], its loss may potentially be related to axonal damage that has been reported in this model as well as the later stages of clinical MS.
Furthermore, neurocalcin was no longer detected in the cortex proteome following cuprizone treatment. Neurocalcin is a member of the highly homologous visinin-like protein (VSNL) subfamily of neuronal calcium sensor proteins [30]; other members of this family such as VILIP-1 are reduced in the brains of Alzheimer’s patients [31]. More broadly, the dysregulation of calcium homeostasis has been implicated in a range of neurodegenerative diseases via complications related to energy metabolism and oxidative stress [32, 33].
In terms of broader effects, a critical finding here is that of substantial protein alterations in the spleen following cuprizone treatment. As copper is a cofactor in many metabolic pathways, cuprizone has the potential to affect many organs and tissues. Notably, it has been suggested that the drug may inhibit T cell function [34]. Indeed, copper is required for transcription of interleukin-2 in T helper 1 cells [35]. The chelation of copper by cuprizone may possibly reduce its availability to T helper 1 cells, potentially leading to reduced proinflammatory cytokine production and T cell-directed immunity [34]. However, another study suggests that the apparent lack of T cell involvement in cuprizone pathology is a result of immune tolerance rather than the drug acting as an immunosuppressant [36]; combining cuprizone treatment with the induction of experimental autoimmune encephalomyelitis (EAE) (i.e. the ‘traditional’ animal model of MS) resulted in tolerance to myelin antigens in the periphery and thus protection from EAE. Additionally, evidence of immunosuppression by myeloid-derived suppressor cells, including monocytes and granulocytes, may be via the urea cycle enzyme arginase-I [37–39]; here, we identify a significant increase in the abundance of arginase-I in the spleens of cuprizone-treated mice. Myeloid-derived suppressor cells expressing increased levels of arginase-I may thus potentially contribute to the apparent lack of T cell involvement in the cuprizone model.
A quite notable finding in the current study was the detection of protein disulphide isomerase (PDI) subunits A2, A3 and A6 in the spleen and protein disulphide isomerase A4 in the PBMCs of the control cohort only. In conditions of oxidative stress, PDI undergoes proteolytic degradation [40], suggesting that the reduced amount of the enzyme or select subunits in cuprizone-treated mice could be related to oxidative stress, which is also consistent with identified alterations in endoplasmic reticulum proteins (i.e. ribosome-binding protein 1 and endoplasmin; Table 2). PDI participates in the assembly of major histocompatibility (MHC) class I molecules, and its depletion interferes with folding and assembly of MHC class I molecules [41]. Thus, the absence of PDI may contribute to impaired MHC class I assembly leading to reduced antigen presentation. As MHC class I antigen presenting cells promote cytotoxic T lymphocyte activity, the absence of PDI in cuprizone-treated mice may contribute to the suggested lack of T cell involvement in cuprizone pathology.
A further notable finding here was the absence of talin 1 in the PBMCs of cuprizone-treated mice. Talin 1 is an actin-binding focal adhesion protein which links integrins to the actin cytoskeleton and is the main talin in B lymphocytes [42]. Integrins are cell surface receptors that mediate cell-cell or cell-matrix adhesion. The integrins, LFA-1 (αLβ2), VLA-4 (α4β1) and α4β7, are required for the migration of mature B cells from the blood to the bone marrow, lymph nodes and to peripheral sites of inflammation [43, 44]. A recent study simultaneously inhibited the adhesive functions of these integrins by deleting the expression of talin 1 [45]. Notably, this resulted in a significant reduction of B cell migration to the bone marrow and lymph nodes but not to the spleen. Furthermore, these mice displayed a considerable defect in terms of an effective humoral response to peripherally introduced T-dependent antigen [45]. The absence of talin 1 in PBMCs from cuprizone-treated mice may thus indicate impaired integrin adhesion function of B cells. Such impairment may underlie the suggested lack of B cell involvement in cuprizone pathology.
Conclusion
In summary, the overarching message arising from this study is that the wider biochemical and cellular effects of cuprizone treatment must not be overlooked. For the most part, cuprizone has been used to investigate oligodendrocytosis-mediated demyelination and the process of remyelination. However, in terms of clinical MS, myelin regeneration in the absence of targeted blockade of any underlying and progressive oligodendrocytosis (or any other degeneration for that matter) seems at best a vicious and continuously narrowing circle that is unlikely to effectively address the slow onslaught of the disease. A more detailed understanding of the system-wide effects of cuprizone may thus also prove critical in terms of fine-tuning the treatment protocol to yield effects that better and more broadly reflect clinical MS and thus enable effective translational studies in the future (i.e. rational identification of drug targets and testing of new therapeutics). Indeed, the finding of somewhat limited effects on skeletal muscle are potentially promising in terms of better linking oligodendrocytosis with alterations in central motor functions rather than peripheral toxicity.
Acknowledgments
The authors are grateful to the Rotary Club of Narellan for initiating and funding the Narellan-UWS MS Research Project. MAP acknowledges the UWS Molecular Medicine Research Group and the School of Medicine for PhD scholarship support provided in complement to the funding from Rotary. The authors thank Ashleigh Deschamps and the School of Medicine Animal Facility staff for outstanding assistance, and acknowledge use of the UWS Mass Spectrometry Facility.
Conflict of interest
The authors declare no conflict of interest.
Authors’ contributions
MAP was involved in study design, data acquisition, data analysis and manuscript drafting. SG was involved in manuscript drafting. SJM was involved in study design and manuscript drafting. JRC was involved in study design, data analysis and manuscript drafting. All authors read and approved the final manuscript.
Abbreviations
- 2DE
Two-dimensional gel electrophoresis
- AD
Alzheimer’s disease
- AFD
Automated frozen disruption
- CC
Corpus callosum
- cCBB
Colloidal Coomassie Brilliant Blue
- EAE
Experimental autoimmune encephalomyelitis
- LC/MS/MS
Liquid chromatography tandem mass spectrometry
- MHC
Major histocompatibility complex
- MP
Membrane protein
- MS
Multiple sclerosis
- OCT
Optimum cutting temperature compound
- PBMCs
Peripheral blood mononuclear cells
- PDI
Protein disulphide isomerase
- RT
Room temperature
- SP
Soluble protein
Contributor Information
Melissa A. Partridge, Email: m.partridge@uws.edu.au
Sumana Gopinath, Email: sumanagopinath@gmail.com.
Simon J. Myers, Phone: + 61-02-4620 3383, Email: s.myers@uws.edu.au
Jens R Coorssen, Phone: +61-2-4620 3802, Email: j.coorssen@uws.edu.au.
References
- 1.Nakahara J, Maeda M, Aiso S, Suzuki N. Current concepts in multiple sclerosis: autoimmunity versus oligodendrogliopathy. Clin Rev Allerg Immunol. 2012;42:26–34. doi: 10.1007/s12016-011-8287-6. [DOI] [PubMed] [Google Scholar]
- 2.Partridge MA, Myers SJ, Gopinath S, Coorssen, JR (2015) Proteomics of a conundrum: thoughts on addressing the aetiology versus progression of multiple sclerosis. Prot Clin Appl. doi:10.1002/prca.201400141 [DOI] [PubMed]
- 3.Prineas JW, Parratt JD. Oligodendrocytes and the early multiple sclerosis lesion. Ann Neurol. 2012;72:18–31. doi: 10.1002/ana.23634. [DOI] [PubMed] [Google Scholar]
- 4.Stys P, Zamponi G, van Minnen J, Geurts J. Will the real multiple sclerosis please stand up? Nat Rev Neurosci. 2012;13:507–514. doi: 10.1038/nrn3275. [DOI] [PubMed] [Google Scholar]
- 5.Barnett M, Prineas J. Relapsing and remitting multiple sclerosis: pathology of the newly forming lesion. Ann Neurol. 2004;55:458–468. doi: 10.1002/ana.20016. [DOI] [PubMed] [Google Scholar]
- 6.Kipp M, Clarner T, Dang J, Copray S, Beyer C. The cuprizone animal model: new insights into an old story. Acta Neuropathol. 2009;118:723–736. doi: 10.1007/s00401-009-0591-3. [DOI] [PubMed] [Google Scholar]
- 7.Matsushima GK, Morell P. The neurotoxicant, cuprizone, as a model to study demyelination and remyelination in the central nervous system. Brain Pathol (Zurich, Switz) 2001;11:107–116. doi: 10.1111/j.1750-3639.2001.tb00385.x. [DOI] [PMC free article] [PubMed] [Google Scholar]
- 8.Kalman B, Laitinen K, Komoly S. The involvement of mitochondria in the pathogenesis of multiple sclerosis. J Neuroimmunol. 2007;188:1–12. doi: 10.1016/j.jneuroim.2007.03.020. [DOI] [PubMed] [Google Scholar]
- 9.Wright E, Prasad K, Padula M, Coorssen J. Deep imaging: how much of the proteome does current top-down technology already resolve? PLoS ONE. 2014;9(1):e86058. doi: 10.1371/journal.pone.0086058. [DOI] [PMC free article] [PubMed] [Google Scholar]
- 10.Wright EP, Partridge MA, Padula MP, Gauci VJ, Malladi CS, Coorssen JR. Top-down proteomics: enhancing 2D gel electrophoresis from tissue processing to high-sensitivity protein detection. Proteomics. 2014;14:872–889. doi: 10.1002/pmic.201300424. [DOI] [PubMed] [Google Scholar]
- 11.Clarner T, et al. Myelin debris regulates inflammatory responses in an experimental demyelination animal model and multiple sclerosis lesions. Glia. 2012;60:1468–1480. doi: 10.1002/glia.22367. [DOI] [PubMed] [Google Scholar]
- 12.Taylor L, Gilmore W, Ting J, Matsushima G. Cuprizone induces similar demyelination in male and female C57BL/6 mice and results in disruption of the estrous cycle. J Neurosci Res. 2010;88:391–402. doi: 10.1002/jnr.22215. [DOI] [PubMed] [Google Scholar]
- 13.Ishibashi T, Dakin K, Stevens B, Lee P, Kozlov S, Stewart C, Fields D. Astrocytes promote myelination in response to electrical impulses. Neuron. 2006;49:823–832. doi: 10.1016/j.neuron.2006.02.006. [DOI] [PMC free article] [PubMed] [Google Scholar]
- 14.Butt H, Coorssen J. Postfractionation for enhanced proteomic analyses: routine electrophoretic methods increase the resolution of standard 2D-PAGE. J Proteome Res. 2005;4:982–991. doi: 10.1021/pr050054d. [DOI] [PubMed] [Google Scholar]
- 15.Butt H, Coorssen J. Pre-extraction sample handling by automated frozen disruption significantly improves subsequent proteomic analyses. J Proteome Res. 2006;5:437–448. doi: 10.1021/pr0503634. [DOI] [PubMed] [Google Scholar]
- 16.Butt H, Lee M, Pirshahid A, Backlund P, Wood S, Coorssen J. An initial proteomic analysis of human preterm labor: placental membranes. J Proteome Res. 2006;5:3161–3172. doi: 10.1021/pr060282n. [DOI] [PubMed] [Google Scholar]
- 17.Butt H, Pfeifer T, Delaney A, Grigliatti T, Tetzlaff W, Coorssen J. Enabling coupled quantitative genomics and proteomics analyses from rat spinal cord samples. Mol Cell Proteom: MCP. 2007;6:1574–1588. doi: 10.1074/mcp.M700083-MCP200. [DOI] [PubMed] [Google Scholar]
- 18.Churchward M, Butt H, Lang J, Hsu K, Coorssen J. Enhanced detergent extraction for analysis of membrane proteomes by two-dimensional gel electrophoresis. Proteome Sci. 2005;3:5–15. doi: 10.1186/1477-5956-3-5. [DOI] [PMC free article] [PubMed] [Google Scholar]
- 19.Gauci V, Padula M, Coorssen J. Coomassie blue staining for high sensitivity gel-based proteomics. J Proteome. 2013;90:96–106. doi: 10.1016/j.jprot.2013.01.027. [DOI] [PubMed] [Google Scholar]
- 20.Harris L, Churchward M, Butt H, Coorssen J. Assessing detection methods for gel-based proteomic analyses. J Proteome Res. 2007;6:1418–1425. doi: 10.1021/pr0700246. [DOI] [PubMed] [Google Scholar]
- 21.Werner S, Saha J, Broderick C, Zhen E, Higgs R, Duffin K, Smith R. Proteomic analysis of demyelinated and remyelinating brain tissue following dietary cuprizone administration. J Mol Neurosci: MN. 2010;42:210–225. doi: 10.1007/s12031-010-9354-9. [DOI] [PubMed] [Google Scholar]
- 22.Oliveira B, Coorssen J, Martins-de-Souza D. 2DE: the phoenix of proteomics. J Proteome. 2014;104:140–150. doi: 10.1016/j.jprot.2014.03.035. [DOI] [PubMed] [Google Scholar]
- 23.Wu C, Yates J. The application of mass spectrometry to membrane proteomics. Nat Biotechnol. 2003;21:262–267. doi: 10.1038/nbt0303-262. [DOI] [PubMed] [Google Scholar]
- 24.Irvine KA, Blakemore WF. Age increases axon loss associated with primary demyelination in cuprizone-induced demyelination in C57BL/6 mice. J Neuroimmunol. 2006;175:69–76. doi: 10.1016/j.jneuroim.2006.03.002. [DOI] [PubMed] [Google Scholar]
- 25.Lindner M, Fokuhl J, Linsmeier F, Trebst C, Stangel M. Chronic toxic demyelination in the central nervous system leads to axonal damage despite remyelination. Neurosci Lett. 2009;453:120–125. doi: 10.1016/j.neulet.2009.02.004. [DOI] [PubMed] [Google Scholar]
- 26.Rodriguez M. A function of myelin is to protect axons from subsequent injury: implications for deficits in multiple sclerosis. Brain: J Neurol. 2003;126:751–752. doi: 10.1093/brain/awg070. [DOI] [PubMed] [Google Scholar]
- 27.Mahad D, et al. Mitochondrial changes within axons in multiple sclerosis. Brain: J Neurol. 2009;132:1161–1174. doi: 10.1093/brain/awp046. [DOI] [PMC free article] [PubMed] [Google Scholar]
- 28.Suzuki K. Giant hepatic mitochondria: production in mice fed with cuprizone. Science. 1969;163:81–82. doi: 10.1126/science.163.3862.81. [DOI] [PubMed] [Google Scholar]
- 29.Korshunova I, Caroni P, Kolkova K, Berezin V, Bock E, Walmod P. Characterization of BASP1-mediated neurite outgrowth. J Neurosci Res. 2008;86:2201–2213. doi: 10.1002/jnr.21678. [DOI] [PubMed] [Google Scholar]
- 30.Braunewell K-H, Klein-Szanto A, Szanto AK. Visinin-like proteins (VSNLs): interaction partners and emerging functions in signal transduction of a subfamily of neuronal Ca2+-sensor proteins. Cell Tissue Res. 2009;335:301–316. doi: 10.1007/s00441-008-0716-3. [DOI] [PMC free article] [PubMed] [Google Scholar]
- 31.Schnurra I, Bernstein HG, Riederer P, Braunewell KH. The neuronal calcium sensor protein VILIP-1 is associated with amyloid plaques and extracellular tangles in Alzheimer’s disease and promotes cell death and tau phosphorylation in vitro: a link between calcium sensors and Alzheimer’s disease? Neurobiol Dis. 2001;8:900–909. doi: 10.1006/nbdi.2001.0432. [DOI] [PubMed] [Google Scholar]
- 32.Jaiswal MK. Calcium, mitochondria, and the pathogenesis of ALS: the good, the bad, and the ugly. Front Cell Neurosci. 2013;7:199. doi: 10.3389/fncel.2013.00199. [DOI] [PMC free article] [PubMed] [Google Scholar]
- 33.Zündorf G, Reiser G. Calcium dysregulation and homeostasis of neural calcium in the molecular mechanisms of neurodegenerative diseases provide multiple targets for neuroprotection. Antioxid Redox Signal. 2011;14:1275–1288. doi: 10.1089/ars.2010.3359. [DOI] [PMC free article] [PubMed] [Google Scholar]
- 34.Emerson MR, Biswas S, LeVine SM. Cuprizone and piperonyl butoxide, proposed inhibitors of T-cell function, attenuate experimental allergic encephalomyelitis in SJL mice. J Neuroimmunol. 2001;119:205–213. doi: 10.1016/S0165-5728(01)00394-0. [DOI] [PubMed] [Google Scholar]
- 35.Hopkins RG, Failla ML. Copper deficiency reduces interleukin-2 (IL-2) production and IL-2 mRNA in human T-lymphocytes. J Nutr. 1997;127:257–262. doi: 10.1093/jn/127.2.257. [DOI] [PubMed] [Google Scholar]
- 36.Maña P, Fordham S, Staykova M, Correcha M, Silva D, Willenborg D, Liñares D. Demyelination caused by the copper chelator cuprizone halts T cell mediated autoimmune neuroinflammation. J Neuroimmunol. 2009;210:13–21. doi: 10.1016/j.jneuroim.2009.02.013. [DOI] [PubMed] [Google Scholar]
- 37.Bronte V, Zanovello P. Regulation of immune responses by L-arginine metabolism. Nat Rev Immunol. 2005;5:641–654. doi: 10.1038/nri1668. [DOI] [PubMed] [Google Scholar]
- 38.Moliné-Velázquez V, Cuervo H, Vila-Del Sol V, Ortega MC, Clemente D, de Castro F. Myeloid-derived suppressor cells limit the inflammation by promoting T lymphocyte apoptosis in the spinal cord of a murine model of multiple sclerosis. Brain Pathol (Zurich, Switz) 2011;21:678–691. doi: 10.1111/j.1750-3639.2011.00495.x. [DOI] [PMC free article] [PubMed] [Google Scholar]
- 39.Movahedi K, et al. Identification of discrete tumor-induced myeloid-derived suppressor cell subpopulations with distinct T cell-suppressive activity. Blood. 2008;111:4233–4244. doi: 10.1182/blood-2007-07-099226. [DOI] [PubMed] [Google Scholar]
- 40.Grune T, Reinheckel T, Li R, North J, Davies K. Proteasome-dependent turnover of protein disulfide isomerase in oxidatively stressed cells. Arch Biochem Biophys. 2002;397:407–413. doi: 10.1006/abbi.2001.2719. [DOI] [PubMed] [Google Scholar]
- 41.Kang K, Park B, Oh C, Cho K, Ahn K. A role for protein disulfide isomerase in the early folding and assembly of MHC class I molecules. Antioxid Redox Signal. 2009;11:2553–2561. doi: 10.1089/ars.2009.2465. [DOI] [PubMed] [Google Scholar]
- 42.Critchley D. Biochemical and structural properties of the integrin-associated cytoskeletal protein talin. Ann Rev Biophys. 2009;38:235–254. doi: 10.1146/annurev.biophys.050708.133744. [DOI] [PubMed] [Google Scholar]
- 43.Leuker CE, Labow M, Müller W, Wagner N. Neonatally induced inactivation of the vascular cell adhesion molecule 1 gene impairs B cell localization and T cell-dependent humoral immune response. J Exp Med. 2001;193:755–768. doi: 10.1084/jem.193.6.755. [DOI] [PMC free article] [PubMed] [Google Scholar]
- 44.Rott LS, Briskin MJ, Butcher EC. Expression of alpha4beta7 and E-selectin ligand by circulating memory B cells: implications for targeted trafficking to mucosal and systemic sites. J Leukoc Biol. 2000;68:807–814. [PubMed] [Google Scholar]
- 45.Manevich-Mendelson E, et al. Talin 1 is required for integrin-dependent B lymphocyte homing to lymph nodes and the bone marrow but not for follicular B-cell maturation in the spleen. Blood. 2010;116:5907–5918. doi: 10.1182/blood-2010-06-293506. [DOI] [PubMed] [Google Scholar]