Abstract
In this study, acoustophoresis and dielectrophoresis are utilized in an integrated manner to combine the two different operations on a single polydimethylsiloxane (PDMS) chip in sequential manner, namely, particle wash (buffer exchange) and particle separation. In the washing step, particles are washed with buffer solution with low conductivity for dielectrophoretic based separation to avoid the adverse effects of Joule heating. Acoustic waves generated by piezoelectric material are utilized for washing, which creates standing waves along the whole width of the channel. Coupled electro-mechanical acoustic 3D multi-physics analysis showed that the position and orientation of the piezoelectric actuators are critical for successful operation. A unique mold is designed for the precise alignment of the piezoelectric materials and 3D side-wall electrodes for a highly reproducible fabrication. To achieve the throughput matching of acoustophoresis and dielectrophoresis in the integration, 3D side-wall electrodes are used. The integrated device is fabricated by PDMS molding. The mold of the integrated device is fabricated using high-precision mechanical machining. With a unique mold design, the placements of the two piezoelectric materials and the 3D sidewall electrodes are accomplished during the molding process. It is shown that the proposed device can handle the wash and dielectrophoretic separation successfully.
I. INTRODUCTION
Microfluidics, fluid dynamics at microscopic level, has started to find several applications in different fields. One such important field is the field of biomedical devices. Microfluidic device prototypes are being reported by several researchers for medical diagnostics and therapeutics applications. Advantages offered by these devices are increased portability, selectivity, and accuracy in comparison to their desktop counterparts. An important application in medicine for both diagnostic and therapeutic purposes is cell manipulation and separation.1 In cell manipulation and separation, out of a cell mixture, certain types of cells are aimed to move to certain locations or get separated from the rest of the cell population. Before any diagnostic or therapeutic applications, cells are typically removed from the original biological medium and re-suspended in a buffer serum. This process is called cell washing. Sometimes, this process is also performed for the opposite purpose of separation of the biological medium from the cells such as blood plasma collection applications.
Microfluidics offer important advantages in cell processing technologies such as increased selectivity of the separation process as well as increased viability of the separated cells. Standard lab and hospital cell washing/separation processes rely on size differences (membrane separation devices) through use of devices with filters or density separation devices (centrifugal force devices) through use of centrifuges. There are some long standing disadvantages of such conventional devices. Biological cell suspensions are typically highly concentrated, and these concentrated cells can easily clog the filters. Therefore, a cross flow is applied on the filter to clear its surface.1,2 However, this cross flow (or sometimes Taylor vortices are used3–5) increases the Reynolds number of the flow as well as the shear stresses. Shear stress can result in cell damage or unwanted activation of cells6–9 (such as platelet activation leading to clotting of the blood samples). Similar unwanted force fields and shear stresses also occur in centrifugation methods.10 Microfluidics introduce the possibility of using new technologies for cell manipulation, separation, and washing purposes using optical, magnetic, dielectrophoretic, and acoustic principles and fields.1,11 Among these techniques, acoustophoresis (ACP) and dielectrophoresis (DEP) are two label-free particle manipulation techniques, which utilize the intrinsic acoustic and dielectric properties of the particles. DEP, which is the movement of particles in a non-uniform electrical field due to the interaction of the particles dipole and the spatial gradient of the electrical field, has a better selectivity and a good candidate for bio-particle differentiation. DEP can separate bio-particles not only according to their sizes but also if the cells are alive or dead or according to their phases of cell division.12 Some of the disadvantages of the DEP technology is the relatively low throughput (especially for continuous flow devices) as well as localized separation forces only in the close vicinity of the electrodes.1 Moreover, the electrical conductivity of the buffer solution needs to be low to avoid adverse effects of Joule heating under an applied electric field.13 On the other hand, ACP offers an ability to create forces in a wider portion of the micro-channel with a lower selectivity, which makes ACP a good candidate for cell manipulation applications such as cell washing.10,14–17 Therefore, for the application of automated cell separation systems where cell washing and cell separation is performed on a single device, the use of ACP (in cell washing) with DEP (in cell separation) may be a subtle and promising solution with superior results compared to single mode of separation devices.
Although there are many studies in the literature regarding the based bio-particle manipulation with different techniques, there are few studies regarding the integrated and/or hybrid implementation of these techniques which include the hybrid use of magnetophoresis and DEP,18,19 optics and DEP,20,21 optics and ACP,22 and hydrophoresis and DEP.24 Regarding the integration and/or hybrid use of ACP with DEP, the number of studies are also limited.25,26 ACP was utilized to collect the particles in the close vicinity of the DEP electrodes,25 and to manipulate large number of particles into a relatively larger streams as pre-concentrator for a better focusing with reduced variability in the particles location on a silicon chip.25,26 Although hybrid use of different techniques was demonstrated in these studies, except few studies,22,24 different techniques were implemented for a single operation.
Polymer-based devices are usually used for DEP devices.1 However, for ACP applications, silicon is preferable due to its satisfactory acoustic properties (high propagation speed with low attenuation). Although the location of piezoelectric material is not critical for silicon devices, due to high acoustical damping of polydimethylsiloxane (PDMS), the positioning and orientation of the piezoelectric materials are critical in devices with PDMS chips. Although PDMS introduces this challenge for an integrated device, it also offers an advantage for hybrid applications of acoustic devices. PDMS materials acoustic damping makes it easier to prevent the interference of acoustic waves to the other modes of separation. Due to good acoustic properties of silicon, acoustic waves distributed over the device in the case of silicon, meaning that acoustic waves would be felt by the particles throughout the microfluidic device. Even though it is possible to use silicon in multi-mode devices (devices with either different modes of separation or several acoustic frequencies), it requires careful planning for acoustic interference.27,28 However, in the case of PDMS due to the damping effect, acoustic waves are not able to travel far away from the piezoelectric device meaning that two isolated stations (one is for ACP and one is for DEP) can be generated easily. In this study, ACP and DEP are utilized in an integrated manner to combine the two different operations on a single chip in sequential manner, namely, particle wash (buffer exchange) and particle separation. In the washing step, particles are washed with buffer solution with low conductivity for DEP based separation to avoid the adverse effects of Joule heating. Acoustic waves generated by piezoelectric transducers are utilized for washing, which create stationary waves in whole width of the channel. The particles move to pressure nodal points or nodes with the help of the acoustic force, where the location of nodes depends on the width of the channel and frequency of the acoustic waves. The device is designed to have high performance, robust operation, highly reproducible fabrication. Typically, ACP-based devices have higher throughput than DEP-based devices.1 To achieve the throughput matching of ACP and DEP in the integration, 3D side-wall electrodes29 are used for the DEP section. The experiments are performed using polystyrene particles. The integrated device is fabricated by PDMS molding. The mold of the integrated device is fabricated using high-precision mechanical machining. 3D side-wall electrodes were fabricated using wire electric discharge machining.29 With a unique mold design, the positioning of the two piezoelectric transducers (made of Lead Zirconate Titanate ceramic) and the 3D sidewall electrodes are accomplished during the molding process. The paper is organized as follows: In Section II, the computational model used in the design process is discussed. In Section III, the fabrication of the integrated device is presented. In Section IV, the fabricated device is characterized experimentally. Finally, the results are concluded in Section V with final remarks.
II. SIMULATIONS AND DESIGN
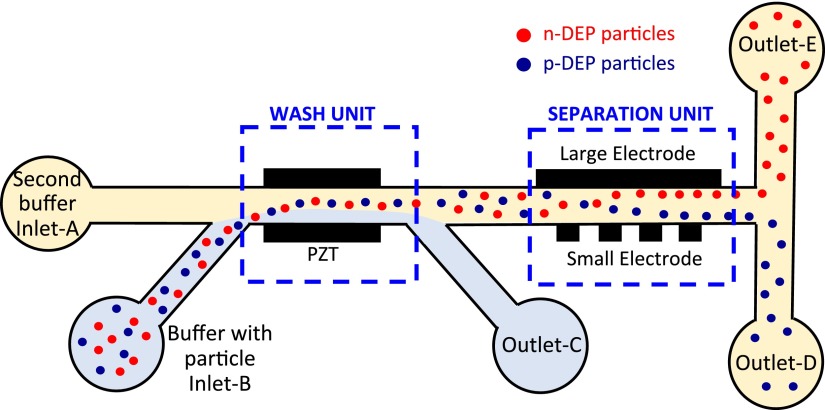
Fig. 1 shows the schematic of the device presented in this work. PZT (Lead Zirconate Titanate) transducers and two metal electrodes are utilized for ACP and DEP, respectively. The principle of ACP is generating stationary acoustic waves and forces on the micro-particles with piezoelectric actuators. The forces depend on compressibility, density, and size of the particles.1 With a proper excitation frequency, the particles can be manipulated to the centerline of the micro-channel. The principle of DEP is the manipulation of particles in a non-uniform electric field.12 In this study, the particle wash (buffer medium exchange) is performed by ACP, and particle separation is performed by DEP. The particles which are originally in a high conductivity buffer solution are loaded into the device through the side inlet and are pushed towards the centerline where a low conductivity buffer solution flowed with the help of ACP. Following particle wash, the particles flow through the separation section where two electrodes are located for DEP manipulation. DEP force is produced in the transverse direction to the flow via applying voltage on the electrodes.
FIG. 1.
Schematic drawing of the integrated microfluidic device.
A. Acoustic system simulations
In order to achieve particle washing, particles which enter the micro-channel from locations which are close to channel walls should move towards the center of the channel where the second buffer solution flows. The force which moves the particles from channel walls to the center is the acoustic radiation force. The acoustic radiation force can be formulated as the negative of the gradient of the acoustic radiation potential
| (1) |
The acoustic radiation potential on a spherical particle is defined as23
| (2) |
| (3) |
where a is the diameter of the spherical particle, ρf and cf are the density of the fluid and the speed of sound in the fluid medium, respectively. ρp and cp are the density of the particle and the speed of sound in the particle's material, respectively. and represent the time averages over a cycle, for the square of the incident acoustic pressure and square of the incident acoustic particle velocity, respectively. Therefore, in order to calculate the acoustic radiation force, it is necessary to know the acoustic properties of the particle and the solution medium as well as the acoustic pressure and velocity at the location of the particle.
In ACP literature, most of the time, acoustic waves are generated by piezoelectric actuator. Piezoelectric actuator is excited at a frequency equal to a frequency, which would result in a standing wave along the width of the channel. The standing waves result in high amplitudes of acoustic pressure inside the channel. This results in an acoustic radiation force which is strong enough to move the particle to the nodal location which is at the center along the width direction of the channel. The simulation of the acoustic radiation force and the particles movement under this force may be important during the design of ACP systems. Such a simulation may result in valuable information such as the correct frequencies and amplitudes to be applied on the piezo actuators. Information such as correct configurations and locations of the piezoelectric actuators required length of the channel can be obtained through simulation of the ACP process. However, an accurate simulation of the ACP process is not straightforward and requires numerical modeling efforts in different physical domains. The complete modeling of ACP requires modeling of an electrical input resulting in a mechanical motion of the piezoelectric actuator. Then, the mechanical motion which creates acoustic waves inside the channel is to be modeled, and the acoustic field inside the channel due to PZT actuator vibrations needs to be simulated. Using the calculated acoustic pressure and acoustic particle velocity, the acoustic radiation forces on each particle, which lead to the determination of the motion of the particles, can be calculated. Additionally, in the presence of fluid flow, the flow field inside the micro-channel needs to be obtained to predict the trajectory of the particles inside the micro-channel.
In this study, a finite element model which accounts for the mechanical behavior of the piezoelectric actuator is implemented using COMSOL Multiphysics. In acoustophoretic simulation studies in the literature, it is not possible to see the effect of the dynamics of the piezoelectric material on the separation efficiency accurately.31–34 This is partly because 3D models which account for PZT actuator mode shapes have not been coupled to the acoustic field inside the micro-channel. In some studies, the mode shapes of the piezoelectric actuator were not modeled, or an analytical expression which is assumed to represent the motion of the piezoelectric actuator along the length of the channel was used.35,36 Such an approach may not be able to accurately capture the complex mode shapes along the axial direction experienced by the piezoelectric actuator at high frequencies and do not consider the coupling of the piezoelectric and chip material. The PZT actuators are assumed to be perfectly coupled to the chip material, and an analysis which couples the piezoelectric material dynamics to the acoustic response through continuity of the velocity field at the piezoelectric and acoustic domain interface was performed. Using this coupled approach, the acoustic pressures inside the chip and the channel are calculated. Once the acoustic pressures and the velocities inside the microchannel are calculated, it is possible to obtain the acoustic radiation force acting on a particle using Eqs. (1)–(3). After the calculation of the acoustic radiation force, following the point-particle approach,30,37 it is assumed that the acoustic force is balanced by the drag force on the particle. The drag force can be calculated by Stokes Law as
| (4) |
where η is the dynamic viscosity of the fluid in the micro-channel, u is the fluid velocity, and is the particle velocity. For the particle size considered in this study, the characteristic time scale of acceleration period of the motion is in the order of (Ref. 38), which is much smaller than the time scale of the variation of the field variables. Therefore, the inertia of the particle is neglected, and it is assumed that the particles move with the terminal speed at all times. Using point-particle approach (i.e., neglecting the effect of particles on flow field), the flow inside the micro-channel is assumed to be fully developed. Therefore, the fully developed velocity profile inside a rectangular channel for a given volumetric flow rate (Q) can be obtained using integral transform techniques as39
| (5) |
where βm and λn's are the eigenvalues defined as
| (6) |
where wchan and hchan are the width and the height of the micro-channel, respectively (see Fig. 2). Once the velocity field and the acoustic radiation force field are known, the velocities of a particle along all three principle directions can be calculated using Eq. (4). Assuming constant particle velocity for a small time interval , the new position of the particle can be determined. This cycle can be repeated until the end time for the simulation is reached. Some assumptions used in this numerical modeling are that the acoustic radiation field does not disturb the flow field, in other words acoustic streaming is ignored. Considering the size of the particles used in this study (), Brownian motion of the particles is not accounted. The buffer solution is dilute enough to ignore the disturbance in the acoustic field as well as the particle to particle interactions. Moreover, note that Eqs. (1)–(3) are valid for fluids with low viscosity.
FIG. 2.
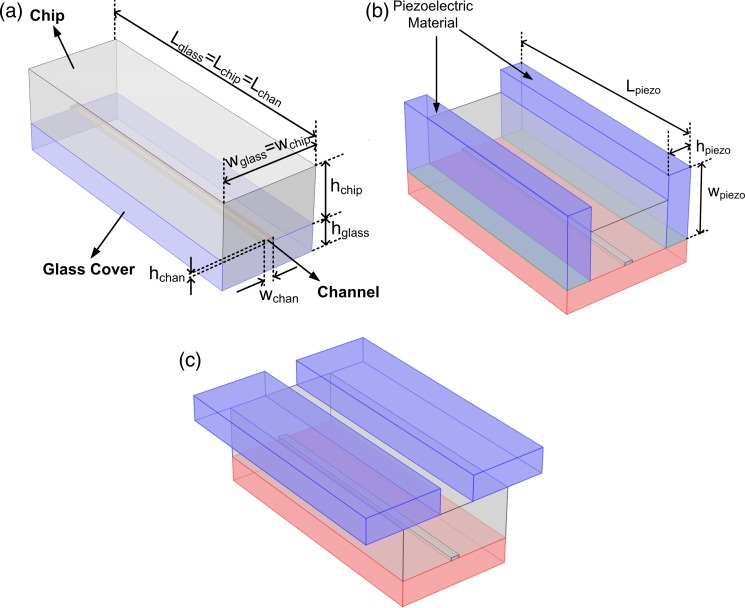
Computational domain: (a) Without PZT actuator (case-A), (b) PZT actuators are at the side-walls (case-B), and (c) PZT actuators are on the top (case-C).
The simulations are performed to understand the effects of PZT actuator on the acoustic pressure inside the micro-channel. Three different cases are evaluated. In the first case (case-A), there is no PZT actuators in the model, and it is assumed that there is a plane acoustic wave field along the side-walls of the channel. In the second case (case-B), PZT actuators are placed along the side-wall of the channel. In the third case (case-C), the PZTs are placed on the top of the channel. The schematic drawing of the all three cases can be seen in Fig. 2. The geometric parameters and material properties used in the simulations are given in Tables I and II.
TABLE I.
Geometric parameters used in the simulations.
| Case-A | Case-B | Case-C | |
|---|---|---|---|
| (cm) | 1.0 | 1.0 | 1.0 |
| wchip (mm) | 3.42 | 3.42 | 3.42 |
| hchip (mm) | 2.0 | 2.0 | 2.0 |
| wglass (mm) | 3.42 | 5.42 | 3.42 |
| hglass (mm) | 1.0 | 1.0 | 1.0 |
| hpiezo (mm) | … | 1.0 | 1.0 |
| wpiezo (mm) | … | 3.0 | 3.0 |
| Lpiezo (mm) | … | 1.0 | 1.0 |
| hchan (μm) | 120 | 120 | 120 |
| wchan (μm) | 330 | 330 | 330 |
TABLE II.
Material properties used in the simulations.
| Fluid properties | Particle properties | PZT actuator properties | |
|---|---|---|---|
| Type | Saline | Polystyrene | PZT-4 |
| Density (kg/m3) | 1004.6 | 1050 | 7500 |
| Nominal diameter (μm) | … | 5.0 | … |
| Dynamic viscosity (Pa s) | 10−3 | … | … |
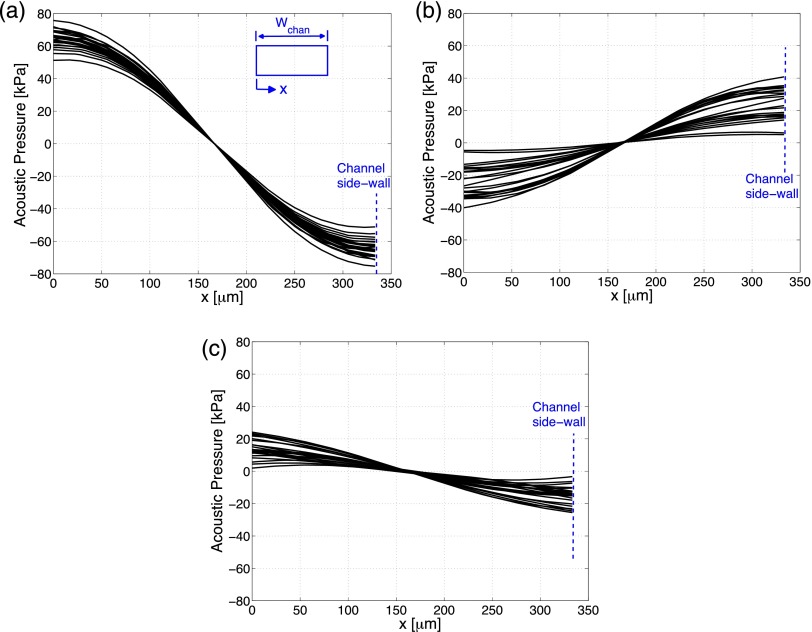
Fig. 3 shows the simulation results of the acoustic pressure field along the length of the channel for three different cases. There are 25 lines on this plot, and each one of them shows the calculated pressure distribution along the width direction of the channel at a different location along the channel. In terms of height location inside the channel, the acoustic pressure at the mid-height of the channel is plotted. As seen from Fig. 3, the pressure is zero at the center of the channel. This means that micro-particles move to the center of the channel as expected. For case-A, the curves are close to each other which indicates that there is a little change in acoustic pressure distributions along the length of the channel in terms of both the pressure amplitudes and the slopes of the curves. For case-B, the voltage applied on the PZT actuators is such that average pressure created on the side-walls of the channel is the same as in the plane wave case. However, it can be observed from Fig. 3(a) that there is a slight decrease in the maximum amplitudes of the acoustic pressure inside the channel. The more important difference is in the variation of the acoustic pressures along the channel. The variations of the acoustic pressures along the length of the channel are now pronounced. The slope of the curves is also decreased. Eqs. (1)–(3) reveal that the slope of the acoustic pressure curve is also important, since gradient with respect to position variables is calculated. Therefore, it can be concluded that the acoustic radiation force in case-B is decreased and has a different distribution along the width of the channel. This case study shows that inclusion of the PZT dynamics changes acoustic radiation forces. For case-C (PZT actuator is placed on top), the differences are more pronounced. It can be observed from Fig. 3(c) that the acoustic pressure amplitudes are decreased along with the decrease in the slopes of the acoustic pressure curves. It was also reported in literature that the configuration where the PZT actuators are at the top of the channel gives less favorable results for polymer materials with high loss,40 which is also verified by the simulations for the first time.
FIG. 3.
Acoustic pressure distribution in the width direction of the channel evaluated at 25 different locations along the channel: (a) case-A, (b) case-B, and (c) case-C.
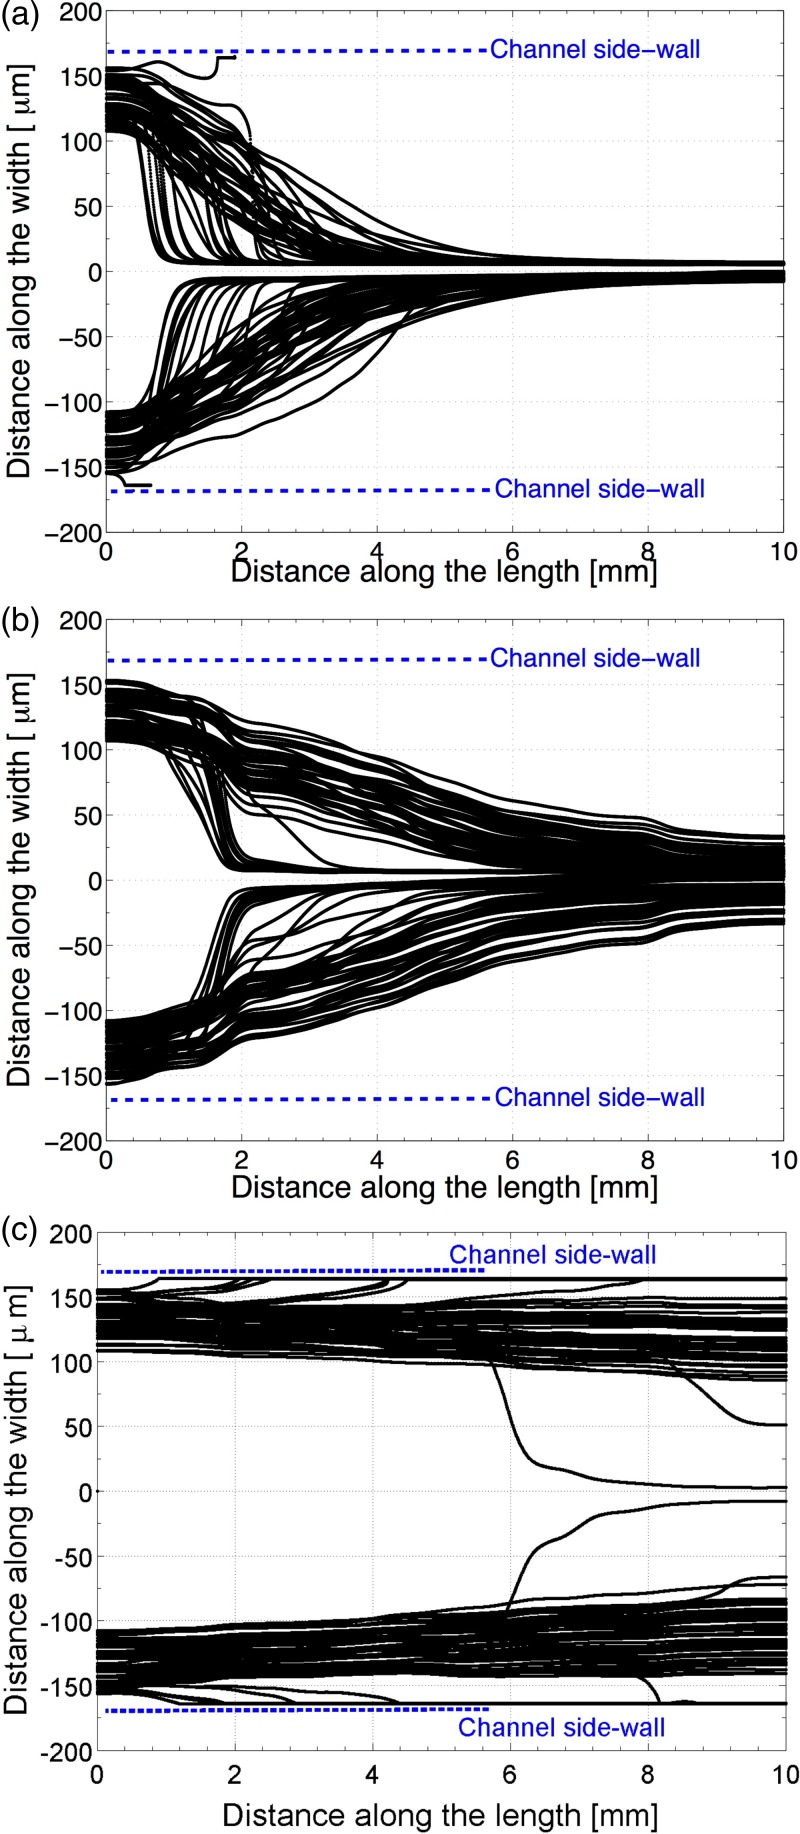
As the next step in simulations, the trajectories of the micro-particles along the channel are simulated. In order to perform the simulations, 100 polystyrene micro-particles with a diameter of are considered. This diameter value is the nominal diameter. For individual micro-particles, a normal distribution on diameter values is applied. The standard deviation for the particle diameter is 10% of the nominal diameter according to micro-particle manufacturers catalogue (PolyScience). Moreover, the starting locations of micro-particles along the width of the channel are taken to be different, since physically it is not possible for every micro-particle to enter the channel from the same location. It is assumed that the particles have a uniform distribution in terms of starting locations. It is assumed that the particles can enter the micro-channel anywhere from the channel wall to 1/6 of the channel width. The starting location of the particles is important, since flow field changes with the distance from the channel walls. Therefore, depending on the starting location, each particle has a different trajectory even if they are under same the acoustic radiation forces. So, in the simulations, each particle has a different diameter, and they start from a different location to their motion towards the center of the channel. The trajectories of particles for each case are plotted on Fig. 4. It can be clearly seen that the plane wave acoustic input case gives the best results. Fig. 4(a) shows that micro-particles quickly converge to the center of the channel. After the inclusion of PZT dynamics in the simulation, the trajectories of the micro-particles have changed. Fig. 4(b) illustrates that micro-particles move less towards the center, and after of exposure to acoustic waves significant number of them are not at the center of the channel yet. Fig. 4(c) reveals that case-C gives significantly worse results. The particles barely left the side walls of the channel, and only a couple of micro-particles are able to reach the center after of exposure to acoustic waves. This result is in agreement with the literature, which states that if polymer materials with high loss factor are used as chip material, then the side PZT configuration case-B gives better results.40
FIG. 4.
Particle trajectories along the channel: (a) case-A, (b) case-B, and (c) case-C.
The results of acoustophoretic simulations provide some valuable input to the integrated chip and the mold design process. The simulation results verify that for a PDMS chip material, PZT actuators should be placed on the side-walls of the material. Moreover, simulations showed that the dynamics of PZT actuators have an important effect on the response. Actually, further simulation studies (not presented in this study) show that performance is highly sensitivity to symmetrical placement and identical geometry of the PZT actuators. These results have driven the mold design to include notches to mark the locations where PZT actuators should be placed before pouring the PDMS material in the mold.
B. Design of the integrated device
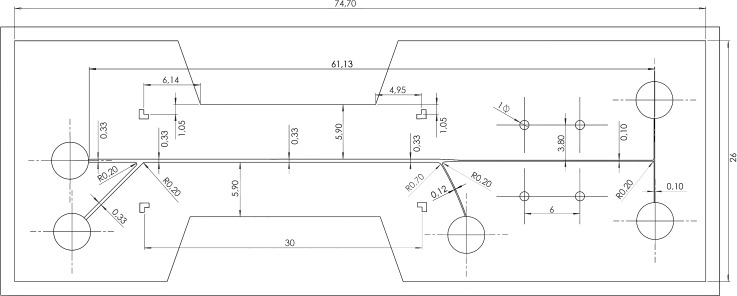
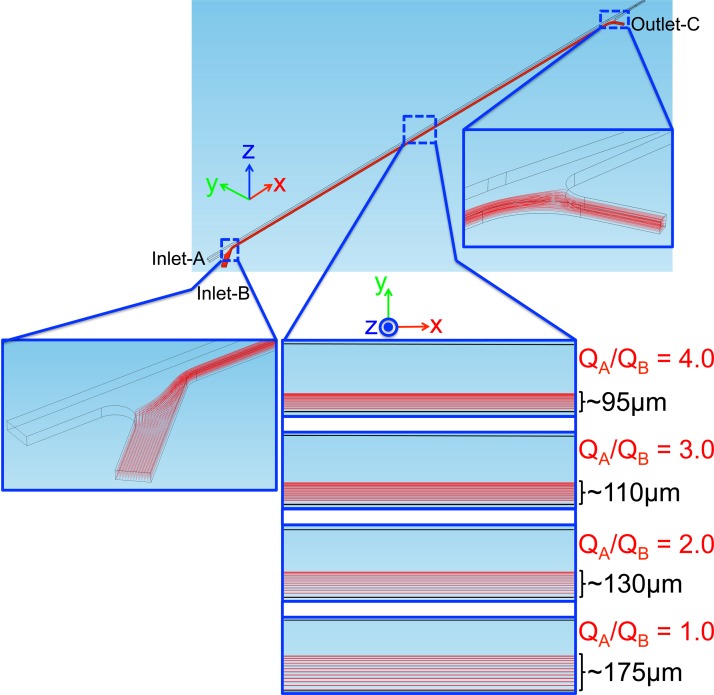
Extensive simulations for DEP-based particle manipulation were presented previously.29 Therefore, our previous design with 3D side-wall electrodes has been implemented in our integrated device. Following the ACP simulations, the length of the wash unit is selected as , and the width of the channel is selected as . The height of the channel is selected as for the ease of fabrication. A side inlet channel with a width of is introduced with an angle of for the particle buffer. A side outlet channel also introduced at the end of the wash unit. The width of the main channel decreases from to at the separation unit. The hydrodynamic resistance for the channel through side outlet and the channel for separation unit is not comparable, since the length of the separation unit is considerably longer. To obtain comparable hydrodynamic resistance, a serpentine micro-channel is first introduced for the side outlet which has a similar length with the separation unit; however, it is observed that a long side channel creates some problems at the fabrication step. Instead, a shorter side outlet channel is preferred, which leads to the necessity for the control of the liquid level at the outlet-C to adjust the volumetric flow rate through the side outlet channel. The width of the side outlet channel is selected as . The drawing of the mold with the dimensions can be seen in Fig. 5. The ratio of the volumetric flow rates through inlet-A and inlet-B for a successful operation is determined via flow field simulations. To obtain the flow field, incompressible Navier-Stokes equation is used
| (7) |
where u is the fluid velocity, p is the pressure, ρ is the density, and μ is the dynamic viscosity of the fluid. Simulations are performed for water (). For a successful operation of the device, we need to make sure that the particles flow from inlet-B to outlet-C in the vicinity of the side wall on the outlet-B and outlet-C side when the PZT actuators are not activated. When the PZT actuators are activated, particles should move towards the center and flow through the separation unit. The volumetric flow rate of the inlet-B is fixed at , and several ratios are simulated. The half of the channel is simulated due to the symmetry, the inlet flow rates (QA, QB) and the outlet flow rate of the outlet-C (QC = QB) are assigned. For the outlets of the separation unit, pressure is set to zero. All other boundaries are set to no-slip boundary condition. The simulated particle trajectories are shown in Fig. 6. The particle trajectories at the inlet junction and the outlet junction are also included in the figure, but for the clarity of the figure only the results for are given at the junctions. As long as the pressure of the outlet-C is adjusted such that the same flow rate with inlet-B is flowing out through the side exit, all the particles are coming from inlet-B is flowing out to outlet-C. As the ratio of the flow rates decreases, the bandwidth of the particle solution in the main channel increases. When the PZT actuators are activated, the particles move towards the centerline of the channel, and again the particles move to region with a certain bandwidth. In order to make sure that as the particles move into the center, they will change the buffer solution and flow to the separation unit, the two bandwidths of the PZT inactive and PZT active case should not overlap. To avoid this overlap, is selected in this study.
FIG. 5.
Drawing of the mold.
FIG. 6.
Streamlines in the wash unit for different volumetric flow rates.
III. FABRICATION OF THE DEVICE
The fabrication of the mold is performed by high-precision mechanical machining. The 3D sidewall electrodes of the DEP section are placed manually at the side-wall as suggested in Ref. 29. During this process, to avoid the damage on the micro-channel, micro-channel needs to have some rigidity; therefore, metallic molds are a suitable option. Positioning of PZT actuators is critical for the successful operation of the washing unit. Therefore, notches for the positioning of PZT actuators are also included in the mold design. Machining operations are conducted on a DECKEL MAHO-HSC55 milling center equipped with NSK HES510-HSKA63 high speed spindle with a run out less than 1 μm. In order to have better control on Z-levels, the mold is mounted on a KISTLER-9256C1 mini-dynamometer. The first step of machining process is the face milling with a 2 mm diameter end mill to ensure flatness of stock surface. Next, pocket milling is carried out to open mold cavity. Then, contour milling operations of the micro-channel and the guide pins are performed. Afterwards, drilling operation is carried out for M2 screws at the sides of the mold. Finally, tap milling is performed for M2 screws in the side of the mold. The machining parameters are tabulated in Table III.
TABLE III.
Machining parameters of the brass mold.
| Spindle speed (rpm) | Tool dia. (mm) | Feed rate (mm/min) | Depth of cut (mm) | |
|---|---|---|---|---|
| Rough | 12000 | 2.0 | 350 | 0.20 |
| Semi-finish | 35000 | 0.4 | 400 | 0.12 |
| Finish | 45000 | 0.2 | 350 | 0.10 |
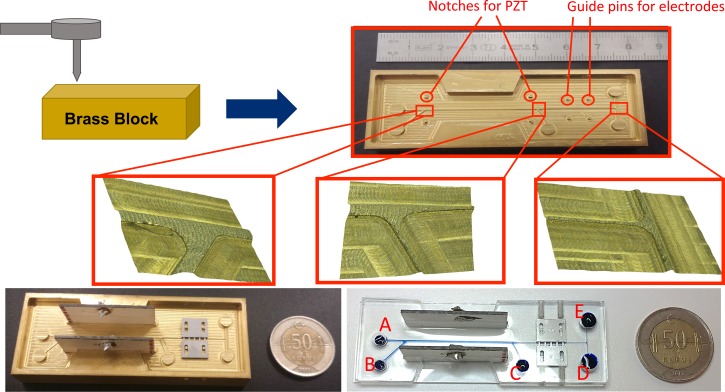
Fig. 7 shows the fabricated brass mold for integrated microfluidic device, and its optical microscope images are provided for three junctions of the device in order to achieve high precision machining during fabrication. The four pins are used for proper placement of electrodes, where they are fixed using screws. The resulting micro-channel has height and length. The channel width for the DEP side is . The design incorporates five reservoirs with height and diameter for robust tube connection. The thickness of the microfluidic device is . PDMS molding starts with mixing PDMS and curing agent with the ratio of 10:1. Next, two PZT slides are placed stand upright carefully with the help of guide structures. Then, the electrodes are placed in the cavity by the help of guide pins, and screws are tightened to prevent the leakage of the PDMS in the interface of micro-channel and electrodes. Finally, PDMS and curing agent mixture are poured into the mold, and it is placed in an oven for curing at for 90 min. After curing, the chip is peeled off from the mold with embedded PZT actuators and electrodes. In the next step, the PDMS chip is bonded to a glass slide by plasma treatment (PDC-32G). Then, the inlet and outlet reservoirs are punched out, and the channel is checked for flow by using distilled water. Next, the power cables are soldered to PZT actuators. Finally, the metal pins are immobilized in such a way to touch the electrodes, and the chip is placed on a 3D-printed base to acquire images from the inverted microscope.
FIG. 7.
Fabricated brass mold, PZT actuators and electrode assembly, and the final device.
IV. EXPERIMENTATION AND RESULTS
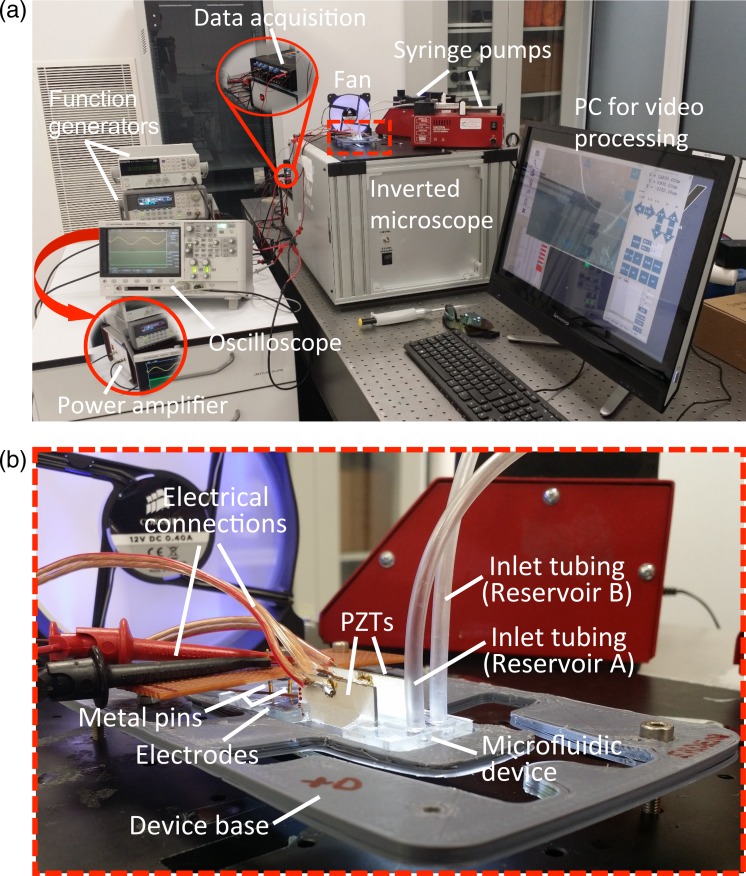
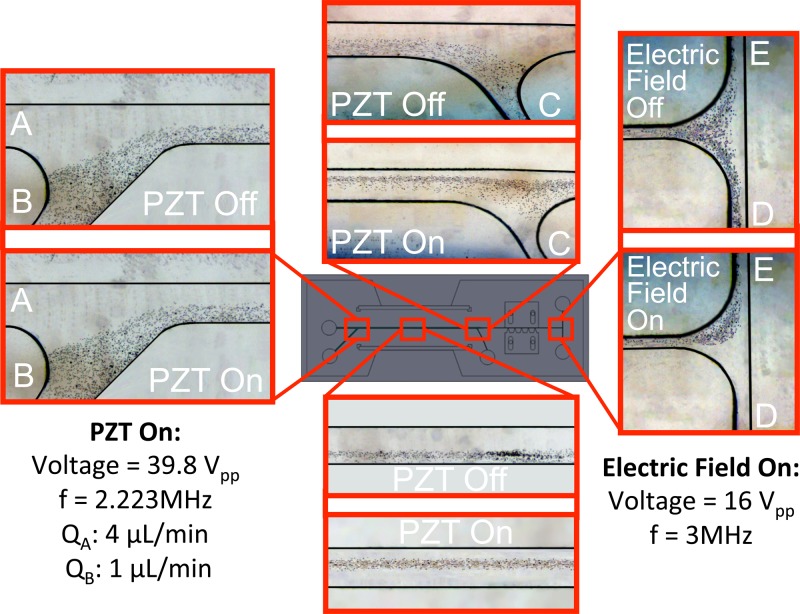
Following the fabrication of the device, the device is characterized experimentally. The experimental setup, shown in Fig. 8, consists of a laboratory syringe pump (New Era Pump Systems-NE 300), two function generators (Agilent 33250A, GWInstek SFG-2004), an amplifier (Falco Systems WMA-300), an inverted optical microscope (μMIT-inv, AIV Labs), a digital storage oscilloscope (Agilent DSO-X 2012A), a touch-screen computer, glass syringes, tubings, and a cooling fan. Prior to the experiments, microfluidic device is set on a 3D-printed base, and necessary electrical and fluidic connections are assembled. First set of experiments are performed with diameter latex particles (Latex Spheres BCR–Certified reference material by InterLab Inc.), which show n-DEP response to demonstrate particle wash and particle manipulation. A buffer solution in which diameter latex particles are suspended in deionized (DI) water (the conductivity of the buffer solution is measured by using conductivity meter, HANNA Instruments, HI 9812-5). A particle concentration of is used in these set of experiments. Particle solution is loaded into a glass syringe to be mounted to inlet-B. A low electrical conductivity DI water is connected to the inlet-A. First, the channel is washed by DI water to get rid of any contamination inside the channels. Then, particle buffer is sent into the channel, and first the liquid level of the side outlet is adjusted such that the particles flowing through the side inlet (inlet-B) flow out through the side outlet (outlet-C) when the PZT actuators are not active. Then, the PZT actuators are actuated. Following the particle wash experiments, electric field is switched on and off to observe the DEP based manipulation. Due to the dielectric properties of the latex particles, only n-DEP response can be observed. For the wash experiments, two PZT actuators (Ferroperm PZ-26) which work in the opposite phase are used. It is observed in wash studies that the temperature in the chip increases during separation. The performance of the device is observed to be dependent on the temperature. This performance dependence on temperature was observed in other studies as well which resulted in addition of temperature control mechanisms to the experiments.41,42 Therefore, for controlling the temperature, a passive fan is used during the experiments.
FIG. 8.
(a) Experimental set-up and (b) blown-up figure for the microfluidic device.
At first, four set of experiments are conducted with different flow rates following the aforementioned procedure to see the performance of the device at different throughputs:
-
•
Case-1:
-
•
Case-2:
-
•
Case-3:
-
•
Case-4: .
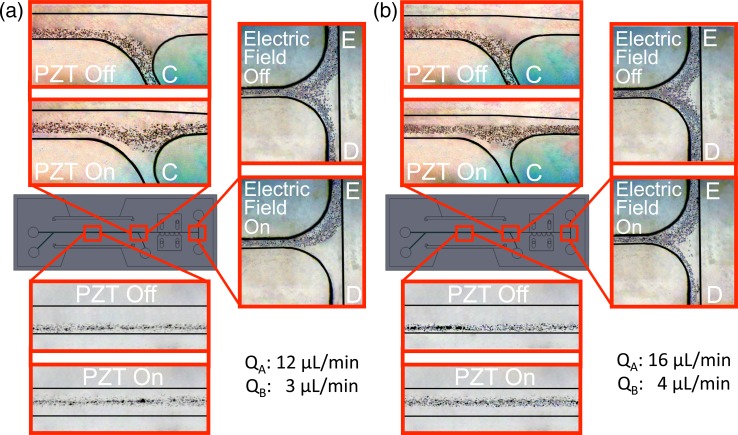
Fig. 9 shows the experimental results for the case-1. As seen from the figure, desired particle motion is achieved for both wash and the separation unit. The same experiment is conducted for the other cases following the same procedure. The results for case-3 and case-4 are shown in Fig. 10. The results of the case-2 are not included, since exactly the same behavior that of case-1 is achieved. The particle trajectories at the inlet junction are also excluded for the clarity of the figures. As seen from Fig. 10, the successful operation of both units is observed for case-3. For case-4, the successful operation for the wash unit is observed; however, the flow rate is observed to be too high for the separation unit to manipulate the micro-particles (which is quite expected based on our previous study29).
FIG. 9.
Particle trajectories (case-1).
FIG. 10.
Particle trajectories: (a) case-3 and (b) case-4.
The motivation for the wash unit is that the bio-particles are typically suspended in a high-conductivity buffer solution. High-conductivity buffer has adverse effect on DEP manipulation.12,13 Therefore, the bio-particles need to be placed into a low-conductivity buffer (i.e., dilute solution). In our design, this step is achieved by the wash unit. Particles are suspended in a high conductivity buffer in inlet-B. Low conductivity buffer solution is loaded from inlet-A, and the particles are moved from high-conductivity buffer to a low-conductivity buffer at the end of the wash section. In order to verify if the medium exchange is achieved, and to quantify the medium exchange, the electrical conductivity of the outlet reservoirs are measured. In order to be able to measure the electrical conductivity of a sample with a conductivity meter at least couple of ml of sample is required. Regarding the volumetric flow rates in our study, collecting a ml of sample is not possible. Therefore, we propose to measure the resistance of the buffer solution in a separate micro-channel. The samples collected from outlet-D and outlet-E are loaded into a single micro-channel, and the resistance of the micro-channel is measured via a multimeter. Similar measurements are also performed for inlet-A and inlet-B prior to the experiments. The electrical conductivity measurements are performed for two extreme cases, case-1 and case-4. Table IV shows the readings from the conductivity meter and the multimeter for both cases together with the uncertainty values. Last column shows the value if the two inlet streams experienced complete mixing. To quantify the mixing, mixing efficiency [] is also evaluated. Mixing efficiency close to zero indicates the medium exchange, and close to unity indicates mixing rather than medium exchange. As seen from the results, the resistance of the samples at the outlets have a resistance closer to that of the inlet-A. It can be observed that there is some mixing of fluid occurring along the length of the channel. It was reported in literature that acoustic radiation forces may cause mixing at the interface of fluids with different acoustic impedances.43,44 In our case however, the difference of acoustic impedances of the fluids flowing from the center and the side inlet is less than 0.13%, which points out that mixing is not likely due to acoustic mixing but rather due to the diffusion of the ions inside the channel in the wash unit. Moreover, carried high conductivity fluid (i.e., low resistance) by the particles into the low-conductivity stream (i.e., high resistance) also contributes to the deviation of the result from the ideal case. Although the particle manipulation point of view, device operates successfully, as seen from the results, the mixing efficiency increases with the higher volumetric flow rate which can be attributed to the high-conductivity buffer drag with the particles. Since the throughput of the system increases with the volumetric flow rate, more particles travel from one buffer to the other one per unit time which creates mixing rather than medium exchange.
TABLE IV.
Measured electrical conductivity and resistance values.
| Inlet-A | Inlet-B | Outlet D and E | Outlet D and E (complete mixing) | η | ||
|---|---|---|---|---|---|---|
| Case-1 | 520 ± 10 | 1710 ± 34 | … | 0.37 ± 0.08 | ||
| Resistance (R) (MΩ) | 2.32 ± 0.02 | 0.82 ± 0.01 | 2.21 ± 0.02 | 2.02 ± 0.01 | ||
| Case-4 | 960 ± 19 | … | 240.0 ± 4.4 | 0.92 ± 0.06 | ||
| Resistance (R) (MΩ) | 19.58 ± 0.20 | 1.92 ± 0.02 | 16.34 ± 0.16 | 16.05 ± 0.06 |
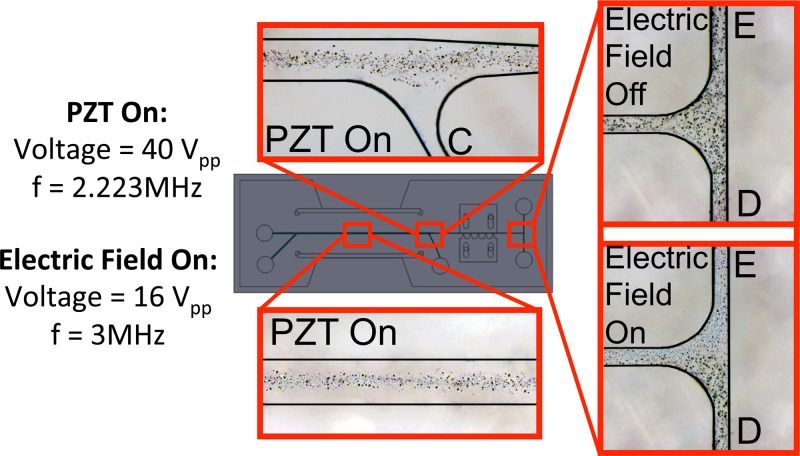
Following the detailed first set of experiments, another experiment is performed to demonstrate the particle wash followed by particle separation rather than particle manipulation. For p-DEP response, diameter latex particles are half-coated with aluminum with a sputtering process. Half-coated and uncoated particles are mixed prior to the experiments. A buffer solution with a particle concentration of is prepared prior to the experiment. The flow rate values for case-1 are used. The coated and uncoated particles have the same size; therefore, differentiation of the images of the particles is challenging. To differentiate the particles, some image processing has been performed to generate the contrast between these particles. Fig. 11 shows the experimental results. The half-coated particles can be seen as darker, and due to the reflection of the light from the metal surface, the half-coated particles can be seen as darker and larger than the uncoated particles. The uncoated particles can be seen as blue-like color in the figure. As seen from the figure, the particles are successfully pushed to the middle of the channel in the wash section, and p-DEP (half-coated) and n-DEP (uncoated) particles are separated. Although it is challenging to get n-DEP and p-DEP response from latex particles, many bio-particles exhibit p-DEP and n-DEP response as a function of frequency,12 which may lead to the use of the current design for bio-particle applications.
FIG. 11.
Particle trajectories for the experiment with p-DEP (half-coated) and n-DEP (uncoated) latex particles.
V. CONCLUDING REMARKS
A wash unit based on ACP and a separation unit based on DEP are integrated on a microfluidic device. This integrated device is fabricated using PDMS molding. The geometry of the mold along with features on the mold is decided by coupled electro-mechanical and acoustofluidic numerical simulations. The results of the simulations showed that for a successful operation of the device, side orientation and symmetric as well as repeatable piezoelectric actuator positioning are important. To ensure repeatable performance, a unique mold is designed for the precise alignment of the PZT actuators and 3D side-wall electrodes. Combining two widely used tasks, washing and separation on a single chip without dielectrophoretic and acoustophoretic processes effecting each other are an important step in multi-functional microfluidic devices. Moreover, the use of an inexpensive polymer such as PDMS and implementing molding process in manufacturing enable low cost per unit as well as high volume manufacturing, which are both important in medical device commercialization. Several experiments with different flow rates are conducted to demonstrate the successful operation of the device. Successful operation of the device is shown with particle trajectories as well as the electrical conductivity measurements. It is observed in experiments that thermal management of the chip and PZT actuators are important for stable and consistent performance. Since repeatable performance is essential in commercialization, we plan to implement a thermal management unit to the system in future studies. It is believed that the design and fabrication approaches employed in this study along with further thermal management and throughput improvements may lead the way to a successful commercial lab-on-a-chip cell processing devices for diagnostic and therapeutic clinical applications.
ACKNOWLEDGMENTS
Financial support from the Turkish Scientific and Technical Research Council (Grant No. 112M102) is greatly appreciated.
References
- 1. Cetin B., Ozer M. B., and Solmaz M. E., Biochem. Eng. J. 92, 63 (2014). 10.1016/j.bej.2014.07.013 [DOI] [Google Scholar]
- 2. Marinaccio P. J. and Repetti R. V., “ Cross-flow filtration,” U.S. patent 4888115 (19 December 1989).
- 3. Ohashi K., Tashiro K., Kushiya F., Matsumoto T., Yoshida S., Endo M., Horio T., Ozawa K., and Sakai K., ASAIO Trans. 34(3), 300 (1988). [PubMed] [Google Scholar]
- 4. Lueptow R. M. and Hajiloo A., ASAIO Trans. 41, 182 (1995). 10.1097/00002480-199506000-00011 [DOI] [PubMed] [Google Scholar]
- 5. Ameer G., Langer R. S., Rupnick M., Ploegh H. L., and Grovender E., “ Apparatus for treating whole blood comprising concentric cylinders defining an annulus there between,” U.S. patent 6099730 (8 August 2000).
- 6. Nobili M., Sheriff J., Morbiducci U., Redaelli A., and Bluestein D., ASAIO Trans. 54, 64 (2008). 10.1097/MAT.0b013e31815d6898 [DOI] [PMC free article] [PubMed] [Google Scholar]
- 7. Hagberg I., Akkok C., Lyberg T., and Kjeldsen-Kragh J., Transfusion 40, 182 (2000). 10.1046/j.1537-2995.2000.40020182.x [DOI] [PubMed] [Google Scholar]
- 8. Alemu Y. and Bluestein D., Artif. Organs 31, 677 (2007). 10.1111/j.1525-1594.2007.00446.x [DOI] [PubMed] [Google Scholar]
- 9. Gutensohn K., Geidel K., Brockmann M., Siemensen M., Krueger W., Kroeger N., and Kuehnl P., Transfusion 42, 1373 (2002). 10.1046/j.1537-2995.2002.00194.x [DOI] [PubMed] [Google Scholar]
- 10. Hawkes J. J., Barber R. W., Emerson D. R., and Coakley W. T., Lab Chip 4, 446 (2004). 10.1039/b408045a [DOI] [PubMed] [Google Scholar]
- 11. Qiu Y., Wang H., Demore C. E. M., Hughes D. A., Glynne-Jones P., Gebhardt S., Bolhovitins A., Poltarjonoks R., Weijer K., Schonecker A., Hill M., and Cochran S., Sensors 14, 14806 (2014). 10.3390/s140814806 [DOI] [PMC free article] [PubMed] [Google Scholar]
- 12. Cetin B. and Li D., Electrophoresis 32, 2410 (2011). 10.1002/elps.201100167 [DOI] [PubMed] [Google Scholar]
- 13. Cetin B. and Li D., Electrophoresis 29, 994 (2008). 10.1002/elps.200700601 [DOI] [PubMed] [Google Scholar]
- 14. Kersaudy-Kerhoas M. and Sollier E., Lab Chip 13, 3323 (2013). 10.1039/c3lc50432h [DOI] [PubMed] [Google Scholar]
- 15. Li S., Ding X., Mao Z., Chen Y., Nama N., Guo F., Li P., Wang L., Cameron C. E., and Huang T. J., Lab Chip 15, 331 (2015). 10.1039/C4LC00903G [DOI] [PMC free article] [PubMed] [Google Scholar]
- 16. Augustsson P., Aberg L. B., Sward-Nilsson A.-M. K., and Laurell T., Microchim. Acta 164, 269 (2009). 10.1007/s00604-008-0084-4 [DOI] [Google Scholar]
- 17. Petersson F., Nilsson A., Jonsson H., and Laurell T., Anal. Chem. 77, 1216 (2005). 10.1021/ac048394q [DOI] [PubMed] [Google Scholar]
- 18. Issadore D., Franke T., Brown K. A., Hunt T., and Westervelt R. M., J. Microelectromech. Syst. 18, 1220 (2009). 10.1109/JMEMS.2009.2030422 [DOI] [PMC free article] [PubMed] [Google Scholar]
- 19. James C. D., McClain J., Pohl K. R., Reuel N., Achyuthan K. E., Bourdon C. J., Rahimian K., Galambos P. C., Ludwig G., and Derzon M. S., J. Micromech. Microeng. 20, 045015 (2010). 10.1088/0960-1317/20/4/045015 [DOI] [Google Scholar]
- 20. Kumar A., Williams S. J., Chuang H.-S., Green N. G., and Wereley S. T., Lab Chip 11, 2135 (2011). 10.1039/c1lc20208a [DOI] [PubMed] [Google Scholar]
- 21. Hwang H. and Park J.-K., Lab Chip 11, 33 (2011). 10.1039/C0LC00117A [DOI] [PubMed] [Google Scholar]
- 22. Thalhammer G., Steiger R., Meinschad M., Hill M., Bernet S., and Ritsch-Marte M., Biomed. Opt. Express 2, 2859 (2011). 10.1364/BOE.2.002859 [DOI] [PMC free article] [PubMed] [Google Scholar]
- 23. Gor'kov L. P., Sov. Phys. Dokl. 6, 773 (1962). [Google Scholar]
- 24. Yan S., Zhang J., Pan C., Yuan D., Alici G., Du H., Zhu Y., and Li W., J. Micromech. Microeng. 25, 084010 (2015). 10.1088/0960-1317/25/8/084010 [DOI] [Google Scholar]
- 25. Wiklund M., Gunther C., Lemor R., Jager M., Fuhr G., and Hertz H. M., Lab Chip 6, 1537 (2006). 10.1039/b612064b [DOI] [PubMed] [Google Scholar]
- 26. Ravula S. K., Branch D. W., James C. D., Townsend R. T., Hill M., Kaduchak G., Ward M., and Brener I., Sens. Actuators, B 130, 645 (2008). 10.1016/j.snb.2007.10.024 [DOI] [Google Scholar]
- 27. Augustsson P., Magnusson C., Nordin M., Lilja H., and Laurell T., Anal. Chem. 84, 7954 (2012). 10.1021/ac301723s [DOI] [PMC free article] [PubMed] [Google Scholar]
- 28. Iranmanesh I., Ramachandraiah H., Russom A., and Wiklund M., RSC Adv. 5, 74304 (2015). 10.1039/C5RA16865A [DOI] [Google Scholar]
- 29. Zeinali S., Cetin B., Oliaei S. N. B., and Karpat Y., Electrophoresis 36, 1432 (2015). 10.1002/elps.201400486 [DOI] [PubMed] [Google Scholar]
- 30. Buyukkocak S., Ozer M. B., and Cetin B., Microfluid. Nanofluid. 17, 1025 (2014). 10.1007/s10404-014-1398-7 [DOI] [Google Scholar]
- 31. Townsend R., Hill M., Harris N., and White N., Ultrasonics 44, e467 (2006). 10.1016/j.ultras.2006.05.025 [DOI] [PubMed] [Google Scholar]
- 32. Cappon H. and Keesman K. J., IEEE Trans. Ultrason., Ferroelectr., Freq. Control 60, 614 (2013). 10.1109/TUFFC.2013.2603 [DOI] [PubMed] [Google Scholar]
- 33. Neild A., Oberti S., Haake A., and Dual J., Ultrasonics 44, e455 (2006). 10.1016/j.ultras.2006.05.168 [DOI] [PubMed] [Google Scholar]
- 34. Neild A., Oberti S., and Dual J., Sens. Actuators, B 121, 452 (2007). 10.1016/j.snb.2006.04.065 [DOI] [Google Scholar]
- 35. Muller P. B., Barnkob R., Jensen M. J. H., and Bruus H., Lab Chip 12, 4617 (2012). 10.1039/c2lc40612h [DOI] [PubMed] [Google Scholar]
- 36. Barnkob R. and Bruus H., in Proceedings of Meetings on Acoustics ( Acoustical Society of America, 2009), Vol. 6, p. 020001. [Google Scholar]
- 37. Cetin B., Buyukkocak S., Zeinali S., and Ozer B., in ASME 4th International Conference on Micro/Nanoscale Heat and Mass Transfer (2013), p. 22181. [Google Scholar]
- 38. Kang K. H., Xuan X., Kang Y., and Li D., J. Appl. Phys. 99, 064702 (2006). 10.1063/1.2180430 [DOI] [Google Scholar]
- 39. Karakaya Z., Baranoglu B., Cetin B., and Yazici A., CMES-Comput. Model. Eng. Sci. 104, 227 (2015). 10.3970/cmes.2015.104.227 [DOI] [Google Scholar]
- 40. Lenshof A., Evander M., Laurell T., and Nilsson J., Lab Chip 12, 684 (2012). 10.1039/c1lc20996e [DOI] [PubMed] [Google Scholar]
- 41. Adams J. D., Ebbesen C. L., Barnkob R., Yang A. H. J., Soh H. T., and Bruus H., J. Micromech. Microeng. 22, 075017 (2012). 10.1088/0960-1317/22/7/075017 [DOI] [Google Scholar]
- 42. Augustsson P., Barnkob R., Wereley S. T., Bruus H., and Laurell T., Lab Chip 11, 4152 (2011). 10.1039/c1lc20637k [DOI] [PubMed] [Google Scholar]
- 43. Johansson L., Johansson S., Nikolajeff F., and Thorslund S., Lab Chip 9, 297 (2009). 10.1039/B815114H [DOI] [PubMed] [Google Scholar]
- 44. Deshmukh S., Brzozka Z., Laurell T., and Augustsson P., Lab Chip 14, 3394 (2014). 10.1039/C4LC00572D [DOI] [PubMed] [Google Scholar]


