Abstract
We have shown that GnRH-mediated engagement of the cytoskeleton induces cell movement and is necessary for ERK activation. It also has previously been established that a dominant negative form of the mechano-GTPase dynamin (K44A) attenuates GnRH activation of ERK. At present, it is not clear at what level these cellular events might be linked. To explore this, we used live cell imaging in the gonadotrope-derived αT3–1 cell line to determine that dynamin-green fluorescent protein accumulated in GnRH-induced lamellipodia and plasma membrane protrusions. Coincident with translocation of dynamin-green fluorescent protein to the plasma membrane, we demonstrated that dynamin colocalizes with the actin cytoskeleton and the actin binding protein, cortactin at the leading edge of the plasma membrane. We next wanted to assess the physiological significance of these findings by inhibiting dynamin GTPase activity using dynasore. We find that dynasore suppresses activation of ERK, but not c-Jun N-terminal kinase, after exposure to GnRH agonist. Furthermore, exposure of αT3–1 cells to dynasore inhibited GnRH-induced cyto-architectural rearrangements. Recently it has been discovered that GnRH induced Ca2+ influx via the L-type Ca2+ channels requires an intact cytoskeleton to mediate ERK phosphorylation. Interestingly, not only does dynasore attenuate GnRH-mediated actin reorganization, it also suppresses Ca2+ influx through L-type Ca2+ channels visualized in living cells using total internal reflection fluorescence microscopy. Collectively, our data suggest that GnRH-induced membrane remodeling events are mediated in part by the association of dynamin and cortactin engaging the actin cytoskeleton, which then regulates Ca2+ influx via L-type channels to facilitate ERK phosphorylation.
The oscillatory discharge of GnRH from hypothalamic neurons is obligatory for synthesis and secretion of the gonadotropins, LH and FSH (1–4). The gonadotropins are heterodimeric glycoproteins consisting of a common α-subunit and a unique hormone-specific β-subunit that once released into systemic circulation, regulate gonadal development and function by stimulating spermatogenesis, folliculogenesis, and ovulation. Given the essential role of GnRH in maintaining fertility, much effort has gone into identifying the signaling mechanisms used by the GnRH receptor (GnRHR).
After GnRH activation, the GnRHR predominantly couples to Gαq/11, resulting in activation of phospholipase C. This leads to cleaving of phosphatidylinositol-4-5-bisphosphate, to generate inositol-1,4,5-triphosphate (IP3) and diacylglycerol, and subsequent activation of protein kinase C (PKC) isozymes (1, 5). Additionally, GnRHR activation leads to increased cytoplasmic Ca2+ mobilization in both αT3-1 cells and primary pituitary gonadotropes (2, 3). IP3 facilitates Ca2+ mobilization from the endoplasmic reticulum via activation of the IP3 receptors, whereas PKC mobilizes extracellular Ca2+ influx through activation of voltage-gated L-type Ca2+ channels (VGCCs) (4). GnRH-mediated Ca2+ mobilization from both sources is essential for activation of multiple MAPK pathways in gonadotropes, including ERK, c-Jun N-terminal kinase (JNK), and p38-MAPK. Release of Ca2+ from the endoplasmic reticulum facilitates JNK activation, whereas extracellular Ca2+ influx through VGCCs facilitates ERK activation (6). The ERK signaling module has been studied extensively in gonadotropes and is linked to the transcriptional regulation of the LHβ gene through induction of the immediate early gene Egr-1 (7–9). Female mice deficient in either in Egr-1 or ERK1/2 are infertile due to deficiencies in LHβ production (10, 11). Past work from our group has also shown that disruption of the actin cytoskeleton inhibits GnRH-induced activation of ERK (12). Presently, the biochemical link by which GnRHR activation causes both actin reorganization and ERK activation remains unclear.
The actin cytoskeleton is involved in important cellular functions underlying cell movement, shape, and intracellular and transmembrane protein trafficking (13, 14). Previous work from our group and others has shown that gonadotropes rapidly (within 60 s) induce actin polymerization to form membrane ruffles, lamellipodia, and filopodia in the presence of GnRH (12, 15). Recently, it has been found that GnRH induces actin remodeling events through the activation of cortactin, which facilitates its association with actin-related protein (Arp) 2/3 complex to induce actin branching and remodeling (16). Not only does cortactin localize to areas of dynamic actin-containing structures, it also directly binds to dynamin via its C-terminal SH3-domain in these areas (17–19).
Dynamin is a large GTPase and proline-rich domain (PRD)-containing protein that possesses mechanochemical properties important in membrane remodeling events and fission (20). There are 3 different dynamin isoforms that are selectively expressed in cells. Dynamin I is specifically expressed in neuronal cells (21), dynamin II is ubiquitously expressed (22), and dynamin III is restricted to the testis (23). Regardless of the isoform, dynamin appears to be associated with remodeling of the actin cytoskeleton (24). Overexpression of the dominant negative dynamin-K44A mutant, impaired in hydrolyzing GTP, perturbs many F-actin-rich cellular structures (25–27). Consistently, αT3–1 cells transfected with dynamin-K44A resulted in a loss of not only GnRH-induced actin remodeling events (data not shown), but also GnRH-mediated ERK activation (28). Taken together, we suggest that GnRH-induced gonadotrope plasticity may be modulated through the interaction of dynamin and cortactin to effectively engage the actin cytoskeleton to facilitate ERK activation.
Our studies provide evidence that GnRHa activation of αT3-1 gonadotropes leads to redistribution of dynamin to the leading edge of gonadotropes where it colocalizes with the actin cytoskeleton and cortactin to facilitate actin assembly events. Inhibition of dynamin GTPase activity, via dynasore, results in suppression of actin reorganization and also phosphorylated ERK. Consistent with the loss of actin reorganization, dynasore also decreases Ca2+ influx through VGCCs in response to GnRH, which consequently leads to a significant reduction in ERK phosphorylation. Taken together, we demonstrate that after GnRHR activation, dynamin associates with cortactin to effectively engage the actin cytoskeleton. Reorganization of actin is critical for extracellular Ca2+ influx through L-type channels and subsequently ERK activation necessary for LHβ synthesis.
Materials and Methods
Materials
The antiphospho-ERK1/2 (p-ERK), antirabbit horseradish peroxidase (HRP), antimouse-HRP antibodies, and protein A/G agarose beads were purchased from Santa Cruz Biotechnology, Inc. The Dyngo 4a inhibitor and the anticortactin and antidynamin I/II antibodies were purchased from Abcam. The anti-ERK1/2 (ERK1/2), antiphospho-JNK 1/2 (p-JNK), and anticortactin were purchased from Cell Signaling Technology. The anti-LHβ antibody was purchased from the National Hormone and Peptide Program (National Institute of Diabetes and Digestive and Kidney Diseases). Antidynamin I/II antibody and Matrigel was purchased from BD Biosciences. All fluorescently labeled Alexa Fluor secondary antibodies were purchased from Molecular Probes-Life Technologies. The dynamin I and II primers were purchased from Integrated DNA Technologies. GnRH, Buserelin (GnRHa), dynasore, and the anti-β-tubulin were purchased from Sigma. Glass bottom microwell dishes for confocal studies were obtained through MatTek. Phorbol 12-myristate 13-acetate (PMA) was purchased from Fisher Scientific The dynamin II-green fluorescent protein (GFP) was a generous gift from Dr Gary Whittaker (Cornell University, Ithaca, NY).
Cell culture
αT3–1 or LβT2 cells (a generous gift from Dr Pamela Mellon, University California, San Diego) were maintained in high glucose DMEM containing 2mM glutamine, 100-U penicillin/mL, 100-μg streptomycin/mL, 10% fetal bovine serum by Life Technologies. All cells were grown in 5% CO2 at 37°C in a humidified environment.
Ovine pituitary culture
White-faced Colorado ewes of similar age (2–4 y) and weight were maintained under natural conditions at the Animal Reproduction and Biotechnology Laboratory Sheep Facility, Fort Collins, CO. A follicular phase ewe was killed with an overdose of sodium pentobarbital, and the pituitary gland was removed aseptically. The pituitary was rinsed free of blood and cells dispersed enzymatically using collagenase, hyaluronidase, and deoxyribonuclease at 37°C for 90 minutes as previously described (29). Dissociated cells were then suspended in culture medium (DMEM supplemented with 10% horse serum [Gemini Bio-Products, Inc], 2.5% fetal bovine serum, 1% nonessential amino acids, 100-IU/mL penicillin, and 100-μg/mL streptomycin). Cells (5 × 10⁵) in 2-mL media were plated in glass-bottom microwell dishes and cultured at 37°C in a humidified atmosphere of 5% CO2. All procedures involving animals were approved by the Colorado State University Animal Care and Use Committee and complied with National Institutes of Health guidelines (protocol number 13-4349A).
RNA extraction, reverse transcription, PCR, and quantitative RT-PCR
Total RNA was extracted from αT3–1 cells using E.Z.N.A. Total RNA kit (Omega) according to the manufacturer's instructions. To obtain single-stranded cDNA, 1.0 μg of total RNA were reverse transcribed using iScript Reverse Transcription Supermix (Bio-Rad). cDNA was subject to PCR and quantitative polymerase chain reaction analysis with primers specific for the isoform of dynamin I (forward 5′-CTCACGTCCACCATCAGAAA-3′ and reverse 5′-GGATGTGGTGGTCACAAT-3′) and dynamin II (forward 5′-CCCCTGGTATCCTCCAG-3′ and reverse 5′-CTCCCACGAAGCTCAGAAGA-3′). cDNA (0.5 μg), ribonuclease-free H2O, along with iTaq SYBR green Supermix (10 μL) (Bio-Rad) were added to each well on a 48-well PCR plate and then placed in real-time thermocycler. The samples were denatured at 94°C for 3 minutes followed by denaturation at 94°C for 30 seconds, annealing at 53.3°C for 40 seconds, and extension at 72°C for 1 minute. Quantitative PCR data were analyzed by the δ/δCt method, in which all dynamin threshold cycle (Ct) values were adjusted to corresponding glyceraldehyde-3-phosphate dehydrogenase levels.
Live cell confocal microscopy
Live cell confocal microscopy was conducted using either a Zeiss LSM510 or LSM710 confocal laser-scanning microscope (CLSM) under a ×63 oil objective with appropriate fluorescent filters. αT3–1 cells (5 × 10⁵) were transiently transfected with dynamin-GFP using SuperFect reagent (QIAGEN) for 24 hours were grown on glass bottom microwell dishes coated with Matrigel (1:100 dilution). Cells were serum starved for 2–4 hours before treatment. Selected fluorescent cells were imaged before the administration of GnRHa. After the addition of 10nM GnRHa, the selected cell was imaged using a time series function that captured images every 30 seconds for 20 minutes.
Immunocytochemistry
αT3–1 cells were grown in a 35-mm dish with a glass bottom coverslip coated with Matrigel (1:100) and serum starved for 2–4 hours. Cells were then treated with either vehicle (0) or GnRHa 10nM. After treatment, cells were washed twice with 0.01M PBS and then fixed by submersion in 4% paraformaldehyde (PFA) in PBS for 30 minutes at room temperature. The cells were then rinsed twice with PBS and permeabilized for 20 minutes in 0.5% Triton X-100/PBS. After permeabilization, cells were rinsed twice with PBS and blocked in 3% BSA/PBS for 1 hour at room temperature. Cells were incubated with an anticortactin antibody followed by Alexa Fluor 488-conjugated secondary antibody. Cells were washed and reblocked before the administration of antidynamin antibody. Dynamin was visualized using an Alexa Fluor 594-conjugated secondary antibody and imaged using CLSM. For visualization of dynamin and actin, cells were treated and stained for dynamin as described above. Actin was stained using Alexa Fluor 594 phalloidin diluted in 200-μL 1% BSA/PBS and applied to the cells for 20 minutes at room temperature.
Ovine pituitary cells were serum starved for 2 hours and then administered vehicle or dynasore (80μM) for 30 minutes. After pretreatment, either vehicle or 10nM GnRHa was administered or 10 minutes. Cells were washed with cold PBS and fixed in 4% PFA for 30 minutes, permeabilized with 0.5% Triton X-100 in PBS for 20 minutes, and blocked in PBS containing 3% BSA for 1 hour. Cells were then exposed to an anti-LHβ antibody (1:250) in PBS containing 3% BSA for 2 hours. For visualization, cells were incubated with Alexa Fluor 594 antiguinea pig IgG secondary antibodies (1:500) for 1 hour. After immunostaining, pituitary cells were incubated with Alexa Fluor 488-conjugated phalloidin followed by 4′,6-diamidino-2-phenylindole (DAPI) and imaged by CLSM.
Phalloidin staining
αT3–1 cells were plated in glass-bottom microwell dishes coated with Matrigel (1:100). Selected cells were pretreated with dynasore for 30 minutes and then treated in the presence or absence of either vehicle (0) or GnRHa (10nM) for 10 minutes. Cells were fixed in 4% PFA for 20 minutes and then permeabilized with 0.3% Triton X-100/PBS for 10 minutes. Cells were then blocked in 3% BSA/PBS for 20 minutes. For visualization of actin, 5 μL of Alexa Fluor 488-phalloidin was diluted in 200-μL 1% BSA/PBS and applied to the cells for 20 minutes at room temperature followed by DAPI staining. Cells were imaged by CLSM.
Western blottings
αT3–1 or LβT2 cells (2 × 10⁶) were grown overnight in a 6-well culture dish and then serum starved for 2–4 hours. Cells were pretreated with either vehicle (0), dynasore (80μM), or dyngo (30μM) for 30 minutes. For dose-response studies, indicated doses of dynasore were used for a 30-minute pretreatment. After pretreatment, cells were treated with 0 or GnRHa (10nM) for 10 minutes. Cells were then washed twice in PBS, lysed in radio-immunoprecipitation assay (RIPA) buffer and subjected to SDS-PAGE (acrylamide:bis-acrylamide ratio of 29:1) and electroblotted to polyvinylidene difluoride membranes. Membranes were blocked in Tris-buffered saline with Tween 20 (TBST)/2% casein. Membranes were then incubated for 1 hour with either an anti-p-ERK antibody (1:1000) or overnight with an anti-p-JNK antibody (1:2000). Blots were washed (3 × 10 min) with TBST and then incubated with a 1:10 000 dilution of an appropriate HRP-conjugated secondary antibody for 1 hour at room temperature. All membranes were washed for 30 minutes (3 × 10 min) with TBST after secondary antibody and then visualized by chemiluminescence using Pierce SuperSignal reagents, Bio-Rad ChemiDoc XRS+ and Image Lab Software. After developing, blots were then stripped at room temperature with 100mM 2-mercaptoethanol, 2% sodium dodecyl sulfate (SDS), and 62.5mM Tris-HCl (pH 6.7) heated to 50°C for 20 minutes. After stripping, membranes were washed twice for 15 minutes with TBS and blocked with 2× casein for 1 hour. Blots were then reprobed with a 1:1000 dilution of either an anti-β-tubulin antibody (1:5000), an anti-ERK1/2 (1:5000) antibody. After washing in TBST, blots were incubated with a 1:5000 dilution of the appropriate HRP secondary antibody and then imaged as described above.
Immunoprecipitations
The αT3–1 cells (2 × 10⁷) were grown in 100-mm tissue culture dishes overnight. The next day, cells were serum starved for 2–4 hours and treated in the absence or presence of 10nM GnRHa for 15 minutes and lysed in RIPA buffer. Lysates were precleared and then incubated with anticortactin antibody (mouse) or nonimmune mouse serum for 2 hours at 4°C. Protein A/G agarose beads (30 μL) were added, and the samples were rocked overnight at 4°C. Beads were then washed 3 times in PBS, resuspended in 40 μL of 1× SDS loading buffer, and boiled for 5 minutes. Immunoblots were performed using an antidynamin antibody. For loading controls, the membrane was stripped and probed using an anticortactin antibody.
Electrophysiology and total internal reflection fluorescence microscopy
αT3–1 cells were plated onto Matrigel-coated glass-bottomed dishes (1:100) 24 hours before experimentation and Ca2+ was imaged at previously described (30). Simultaneous electrophysiology and Ca2+ imaging experiments were carried out using the conventional dialyzed whole-cell patch clamp technique as described previously (31–34). Briefly, Ca2+ influx through L-type Ca2+ channels was visualized with a TILL Photonics through-the-lens total internal reflection fluorescence (TIRF) system built around an inverted Olympus IX-71 microscope with a 100X TIRF oil-immersion objective (numerical aperture 1.45) and an Andor iXON EMCCD camera (Andor Technology). To monitor Ca2+ influx, gonadotropes were loaded with the Ca2+ indicator fluo-5F (200μM) and an excess of EGTA (10mM) to lower background noise while minimally interfering with fluo-5F via the patch pipette. The membrane potential was controlled with an Axopatch 200B amplifier (Molecular Devices); fluo-5F excitation was achieved with a 491-nm laser with excitation and emission light being separated with appropriate filters. Ca2+ influx was recorded with 2mM external Ca2+ at a frame rate of 50 Hz and holding potential of −70 mV to increase the driving force for Ca2+ entry. To preclude potential contaminating Ca2+ release events from the endoplasmic reticulum, the Ca2+-ATPase inhibitor thapsigargin (1μM) was present during all experiments. αT3–1 cells were pretreated with vehicle or dynasore (80μM) for 10 minutes before acute exposure to GnRH (3nM). Cells were imaged during the pretreatment and for an additional 10 minutes after GnRH treatment. All experiments were performed at room temperature (22°C–25°C).
L-type Ca2+ channel sparklet analysis
Background-subtracted fluo-5F fluorescence signals were converted to intracellular Ca2+ concentrations ([Ca2+]i), as described previously (31, 32, 34, 35). Briefly, fluo-5F fluorescence images were analyzed with custom software kindly supplied by L. Fernando Santana (University of Washington, Seattle, WA), and L-type Ca2+ channel sparklet activity was determined by calculating the number of quantal levels detected and probability that the site is active (nPs) of each site, where n is the number of quantal levels detected, and Ps is the probability that the site is active. nPs values were obtained using pCLAMP version 10.0 (Molecular Devices) on imported [Ca2+]i time-course records using an initial unitary [Ca2+]i elevation of approximately 20nM as determined empirically. Active L-type Ca2+ channel sparklet site densities (Ca2+ sparklet sites per μm2) were calculated by dividing the number of active sites by the area of cell membrane visible in the TIRF images. Image stacks selected for analysis were obtained between 5 and 10 minutes of pharmacological manipulation.
Normally distributed data are presented as mea ± SEM. Two-sample comparisons of these data were performed using either a paired or unpaired (as appropriate) 2-tailed Student's t test, and comparisons between more than 2 groups were performed using a one-way ANOVA with Tukey's multiple comparison post hoc test. L-type Ca2+ channel sparklet activity (ie, nPs) datasets were bimodally distributed; thus, 2-sample comparisons of nPs data were examined with the nonparametric Wilcoxon matched pairs test (2 tailed), and comparisons between more than 2 groups were performed using the nonparametric Friedman test with Dunn's multiple comparison post hoc test. Arithmetic means of nPs datasets are indicated in the figures (solid gray horizontal lines) for nonstatistical visual purposes, and dashed gray lines mark the threshold for high-activity Ca2+ sparklet sites (nPs ≥ 0.2). Values of P < .05 were considered significant and asterisks used in the figures indicate a significant difference between groups.
Measurement of intracellular calcium
αT3–1 cells were plated the day before at 3 × 10⁵ in 35-mm glass-bottomed dishes. Cells were loaded at room temperature with fura 2 (5μM) and 0.1% Pluronic F-127 for 30 minutes in fluorescence buffer (FB) (145mM NaCl, 5mM KCl, 1mM Na2HPO4, 0.5mM MgCl2, 1mM CaCl2, 10mM HEPES, and 5mM glucose; pH 7.4). After loading, cells were washed twice in the same buffer and incubated for 30 minutes in FB to allow for ester hydrolysis. Treatment solutions (1-μL Dimethyl sulfoxide (DMSO), as a vehicle control, 80μM dynasore, 0.5μM nicardipine, or both dynasore and nicardipine) were added directly into coverslip dishes before imaging. Cells were mounted on the stage of the inverted fluorescent microscope (Nikon TSM) attached to dual-wavelength Fluorescence Imaging System InCyt2 (Intracellular Imaging) and imaged for 5 minutes before and after the application of 3nM GnRH. Changes in [Ca2+]i in individual cells were measured as the ratio of fluorescence at 340/380-nm excitation and 510-nm emission, using an InCyt2 imaging system. The individual responses of 14–18 cells in one dish (14–20 dishes per treatment) were aligned and averaged using the numerical analyses software (CalciumComp) developed by an engineer consultant (K. J. Bois, Fort Collins, CO). Only cells that responded to treatment were used for data analysis. Responses are reported as integrated [Ca2+]i increase over baseline for 2 minutes.
Statistical analysis
tAll statistical analysis was performed using GraphPad prism software. Data are expressed as mean ± SEM of at least 3 independent experiments. Results were analyzed for significance using an unpaired Student's t test or one-way ANOVA. Post hoc group comparisons were made using Tukey's honestly significant difference using the critical value P ≤ .05 for declaring significance.
Results
Dynamin II is predominately expressed in gonadotropes and colocalizes with the actin cytoskeleton after GnRH stimulation
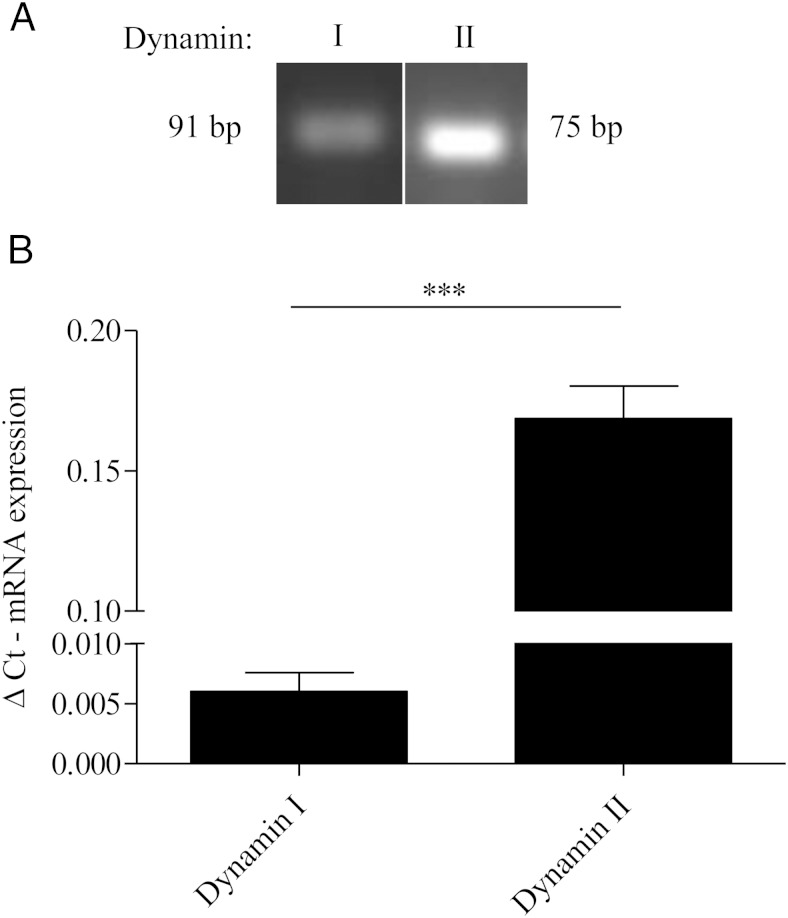
To begin addressing the mechanistic link between dynamin, the actin cytoskeleton and MAPK activity, we first assessed the expression of different dynamin isoforms in our gonadotrope derived αT3–1 cell model. In this study, we used PCR and quantitative RT-PCR to examine the relative expression profiles of both dynamin I and II in αT3–1 cells. Dynamin III, expressed predominately in the testis and brain, was not found in our samples (data not shown). We found αT3–1 cells express approximately 35 times more dynamin II mRNA than dynamin I (Figure 1).
Figure 1.
Dynamin II is predominately expressed in αT3–1 gonadotropes. A, Total RNA was extracted from αT3–1 cells using E.Z.N.A. RNA kit, and dynamin I and II mRNA expression levels were visualized using PCR. B, αT3–1 cells were treated as described in A except dynamin I and II mRNA expression levels were quantified using quantitative RT-PCR. Dynamin I and II mRNA levels were normalized to glyceraldehyde-3-phosphate dehydrogenase and are represented as δCt mRNA expression: ***, P < .001.
Dynamin possesses mechanochemical properties important in membrane remodeling events and fission (20). We have previously found that gonadotrope cell lines and ex vivo gonadotropes display a high degree of plasticity after GnRH treatment due to actin reorganization events (12, 16, 36). To investigate the role that dynamin may play in the initiation of actin remodeling events, we used live cell imaging to visualize dynamin-GFP redistribution after GnRHR activation. αT3–1 cells were transiently transfected with cDNA encoding a dynamin II-GFP fusion protein. Cells were imaged by CLSM before GnRHa treatment (10nM) and at 30 seconds intervals for 10 minutes after GnRHa activation. Upon GnRHa treatment, a portion of dynamin-GFP is redistributed from the cytosol to the plasma membrane in regions indicative of actin remodeling (Figure 2A). We next wanted to confirm that dynamin reorganization was associated with the actin cytoskeleton. After 10 minutes of GnRHa treatment, endogenous dynamin I/II was colocalized with the actin cytoskeleton and a portion is redistributed to the leading edge of αT3–1 (Figure 2B). These results suggest GnRHR activation leads to association of actin and dynamin in areas of cyto-architectural rearrangement.
Figure 2.
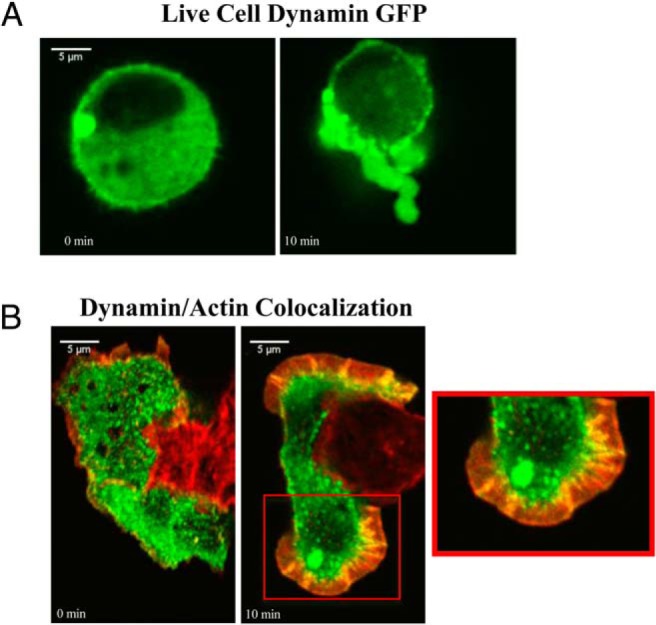
GnRHR stimulation causes dynamin redistribution and colocalization with actin. A, αT3–1 cells grown on glass-bottom microwell dishes were transfected with dynamin-GFP for 24 hours. Cells were treated with 10nM GnRHa and imaged by CLSM every 30 seconds for 20 minutes. Selected panels represent dynamin-GFP expression in the same live cell before GnRHa (0) and 10 minutes after GnRHa treatment. B, αT3–1 cells were grown on glass-bottom microwell dishes and incubated in the presence or absence of 10nM GnRHa for 10 minutes. Cells were fixed in 4% PFA and immunostained for dynamin and visualized using an Alexa Fluor 488 (green) secondary antibody. Cells were then stained with Alexa Fluor 594-conjugated phalloidin (red) and imaged by CLSM. The red box highlights the colocalization of dynamin and actin at a higher resolution.
Cortactin associates with dynamin after GnRH treatment
We have previously highlighted the importance of cortactin in actin remodeling events in gonadotrope cells (16). Taken together with Figure 2, dynamin may potentially associate with cortactin to induce actin reorganization in gonadotropes. In support of this idea, cortactin has been shown to not only enhance the GTPase activity of dynamin, but also bind to dynamin via the interaction of the PRD on dynamin and the cortactin SH3 domain (37). Taken together, we wanted to determine whether GnRHa stimulation facilitates the association of dynamin and cortactin. αT3–1 cells were treated with either vehicle (0) or GnRHa for 15 minutes and lysed in a RIPA buffer. Lysates were immunoprecipitated using an anticortactin antibody, resolved by SDS-PAGE, and membranes were immunoblotted with an antidynamin I/II antibody. After 15 minutes of GnRHa treatment, there is an increased association between cortactin and dynamin (Figure 3A). Using immunocytochemistry, we were able to visualize the spatial localization of cellular sites of cortactin and dynamin interaction. As expected, we find that after GnRHa treatment, cortactin and a portion of dynamin are redistributed and become colocalized at the leading edge of αT3–1 gonadotrope cells (Figure 3B).
Figure 3.
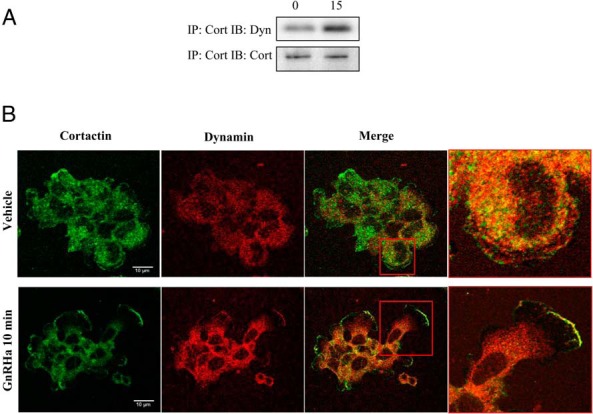
Cortactin associates with dynamin f after GnRHa treatment. A, αT3–1 cells were grown in 100-mm dishes and treated with either vehicle (0) or 10nM GnRHa for 15 minutes and lysed in RIPA buffer. Lysates were precleared and then immunoprecipitated (IP) with anticortactin antibody using protein A/G agarose beads overnight at 4°C. Immunoblotting (IB) was performed using an antidynamin. Anticortactin antibody was used to assess IP inputs. B, αT3–1 cells were grown on glass-bottom microwell dishes and incubated in the presence or absence of 10nM GnRHa for 10 minutes and then fixed in 4% PFA. Cells were incubated with an anticortactin antibody followed by Alexa Fluor 488-conjugated secondary antibody. Cells were washed and reblocked before the administration of antidynamin antibody. Dynamin was visualized using an Alexa Fluor 594-conjugated secondary antibody and imaged using CLSM. The red box highlights the colocalization of dynamin and cortactin at a higher resolution.
Inhibition of dynamin GTPase activity suppresses GnRH-mediated activation of ERK but not JNK
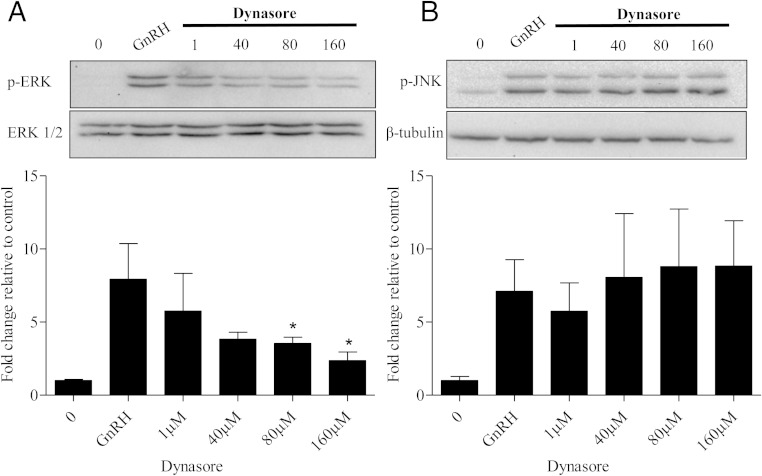
Based on our data in the previous section, dynamin is likely to play a role in GnRH-mediated engagement of the cytoskeleton. Interestingly, our previous work also highlights that an intact cytoskeleton is necessary for ERK. At present, it is not clear at what level these cellular events might be linked. To begin exploring these issues, we used dynasore, a cell-permeable pharmacological inhibitor that interferes with GTPase activity of both dynamin I and II (38). αT3–1 cells were pretreated with either vehicle (0) or increasing doses of dynasore for 30 minutes. ERK phosphorylation was detected 10 minutes after GnRHa treatment. After dynasore treatment, GnRH-mediated ERK phosphorylation remained unchanged at 1μM and 40μM concentrations. However, dynasore treatment was capable of significantly decreasing ERK phosphorylation in a dose-dependent manner (80μM and 160μM) (Figure 4A). The 80μM dose of dynasore is consistent with other previously published work in neuronal cell lines and Chinese hamster ovary cells (39). To confirm the role of dynamin in specifically regulating ERK phosphorylation after GnRH exposure, we also investigated JNK activation. We detected JNK phosphorylation after 10 minutes of GnRHa treatment, which persisted despite exposure to increasing doses of dynasore (Figure 4B). Thus, dynamin appears to be an upstream mediator involved in ERK activation but not that of JNK.
Figure 4.
Inhibition of dynamin decreases p-ERK in a dose-dependent manner. A, αT3–1 cells were pretreated (30 min) with vehicle (0) or the dynamin inhibitor dynasore (1μM, 40μM, 80μM, and 160μM) followed by a 10-minute treatment of either 0 or GnRHa (10nM). Cells were lysed in RIPA buffer and Western blotted using an anti-p-ERK1/2 antibody. After probing with p-ERK, membranes were stripped and reprobed with an antibody that detects ERK1/2 to assess protein lane loading. All groups were normalized to ERK1/2 and are represented as fold change relative to 0. B, αT3–1 cells were treated as described in A. Cells were lysed in RIPA buffer and Western blotted using an anti-p-JNK antibody. Membranes were stripped and reprobed with β-tubulin to assess protein lane loading. All groups were normalized to β-tubulin and are represented as fold change relative to 0. All groups compared with GnRH: *, P < .05.
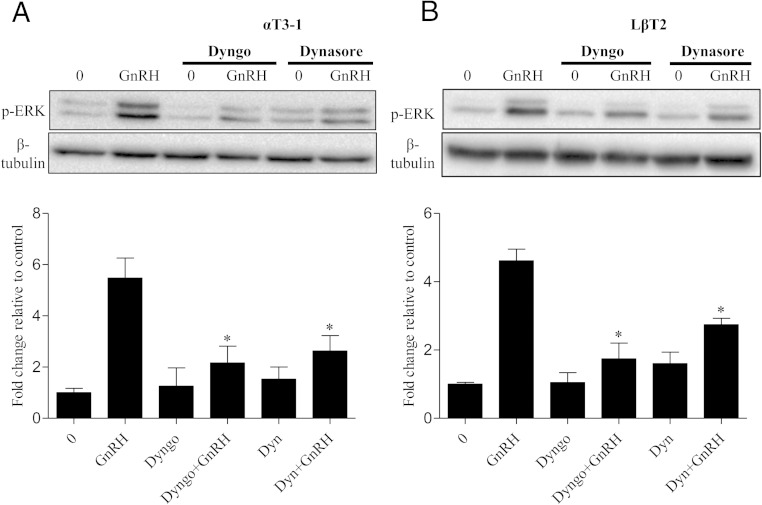
To confirm our results were not an artifact of either cell line or dynamin inhibitor choice, we validated our findings in the gonadotrope derived LβT2 cell line. We also analyzed the effect of an additional inhibitor to dynamin GTPase activity, Dyngo 4a (dyngo). αT3–1 or LβT2 cells were pretreated as described above with either dynasore (80μM) or dyngo (30μM). Cells were then treated with 10nM GnRHa for 10 minutes. Dose-response studies revealed that 30μM of dyngo was an effective concentration for blocking dynamin GTPase activity in both cell lines (data not shown). We find that regardless of cell line or dynamin inhibitor, the loss of dynamin GTPase activity leads to a reduction in GnRH induced ERK phosphorylation in gonadotrope cells (Figure 5, A and B). These results are also consistent with previous studies using dominant negative dynamin (K44A) which also reduces GnRH-mediated ERK activation in gonadotropes (28).
Figure 5.
Inhibition of dynamin GTPase activity decreases p-ERK activity in multiple gonadotrope cell lines. A, αT3–1 cells were pretreated (30 min) with vehicle (0), dynasore (80μM), or dyngo (30μM) for 30 minutes followed by a 10-minute treatment of either 0 or GnRHa (10nM). Cells were lysed in RIPA buffer and Western blotted using an anti-p-ERK1/2 antibody. After probing with p-ERK, membranes were stripped and reprobed with an antibody that detects β-tubulin to assess protein lane loading. All groups were normalized to β-tubulin and are represented as fold change relative to 0. B, LβT2 cells were treated as described in A. All groups compared with GnRH: *, P < .05. Data are expressed as mean ± SEM of 3 independent experiments.
Inhibiting dynamin GTPase activity blunts actin reorganization in response to GnRH
If our hypothesis is correct that dynamin is involved in actin cytoskeletal reorganization after GnRH, presumably dynasore treatment would inhibit these cytoarchitectural changes. To explore this possibility, we assessed whether inhibition of dynamin would attenuate GnRHa-induced actin remodeling in both αT3–1 and primary ovine pituitary cells. αT3–1 and ovine pituicytes cells were pretreated with either vehicle or dynasore (80μM) for 30 minutes and then treated with either 0 or GnRHa (10nM) for 10 minutes. Cells were fixed and stained for Alexa Fluor 488 phalloidin and imaged with CLSM. Our results confirm our previous studies that actin remodeling occurs after GnRHa stimulation; however, pretreatment with dynasore abrogates GnRH-induced actin reorganization events in both αT3–1 cells (Figure 6A) and primary pituitary cells (Figure 6B). Thus, dynamin is not only found associated with actin binding proteins but is involved in regulating actin dynamics in gonadotropes.
Figure 6.
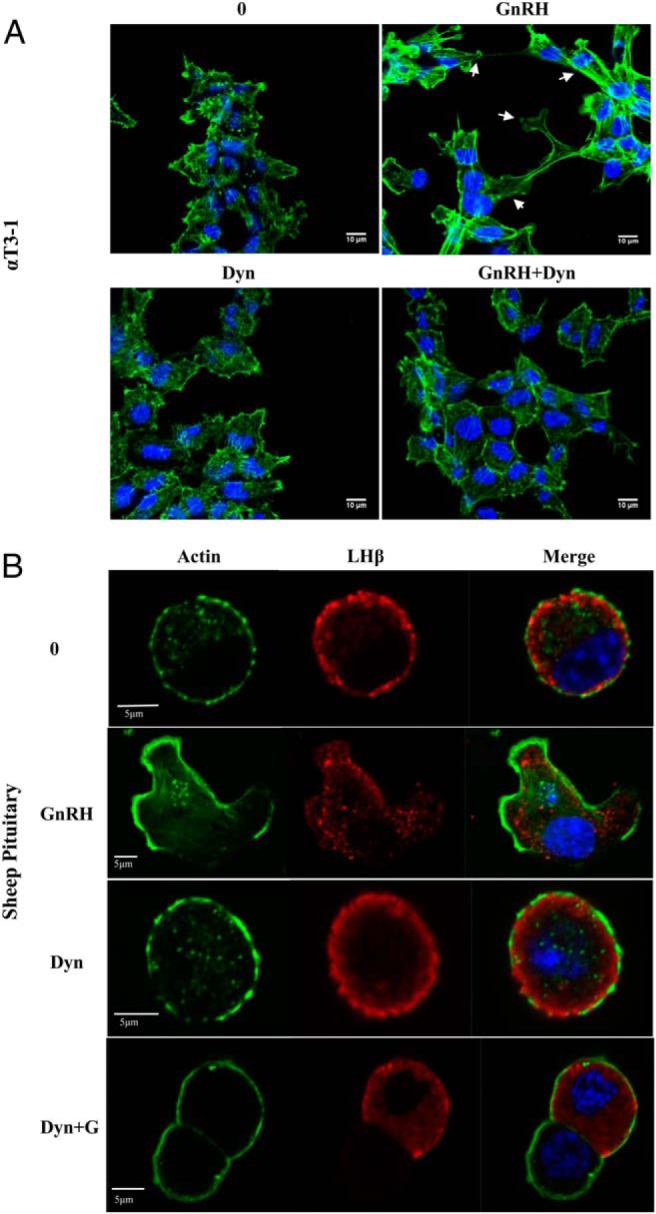
Dynamin inhibition blunts GnRHa-induced actin remodeling in αT3–1. A, αT3–1 were grown on glass-bottom microwell dishes for 24 hours. Cells were incubated in the presence and/or absence of 80μM dynasore for 30 minutes and/or 10nM GnRHa for 10 minutes followed by fixation in 4% PFA. Cells were then stained with Alexa Fluor 488-conjugated phalloidin (green) and DAPI and imaged by CLSM. The white arrows are highlighting GnRH-induced actin reorganization. B, Dissociated sheep ovine pituitary cells were plated and treated as described in A. After fixation, pituitary cells were immunostained for LHβ followed by the appropriate Alexa Fluor 594-conjugated secondary antibody. Cells were then stained with Alexa Fluor 488-conjugated phalloidin and DAPI and imaged by CLSM.
Dynasore decreases Ca2+ influx through L-type Ca2+ channels after GnRH treatment
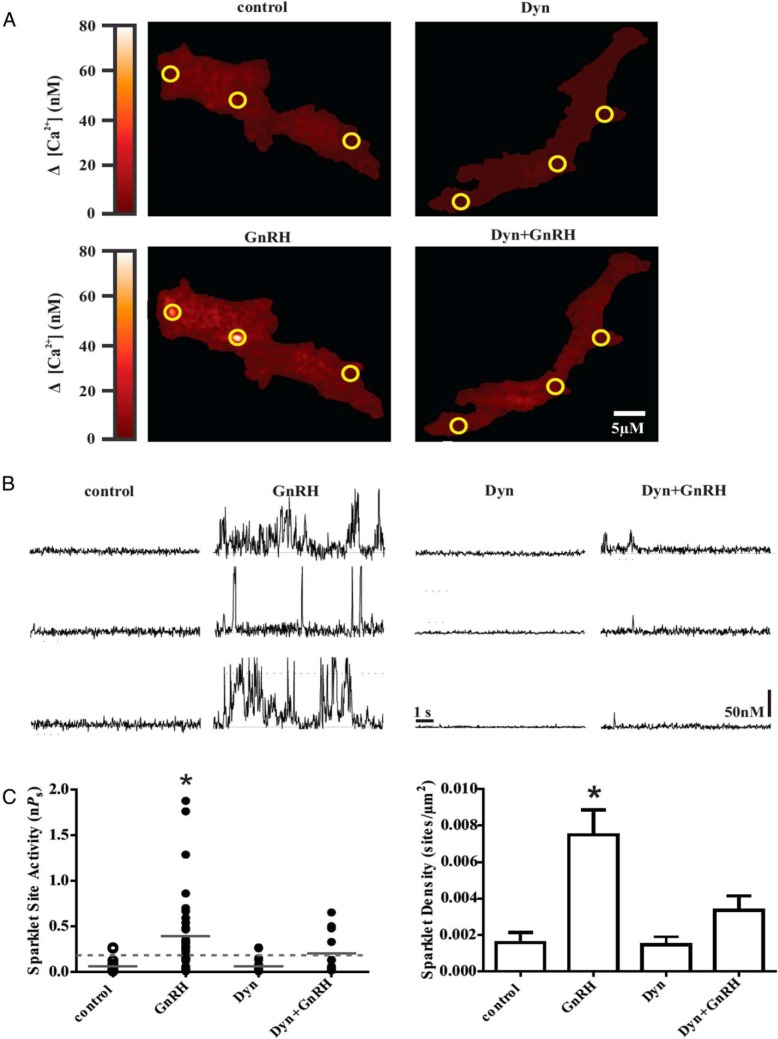
It is well known that VGCC activity is necessary for ERK activation. Recent data have highlighted that (VGCC) activity is also dependent on an intact actin cytoskeleton (30). Because inhibition of dynamin blunted actin reorganization and ERK activation, we were intrigued with possibility that dynamin may have an effect on VGCC signaling. To gain a better understanding of the mechanistic actions of dynamin on VGCC activity we assessed channel activity after dynamin inhibition using dynasore. We used electrophysiology combined with TIRF microscopy to visualize subplasmalemmal, localized Ca2+ influx through VGCCs (Ca2+ sparklet activity) in αT3–1 gonadotropes (Figure 7, A and B). Acute exposure of αT3–1 cells to GnRH (3nM) increased both Ca2+ sparklet activity (nPs) and sparklet site densities (number of Ca2+ sparklet sites per μm2) (P < .05, n = 19 cells; Figure 7C). However, pretreatment with dynasore (80μM for 10 min) attenuated both sparklet activity and site densities after the administration of GnRH (3nM) and was not significantly different compared with control or dynasore alone (P > .05, n = 14 cells) (Figure 7C). These results suggest dynamin plays a key role in regulating Ca2+ influx through VGCC by engaging the actin cytoskeleton.
Figure 7.
Inhibition of dynamin decreases GnRH-dependent Ca2+ influx via L-type Ca2+ channels in αT3–1 cells. A, Representative TIRF images showing localized Ca2+ influx in αT3–1 cells treated with GnRH (3nM) with or without dynasore pretreatment (80μM for 10 min). B, Representative fluorescence traces showing time courses of Ca2+ influx in αT3–1 cells exposed to GnRH in the presence or absence of dynasore. The scale bar provides reference for changes in [Ca2+]i during the traces (see Materials and Methods). C, Plot of Ca2+ sparklet site activities (nPs) and mean ± SEM Ca2+ sparklet site densities (Ca2+ sparklet sites/μm2) for GnRH treatment (n = 14 cells) with or without dynasore (n = 19 cells). Solid gray lines are the arithmetic means of each group and dashed lines mark the threshold for high-activity Ca2+ sparklet sites (nPs ≥ 0.2). *, P < .05.
Nicardipine and dynasore are equivalent in attenuating the GnRH-induced whole-cell calcium signal
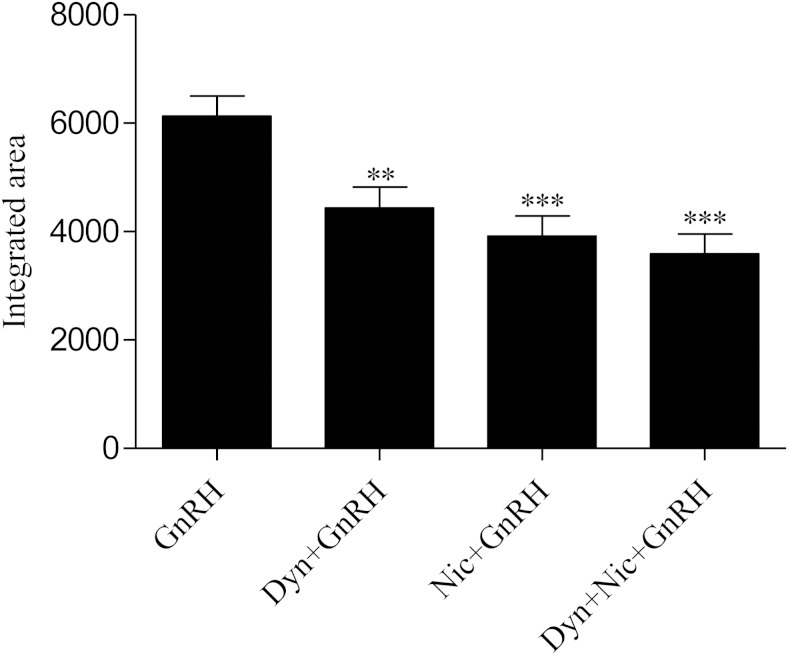
GnRH induces a transient increase in intracellular Ca2+ by opening VGCCs and releasing intracellular Ca2+ from IP3-mediated internal stores. If the effect of dynasore on Ca2+ dynamics is confined strictly to the VGCC, then one would predict that its impact on the whole cell Ca2+ signal as measured by fura 2 would be equivalent to the VGCC antagonist nicardipine. Consistent with earlier studies (30, 40, 41), the attenuated Ca2+ signal in the presence of nicardipine reflects the loss of Ca2+ entry via VGCCs and the retention of the IP3-mediated release of intracellular Ca2+ stores. Dynasore led to an equivalent reduction in the whole cell Ca2+ signal and the combination of nicardipine and dynasore was not additive, suggesting a common site of action. Thus, like nicardipine, the effects of dynasore on GnRH-induced Ca2+ dynamics appear to be specific to the VGCC with little or no impact on IP3-mediated Ca2+ release. Importantly, these data are entirely consistent with the effect of dynasore to attenuate ERK but not JNK activation in response to GnRH (see Figure 4), because the former is dependent on Ca2+ entry via VGCC and the latter dependent on IP3 mobilization of intracellular Ca2+ (Figure 8) (6).
Figure 8.
Dynamin specifically regulates Ca2+ influx through L-type Ca2+ channels in αT3–1 cells. αT3–1 cells were loaded with fura 2-AM (5μM) in FB at room temp for 30 minutes. After being loaded with fura 2-AM, treatments (dynasore [80μM], nicardipine [0.5μM], both dynasore and nicardipine or vehicle control) were added to the dish, and cell were imaged for 5 minutes to establish baseline measurement of [Ca2+]i, followed by administration of 3nM GnRH in FB (primary dose) at time 0. Changes in [Ca2+]i in individual cells was measured as a ratio of fluorescence at 340 excitation and 380-nm emission on an inverted fluorescent microscope. Mean changes in [Ca2+]i, calculated as area under the curve (AUC) (integrated area). All groups compared with GnRH: **, P < .01 and ***, P < .001.
Dynamin facilitates GnRH-mediated ERK activation upstream of PKC
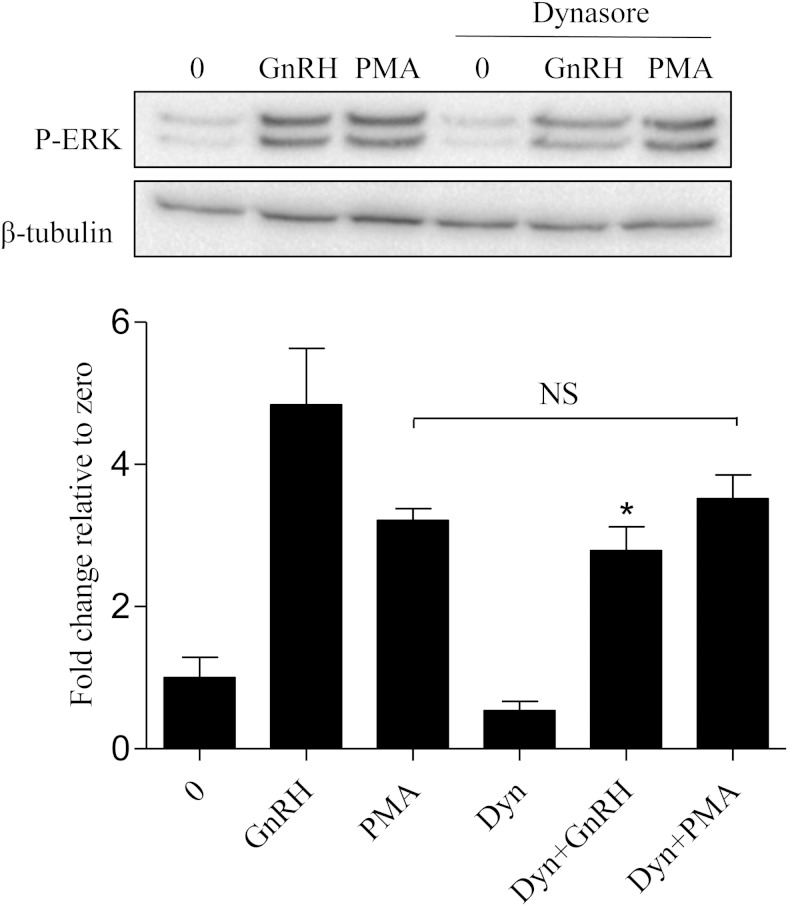
To gain a better mechanistic understanding of dynamin, we next examined where in the signaling cascade dynasore is working to suppress ERK phosphorylation after GnRHR activation. To investigate this, αT3–1 cells were pretreated with 0 or dynasore for 30 minutes and then treated with either 0, GnRHa, or PKC activator PMA for 10 minutes. As expected, ERK phosphorylation was detected 10 minutes after GnRH and PMA treatment. After dynasore treatment, PMA-mediated ERK phosphorylation remained unchanged (Figure 9). However, dynasore treatment significantly decreased GnRH-mediated ERK phosphorylation. These results suggest that dynamin is working upstream of PKC to mediate ERK activation after GnRHR activation.
Figure 9.
Dynamin facilitates GnRH-mediated ERK activation upstream of PKC. αT3–1 cells were pretreated with vehicle (0) or dynasore (80μM) for 30 minutes and then treated in the presence or absence of either GnRHa (10nM) or PMA (10nM) for 10 minutes. Cells were lysed in RIPA buffer and Western blotted using an anti-p-ERK antibody. After probing with an anti-p-ERK, membranes were stripped and reprobed with an antibody that detects β-tubulin to assess protein lane loading. All groups were normalized to β-tubulin and are represented as fold change relative to 0. All groups compared with GnRH: *, P < .05.
Discussion
In the current study, we have identified dynamin as a key signaling intermediate linking GnRHR activation to actin remodeling, VGCC activity and ERK activation. We found that upon GnRHR activation, dynamin associates with cortactin to engage the actin remodeling events. However, pharmacological inhibition of dynamin GTPase activity attenuates GnRH-induced actin polymerization. Consistent with the loss of actin reorganization, dynasore also decreased Ca2+ influx through VGCCs and consequently reduced ERK phosphorylation. Thus, dynamin mechano-GTPase activity appears to be important in coupling GnRHR signaling to the actin cytoskeleton and VGCC activity to facilitate ERK activation.
Although dynamin plays a central role in fission of budding endocytic vesicles, it is clear that the PRD of this protein serves as a scaffold for actin interacting proteins. Consistent with this, we demonstrate that GnRHR activation leads to redistribution of dynamin and subsequent association with cortactin at the leading edge of αT3–1 cells. Previous work from our group has highlighted the necessity of cortactin in facilitating GnRH-mediated engagement of the actin cytoskeleton in gonadotropes (16). Beyond gonadotropes, other studies have also shown the importance of dynamin and cortactin association in membrane ruffles (18), podosomes (17), and actin comets (19). Interestingly, data show that after association, cortactin appears to stimulate GTPase activity of dynamin, and their association can form a dynamic actin filament remodeling complex (37). Furthermore, there is evidence linking the GTPase activity of dynamin to the formation of F-actin-rich cellular structures (17, 42). In support of this, we show that inhibition of dynamin GTPase activity, using dynasore, blunts GnRH-induced actin remodeling. These data are consistent with overexpression of dominant negative dynamin-K44A that attenuates formation of dendritic spines of neurons (25), dynamic cortical ruffles (26, 27), focal adhesions (43), and podosomes. Although cortactin is a likely candidate for stimulating GTPase activity of dynamin, necessary for actin reorganization, we cannot rule out a direct functional interaction of dynamin and actin as it has been recently discovered that dynamin contains an actin binding domain (44).
It is of interest that dynasore and Dyngo 4a suppressed lamellipodia and membrane ruffles in mouse fibroblasts despite the absence of all 3 dynamin isoforms, suggesting potential nonspecific actions of the dynamin inhibitors (45). However, these fibroblasts presented lamellipodia and membrane ruffles despite no ligand stimulation in both wild type and knockout (KO) cells. This is in sharp contrast to αT3–1 cells that only exhibit actin reorganization events after GnRH stimulation. Additionally, independent of pharmacological inhibition, dominant negative K44A dynamin has been shown to reduce ERK activation (28) and membrane remodeling events in both αT3–1 and primary sheep pituitary cells (data not shown) highlighting a specific role for dynamin in gonadotropes. Thus, it seems possible that, dynamin has a different mechanism of action in endocrine cells compared with embryonic fibroblasts.
Previous in vivo studies of dynamin I KO mice were met with limitations as synaptic transmission defects resulted in an average lifespan of less than 2 weeks (46). Although the KO of dynamin II in mice resulted in early embryonic lethality (47), development of dynamin II KO mouse fibroblasts was achieved in vitro; however, the defects in clathrin-mediated endocytosis was partially compensated by expression of the dynamin I isoform (47, 48). The generation of dynamin I and II double KO mouse fibroblasts presented robust defects in clathrin-mediated endocytosis as expected, but these fibroblasts also failed to proliferate. This highlights the key role of dynamin in fission and actin modulation, because the double KO cells displayed defective invaginations of clathrin-coated pits that were also surrounded by F-actin and actin regulatory proteins.
At issue is the physiological importance of dynamin in gonadotrope cells. Previous work suggests that gonadotropes are near blood vessels and plasma membrane protrusions extend in the direction of pituitary vasculature during LH secretory events (36, 49). Additionally, we have recently shown that after GnRH stimulation, ovine pituitary cells concentrate LHβ into areas of high actin reorganization (16). Thus, dynamin GTPase activity may be key in linking GnRHR activation to gonadotrope plasticity to sustain high systemic levels of LH during the preovulatory period necessary for ovulation. Taken together, we suggest that interactions of dynamin and cortactin along with the mechano-GTPase activity of dynamin are necessary for GnRH-induced actin reorganization.
In addition to inducing actin polymerization, GnRH also maintains LHβ synthesis through activation of ERK (50–52). Using jasplakinolide (Jas), a pharmacological disruptor of the actin cytoskeleton, we have previously found that GnRH-induced actin engagement is required for ERK activation (12), whereas activation of JNK was not affected (Supplemental Figure 1). The importance of GnRH facilitating both actin assembly and ERK activation was also evident in HEK293 cells (53). Interestingly, this preferential suppression of ERK but not JNK activation is seen in a similar manner after the inhibition of dynamin GTPase activity, with similar blunted GnRH-mediated actin reorganization phenotypes. Taken together, there appears to be an interdependence between actin reorganization and ERK activation that is regulated by dynamin GTPase activity.
To better understand the actions of dynamin GTPase activity at the level of MAPK activation, we used an approach that is based on a combination of voltage-clamp electrophysiology and TIRF microscopy that allowed for visualization of Ca2+ influx through VGCCs. Our data demonstrate that dynasore exposure not only decreased the GnRH-mediated increase in Ca2+ sparklet activity, but also the Ca2+ sparklet site density. This potentially explains why dynasore attenuates ERK activation while JNK activation remained unaffected. JNK activation is known to be mediated by IP3 calcium stores, not VGCC (6). Although it is known that activation of ERK by GnRH requires influx of extracellular Ca2+ through VGCCs (6), we are the first to show a role for dynamin regulating ERK activation through VGCCs.
One question still unanswered is precisely where in the cell signaling cascade dynamin is engaging the actin cytoskeleton and associating with cortactin after GnRHR activation to facilitate Ca2+ influx through VGCCs. Our data suggest that dynamin is working downstream of GnRHR activation but upstream of PKC, because direct stimulation of PKC with PMA leads to ERK activation in the presence of dynasore. Consistent with these findings, our previous work in αT3–1 cells has shown that actin cytoskeletal reorganization is also working downstream of the GnRHR but upstream of both PKC and VGCCs (30). These data suggest that ERK activation in gonadotropes is at least partially dependent on the ability of dynamin to associate with cortactin and engage the actin cytoskeleton to then drive PKC-dependent activation of VGCCs. Future studies are necessary to examine how dynamin GTPase activity and the actin cytoskeleton influence the trafficking of PKC in gonadotropes to drive VGCC activity.
In summary, our data support a model by where dynamin is a multifunctional protein not only involved in regulating membrane remodeling through the actin cytoskeleton but also mediating cell signaling events important in gonadotropin subunit synthesis. We propose a model where through GTP hydrolysis, dynamin associates with cortactin and engages the actin cytoskeleton which is critical in driving PKC-dependent VGCC activity and subsequent ERK activation. This mechanism displays a novel role for dynamin that may underlie how gonadotropes maintain adequate sensitivity to incoming neuroendocrine stimulation to produce a physiological response and alignment towards anterior pituitary microvasculature.
Acknowledgments
We thank Dr Gary Whittaker (Cornell University) for the Dynamin-GFP construct. We also thank Dr Pamela Mellon for the αT3–1 and LβT2 cell lines.
This work was supported by the National Center for Research Resources Grant P20RR016474 and the National Institute of General Medical Sciences Grant P20GM103432 from the National Institutes of Health (to A.M.N.). This work was supported by National Institutes of Health Grants R01 HD065943 (to C.M.C.) and 1R01HL111060 (to G.C.A.).
Disclosure Summary: The authors have nothing to disclose.
Footnotes
- [Ca2+]i
- intracellular Ca2+ concentration
- CLSM
- confocal laser-scanning microscope
- Ct
- threshold cycle
- DAPI
- 4′,6-diamidino-2-phenylindole
- FB
- fluorescence buffer
- GFP
- green fluorescent protein
- GnRHR
- GnRH receptor
- HRP
- horseradish peroxidase
- IP3
- inositol-1,4,5-triphosphate
- JNK
- c-Jun N-terminal kinase
- KO
- knockout
- nPs
- number of quantal levels detected and probability that the site is active
- PFA
- paraformaldehyde
- PKC
- protein kinase C
- PMA
- phorbol 12-myristate 13-acetate
- PRD
- proline-rich domain
- RIPA
- radio-immunoprecipitation assay
- SDS
- sodium dodecyl sulfate
- TBST
- Tris-buffered saline with Tween 20
- TIRF
- total internal reflection fluorescence
- VGCC
- voltage-gated L-type Ca2+ channels.
References
- 1. Kaiser UB, Conn PM, Chin WW. Studies of gonadotropin-releasing hormone (GnRH) action using GnRH receptor-expressing pituitary cell lines. Endocr Rev. 1997;18(1):46–70. [DOI] [PubMed] [Google Scholar]
- 2. McArdle CA, Bunting R, Mason WT. Dynamic video imaging of cystolic Ca(2+) in the αT3–1, gonadotrope-derived cell line. Mol Cell Neurosci. 1992;3(2):124–132. [DOI] [PubMed] [Google Scholar]
- 3. Horn F, Bilezikjian LM, Perrin MH, et al. Intracellular responses to gonadotropin-releasing hormone in a clonal cell line of the gonadotrope lineage. Mol Endocrinol. 1991;5(3):347–355. [DOI] [PubMed] [Google Scholar]
- 4. Naor Z. Signaling by G-protein-coupled receptor (GPCR): studies on the GnRH receptor. Front Neuroendocrinol. 2009;30(1):10–29. [DOI] [PubMed] [Google Scholar]
- 5. Stanislaus D, Janovick JA, Brothers S, Conn PM. Regulation of G(q/11)α by the gonadotropin-releasing hormone receptor. Mol Endocrinol. 1997;11(6):738–746. [DOI] [PubMed] [Google Scholar]
- 6. Mulvaney JM, Roberson MS. Divergent signaling pathways requiring discrete calcium signals mediate concurrent activation of two mitogen-activated protein kinases by gonadotropin-releasing hormone. J Biol Chem. 2000;275(19):14182–14189. [DOI] [PubMed] [Google Scholar]
- 7. Wolfe MW, Call GB. Early growth response protein 1 binds to the luteinizing hormone-β promoter and mediates gonadotropin-releasing hormone-stimulated gene expression. Mol Endocrinol. 1999;13(5):752–763. [DOI] [PubMed] [Google Scholar]
- 8. Liu F, Austin DA, Mellon PL, Olefsky JM, Webster NJ. GnRH activates ERK1/2 leading to the induction of c-fos and LHβ protein expression in LβT2 cells. Mol Endocrinol. 2002;16(3):419–434. [DOI] [PubMed] [Google Scholar]
- 9. Tremblay JJ, Drouin J. Egr-1 is a downstream effector of GnRH and synergizes by direct interaction with Ptx1 and SF-1 to enhance luteinizing hormone β gene transcription. Mol Cell Biol. 1999;19(4):2567–2576. [DOI] [PMC free article] [PubMed] [Google Scholar]
- 10. Bliss SP, Miller A, Navratil AM, et al. ERK signaling in the pituitary is required for female but not male fertility. Mol Endocrinol. 2009;23(7):1092–1101. [DOI] [PMC free article] [PubMed] [Google Scholar]
- 11. Lee SL, Sadovsky Y, Swirnoff AH, et al. Luteinizing hormone deficiency and female infertility in mice lacking the transcription factor NGFI-A (Egr-1). Science. 1996;273(5279):1219–1221. [DOI] [PubMed] [Google Scholar]
- 12. Navratil AM, Knoll JG, Whitesell JD, Tobet SA, Clay CM. Neuroendocrine plasticity in the anterior pituitary: gonadotropin-releasing hormone-mediated movement in vitro and in vivo. Endocrinology. 2007;148(4):1736–1744. [DOI] [PubMed] [Google Scholar]
- 13. Pollard TD, Cooper JA. Actin, a central player in cell shape and movement. Science. 2009;326(5957):1208–1212. [DOI] [PMC free article] [PubMed] [Google Scholar]
- 14. Porat-Shliom N, Milberg O, Masedunskas A, Weigert R. Multiple roles for the actin cytoskeleton during regulated exocytosis. Cell Mol Life Sci. 2013;70(12):2099–2121. [DOI] [PMC free article] [PubMed] [Google Scholar]
- 15. Childs GV. Shifts in gonadotropin storage in cultured gonadotropes following GnRH stimulation, in vitro. Peptides. 1985;6(1):103–107. [DOI] [PubMed] [Google Scholar]
- 16. Navratil AM, Dozier MG, Whitesell JD, Clay CM, Roberson MS. Role of cortactin in dynamic actin remodeling events in gonadotrope cells. Endocrinology. 2014;155(2):548–557. [DOI] [PMC free article] [PubMed] [Google Scholar]
- 17. Ochoa GC, Slepnev VI, Neff L, et al. A functional link between dynamin and the actin cytoskeleton at podosomes. J Cell Biol. 2000;150(2):377–389. [DOI] [PMC free article] [PubMed] [Google Scholar]
- 18. McNiven MA, Kim L, Krueger EW, Orth JD, Cao H, Wong TW. Regulated interactions between dynamin and the actin-binding protein cortactin modulate cell shape. J Cell Biol. 2000;151(1):187–198. [DOI] [PMC free article] [PubMed] [Google Scholar]
- 19. Orth JD, Krueger EW, Cao H, McNiven MA. The large GTPase dynamin regulates actin comet formation and movement in living cells. Proc Natl Acad Sci USA. 2002;99(1):167–172. [DOI] [PMC free article] [PubMed] [Google Scholar]
- 20. Zhang P, Hinshaw JE. Three-dimensional reconstruction of dynamin in the constricted state. Nat Cell Biol. 2001;3(10):922–926. [DOI] [PubMed] [Google Scholar]
- 21. Nakata T, Iwamoto A, Noda Y, Takemura R, Yoshikura H, Hirokawa N. Predominant and developmentally regulated expression of dynamin in neurons. Neuron. 1991;7(3):461–469. [DOI] [PubMed] [Google Scholar]
- 22. Cook TA, Urrutia R, McNiven MA. Identification of dynamin 2, an isoform ubiquitously expressed in rat tissues. Proc Natl Acad Sci USA. 1994;91(2):644–648. [DOI] [PMC free article] [PubMed] [Google Scholar]
- 23. Nakata T, Takemura R, Hirokawa N. A novel member of the dynamin family of GTP-binding proteins is expressed specifically in the testis. J Cell Sci. 1993;105(pt 1):1–5. [DOI] [PubMed] [Google Scholar]
- 24. Orth JD, McNiven MA. Dynamin at the actin-membrane interface. Curr Opin Cell Biol. 2003;15(1):31–39. [DOI] [PubMed] [Google Scholar]
- 25. Gray NW, Kruchten AE, Chen J, McNiven MA. A dynamin-3 spliced variant modulates the actin/cortactin-dependent morphogenesis of dendritic spines. J Cell Sci. 2005;118(pt 6):1279–1290. [DOI] [PubMed] [Google Scholar]
- 26. Schafer DA, Weed SA, Binns D, Karginov AV, Parsons JT, Cooper JA. Dynamin2 and cortactin regulate actin assembly and filament organization. Curr Biol. 2002;12(21):1852–1857. [DOI] [PMC free article] [PubMed] [Google Scholar]
- 27. Krueger EW, Orth JD, Cao H, McNiven MA. A dynamin-cortactin-Arp2/3 complex mediates actin reorganization in growth factor-stimulated cells. Mol Biol Cell. 2003;14(3):1085–1096. [DOI] [PMC free article] [PubMed] [Google Scholar]
- 28. Benard O, Naor Z, Seger R. Role of dynamin, Src, and Ras in the protein kinase C-mediated activation of ERK by gonadotropin-releasing hormone. J Biol Chem. 2001;276(7):4554–4563. [DOI] [PubMed] [Google Scholar]
- 29. Gregg DW, Allen MC, Nett TM. Estradiol-induced increase in number of gonadotropin-releasing hormone receptors in cultured ovine pituitary cells. Biol Reprod. 1990;43(6):1032–1036. [DOI] [PubMed] [Google Scholar]
- 30. Dang AK, Murtazina DA, Magee C, Navratil AM, Clay CM, Amberg GC. GnRH evokes localized subplasmalemmal calcium signaling in gonadotropes. Mol Endocrinol. 2014:me20141208. [DOI] [PMC free article] [PubMed] [Google Scholar]
- 31. Chaplin NL, Amberg GC. Hydrogen peroxide mediates oxidant-dependent stimulation of arterial smooth muscle L-type calcium channels. Am J Physiol Cell Physiol. 2012;302(9):C1382–C1393. [DOI] [PubMed] [Google Scholar]
- 32. Amberg GC, Earley S, Glapa SA. Local regulation of arterial L-type calcium channels by reactive oxygen species. Circ Res. 2010;107(8):1002–1010. [DOI] [PMC free article] [PubMed] [Google Scholar]
- 33. Navedo MF, Amberg GC, Votaw VS, Santana LF. Constitutively active L-type Ca2+ channels. Proc Natl Acad Sci USA. 2005;102(31):11112–11117. [DOI] [PMC free article] [PubMed] [Google Scholar]
- 34. Navedo MF, Amberg GC, Nieves M, Molkentin JD, Santana LF. Mechanisms underlying heterogeneous Ca2+ sparklet activity in arterial smooth muscle. J Gen Physiol. 2006;127(6):611–622. [DOI] [PMC free article] [PubMed] [Google Scholar]
- 35. Maravall M, Mainen ZF, Sabatini BL, Svoboda K. Estimating intracellular calcium concentrations and buffering without wavelength ratioing. Biophys J. 2000;78(5):2655–2667. [DOI] [PMC free article] [PubMed] [Google Scholar]
- 36. Alim Z, Hartshorn C, Mai O, et al. Gonadotrope plasticity at cellular and population levels. Endocrinology. 2012;153(10):4729–4739. [DOI] [PMC free article] [PubMed] [Google Scholar]
- 37. Mooren OL, Kotova TI, Moore AJ, Schafer DA. Dynamin2 GTPase and cortactin remodel actin filaments. J Biol Chem. 2009;284(36):23995–24005. [DOI] [PMC free article] [PubMed] [Google Scholar]
- 38. Macia E, Ehrlich M, Massol R, Boucrot E, Brunner C, Kirchhausen T. Dynasore, a cell-permeable inhibitor of dynamin. Dev Cell. 2006;10(6):839–850. [DOI] [PubMed] [Google Scholar]
- 39. Min L, Soltis K, Reis AC, et al. Dynamic kisspeptin receptor trafficking modulates kisspeptin-mediated calcium signaling. Mol Endocrinol. 2014;28(1):16–27. [DOI] [PMC free article] [PubMed] [Google Scholar]
- 40. Merelli F, Stojilković SS, Iida T, et al. Gonadotropin-releasing hormone-induced calcium signaling in clonal pituitary gonadotrophs. Endocrinology. 1992;131(2):925–932. [DOI] [PubMed] [Google Scholar]
- 41. Mulvaney JM, Zhang T, Fewtrell C, Roberson MS. Calcium influx through L-type channels is required for selective activation of extracellular signal-regulated kinase by gonadotropin-releasing hormone. J Biol Chem. 1999;274(42):29796–29804. [DOI] [PubMed] [Google Scholar]
- 42. Bruzzaniti A, Neff L, Sanjay A, et al. Dynamin forms a Src kinase-sensitive complex with Cbl and regulates podosomes and osteoclast activity. Mol Biol Cell. 2005;16(7):3301–3313. [DOI] [PMC free article] [PubMed] [Google Scholar]
- 43. Ezratty EJ, Partridge MA, Gundersen GG. Microtubule-induced focal adhesion disassembly is mediated by dynamin and focal adhesion kinase. Nat Cell Biol. 2005;7(6):581–590. [DOI] [PubMed] [Google Scholar]
- 44. Gu C, Yaddanapudi S, Weins A, et al. Direct dynamin-actin interactions regulate the actin cytoskeleton. EMBO J. 2010;29(21):3593–3606. [DOI] [PMC free article] [PubMed] [Google Scholar]
- 45. Park RJ, Shen H, Liu L, Liu X, Ferguson SM, De Camilli P. Dynamin triple knockout cells reveal off target effects of commonly used dynamin inhibitors. J Cell Sci. 2013;126(pt 22):5305–5312. [DOI] [PMC free article] [PubMed] [Google Scholar]
- 46. Ferguson SM, Brasnjo G, Hayashi M, et al. A selective activity-dependent requirement for dynamin 1 in synaptic vesicle endocytosis. Science. 2007;316(5824):570–574. [DOI] [PubMed] [Google Scholar]
- 47. Ferguson SM, Ferguson S, Raimondi A, et al. Coordinated actions of actin and BAR proteins upstream of dynamin at endocytic clathrin-coated pits. Dev Cell. 2009;17(6):811–822. [DOI] [PMC free article] [PubMed] [Google Scholar]
- 48. Liu YW, Surka MC, Schroeter T, Lukiyanchuk V, Schmid SL. Isoform and splice-variant specific functions of dynamin-2 revealed by analysis of conditional knock-out cells. Mol Biol Cell. 2008;19(12):5347–5359. [DOI] [PMC free article] [PubMed] [Google Scholar]
- 49. Childs GV, Unabia G, Lee BL, Rougeau D. Heightened secretion by small and medium-sized luteinizing hormone (LH) gonadotropes late in the cycle suggests contributions to the LH surge or possible paracrine interactions. Endocrinology. 1992;130(1):345–352. [DOI] [PubMed] [Google Scholar]
- 50. Call GB, Wolfe MW. Gonadotropin-releasing hormone activates the equine luteinizing hormone β promoter through a protein kinase C/mitogen-activated protein kinase pathway. Biol Reprod. 1999;61(3):715–723. [DOI] [PubMed] [Google Scholar]
- 51. Saunders BD, Sabbagh E, Chin WW, Kaiser UB. Differential use of signal transduction pathways in the gonadotropin-releasing hormone-mediated regulation of gonadotropin subunit gene expression. Endocrinology. 1998;139(4):1835–1843. [DOI] [PubMed] [Google Scholar]
- 52. Harris D, Bonfil D, Chuderland D, Kraus S, Seger R, Naor Z. Activation of MAPK cascades by GnRH: ERK and Jun N-terminal kinase are involved in basal and GnRH-stimulated activity of the glycoprotein hormone LHβ-subunit promoter. Endocrinology. 2002;143(3):1018–1025. [DOI] [PubMed] [Google Scholar]
- 53. Davidson L, Pawson AJ, Millar RP, Maudsley S. Cytoskeletal reorganization dependence of signaling by the gonadotropin-releasing hormone receptor. J Biol Chem. 2004;279(3):1980–1993. [DOI] [PubMed] [Google Scholar]


