Abstract
In both mice and patients with Albright hereditary osteodystrophy, heterozygous inactivating mutations of Gsα, a ubiquitously expressed G protein that mediates receptor-stimulated intracellular cAMP production, lead to obesity and insulin resistance but only when the mutation is present on the maternal allele. This parent-of-origin effect in mice was shown to be due to Gsα imprinting in one or more brain regions. The ventromedial hypothalamus (VMH) is involved in the regulation of energy and glucose homeostasis, but the role of Gsα in VMH on metabolic regulation is unknown. To examine this, we created VMH-specific Gsα-deficient mice by mating Gsα-floxed mice with SF1-cre mice. Heterozygotes with Gsα mutation on either the maternal or paternal allele had a normal metabolic phenotype, and there was no molecular evidence of Gsα imprinting, indicating that the parent-of-origin metabolic effects associated with Gsα mutations is not due to Gsα deficiency in VMH SF1 neurons. Homozygous VMH Gsα knockout mice (VMHGsKO) showed no changes in body weight on either a regular or high-fat diet. However, glucose metabolism (fasting glucose, glucose tolerance, insulin sensitivity) was significantly improved in male VMHGsKO mice, with the difference more dramatic on the high-fat diet. In addition, male VMHGsKO mice on the high-fat diet showed a greater anorexigenic effect and increased VMH signal transducer and activator of transcription-3 phosphorylation in response to leptin. These results indicate that VMH Gsα/cyclic AMP signaling regulates glucose homeostasis and alters leptin sensitivity in mice, particularly in the setting of excess caloric intake.
The ubiquitously expressed G protein α-subunit Gsα couples receptors for hormones, neurotransmitters, and other factors to the activation of adenylyl cyclase and generation of intracellular cAMP, which mediates its actions primarily via two major intracellular effectors: cAMP-dependent protein kinase and exchange protein directly activated by cAMP (Epacs). Gsα/cAMP signaling has been shown to play an important role in the regulation of metabolic homeostasis (1), and inactivating Gsα mutations lead to severe early-onset obesity and insulin resistance in Albright hereditary osteodystrophy patients (2, 3) and in mice (4, 5). These metabolic effects only occur with mutations on the maternal Gsα allele due to genomic imprinting of the Gsα gene Gnas, leading to the preferential expression of Gsα from the maternal allele within the central nervous system (CNS) (4, 6), although the CNS region(s) have not yet been identified. Loss of Gsα in the CNS impairs the ability of melanocortins to stimulate sympathetic nervous system activity and energy expenditure, without affecting food intake (4).
The ventromedial nucleus of the hypothalamus (VMH) is critically involved in maintaining metabolic homeostasis (7). Mice deficient in steroidogenic factor 1 (SF1), a transcription factor required for VMH development, develop severe obesity (8). Deficiency of brain-derived neurotrophic factor (BDNF), a factor highly enriched in the VMH, leads to hyperphagic obesity (9, 10). BDNF expression in the VMH is positively regulated by feeding and activation of melanocortin (MC4R) receptors (11) that are expressed in the VMH (12, 13). However, whether this effect is mediated by Gsα is unknown.
Leptin receptors are also expressed in the VMH (14, 15), and leptin signaling in the VMH plays important roles in metabolic regulation. For example, mice lacking leptin receptors in the SF1 neurons of the VMH are obese and more prone to diet-induced obesity (16, 17), whereas the postnatal loss of SF1 expression leads to reduced leptin sensitivity and less resistance to diet-induced obesity (18). cAMP has been implicated as a negative regulator of leptin action, as activation of the Epac1 pathway in hypothalamus reduces the effects of leptin on energy balance and glucose metabolism (19, 20). Some or all of these effects on leptin action may be secondary to the ability of cAMP-Epac1 signaling to induce the expression of suppressor of cytokine signaling 3 (SOCS3), a factor that impairs leptin action (21, 22). Loss of SOCS3 in the VMH leads to enhanced leptin action and improved glucose homeostasis (23). In this study we inactivated Gsα in the VMH SF1 neurons to directly determine the role of VMH Gsα signaling on metabolic regulation and to determine whether Gsα is imprinted in the VMH.
Materials and Methods
Animals
Mice with selective deletion of Gsα in the VMH (VMHGsKO, E1fl/fl:SF1-cre) were generated by repeated matings of Gsα-floxed mice (E1fl/fl) (5) with SF1-cre mice (purchased from Jackson Laboratory), in which cre recombinase is expressed in the VMH, as well as pituitary, gonad, and adrenal glands (16). Maternal heterozygotes (mVMHGsKO, E1fl/+:SF1-cre) were generated by mating female E1fl/fl mice with male SF1-cre mice, whereas paternal heterozygotes (pVMHGsKO) were generated by reciprocal crosses. Genotyping was performed by PCR as previously described (24). Primers to determine the presence of SF1-cre used the following primers: SF1-cre, 5′-CTGAGCTGCAGCGCAGGGACAT-3′ (forward); 5′-TGCGAACCTCATCACTCGTTGCAT-3′ (reverse); and for α-tubulin (internal control for amplification), 5′-GTGGGTTCCAGGTCTACGAA-3′ (forward); 5′-AGACCATTGGGGGAGGAGAT-3′ (reverse). Maternal and paternal Gsα heterozygotes in whole brain (mBrGsKO and pBrGsKO) were generated by matings of E1fl/fl and Nestin-cre mice as previously described (4). The E1fl/fl allele has no effect on Gsα expression or phenotype (5), and therefore, all SF1-cre− or E1+/+ littermates were used as controls. Mice were housed in a temperature-controlled room with a 12-hour light, 12-hour dark cycle with free access to food and water. Mice were fed with either standard chow diet (RD; NIH-07, 5% fat by weight) or a high-fat diet for up to 5 months (HFD; 60 kcal% fat; Research Diets). Unless otherwise indicated, experiments were done on animals at 12–16 weeks of age. All studies were approved by the National Institute of Diabetes and Digestive and Kidney Diseases Animal Care and Use Committee.
Body weight, composition, food intake, and metabolism
In studies using HFD, the HFD was begun at 6 weeks of age. Body composition was determined using the Echo3-in-1 NMR analyzer (Echo Medical). Food intake was measured in individually housed male mice over 14 days as previously described (4). Energy expenditure was measured using a flow-chamber Oxymax system (Columbus Instruments) as previously described (6). Motor activity was measured using infrared beam interruption (OptoVarimex mini; Columbus Instruments).
Glucose and insulin tolerance tests
Glucose and insulin tolerance tests were performed on overnight fasted mice with ip injection of glucose (2 mg/g) or insulin (Humulin, 0.75 mIU/g). Blood glucose in tail blood was measured prior to the injection and at indicated times after the injection using a Glucometer Elite (Bayer).
Leptin responses
Male mice were individually housed and habituated to daily ip saline injection for 3 days prior to experimental measurements. Mice then received saline ip injections for 3 days followed by ip injections of murine leptin (PeproTech) twice daily (9:00 am and 5:30 pm) for 3 days. Leptin doses were 0.75 μg/g for mice on the RD and 1 μg/g for mice on the HFD. Food and body weight were weighed at 9:00 am daily. Average daily food intake and body weight determined during the initial 3 days of saline injections were used as baseline.
Immunohistochemistry
To examine phosphorylated signal transducer and activator of transcription (STAT)-3 and SOCS3 responses to leptin, overnight-fasted mice were ip injected with leptin (5 μg/g) or saline and 45 minutes later were anesthetized with avertin and transcardially perfused with ice-cold PBS followed by ice-cold 4% paraformaldehyde prior to removing brains and then brains were cryoprotected in 30% sucrose in PBS overnight at 4°C. To examine SOCS3 and BDNF expression in randomly fed mice, brains were removed and postfixed in 4% paraformaldehyde for 5 hours prior to cryoprotection. Brain sections (20 μm) were cut using a microtome, and immunohistochemistry was performed using an anti-pSTAT3 antibody (Tyr 705; Cell Signaling), an anti-SOCS3 antibody (Santa Cruz Biotechnology), or an anti-BDNF antibody (EMD Millipore) (Table 2). Signals within the VMH were captured and averaged on a minimum of four sections from each mouse and quantified using ImageJ software (National Institutes of Health, Bethesda, Maryland).
Table 2.
Antibody Table
| Peptide/Protein Target | Antigen Sequence (if Known) | Name of Antibody | Manufacturer, Catalog Number, and/or Name of Individual Providing the Antibody | Species Raised (Monoclonal or Polyclonal) | Dilution Used |
|---|---|---|---|---|---|
| Phospho-Stat3 Tyr705 | P-STAT3 (Y705) (D3A7) | Cell Signaling Technology, catalog number 9145 | Rabbit, monoclonal | 1:100 times | |
| SOCS3 | SOCS-3 (H-103) | Santa Cruz Biotechnology, catalog number sc-9023 | Rabbit, polyclonal | 1:100 times | |
| BDNF | Chk proBDNF | EMD Millipore, catalog number AB9042 | Chicken, polyclonal | 1:100 times | |
| Phospho-AMPK Thr172 | Phospho-AMPK | Cell Signaling Technology, catalog number 2531 | Rabbit, polyclonal | 1:1000 times | |
| AMPKα1 and -α2 subunits | AMPKα | Cell Signaling Technology, catalog number 2532 | Rabbit, polyclonal | 1:1000 times |
In situ hybridization
Frozen brain sections (20 μm) were fixed and incubated in 0.25% acetic anhydride, 0.1 M triethanolamine hydrochloride, and 0.9% NaCl for 10 minutes and then treated with a 35S-labeled Gsα RNA probe (118 bp coding nucleotides 5–122 of the exon 1). The sections were incubated overnight at 55°C and washed in 4× saline sodium citrate three times, dehydrated, and immersed in 0.3 mM NaCl, 50% formamide, 20 mM Tris-HCl, 1 mM EDTA at 60°C for 15 minutes. After hybridization, slices were exposed to nitroblue tetrazolium salt-2 emulsion for 3 days and then counterstained with hematoxylin and eosin. Signals in the VMH were quantified with Image-Pro Plus software (Media Cybernetics).
Biochemical assays
Serum insulin, leptin, and adiponectin levels were measured using RIA kits from Linco Research and serum corticosterone, T, and estradiol levels were measured using RIA kits from MD Biomedical. Serum glucagon levels were measured using an ELISA kit from Mercodia. Free fatty acids and triglycerides were measured using reagents purchased from Roche and Thermo DNA, respectively. Serum glucose levels were measured using a Glucometer Elite (Bayer).
Statistics
Data are presented as mean ± SEM. Statistical significance was determined using unpaired t tests or a one-way ANOVA. Differences were considered significant at P < .05.
Results
Generation of VMHGsKO mice
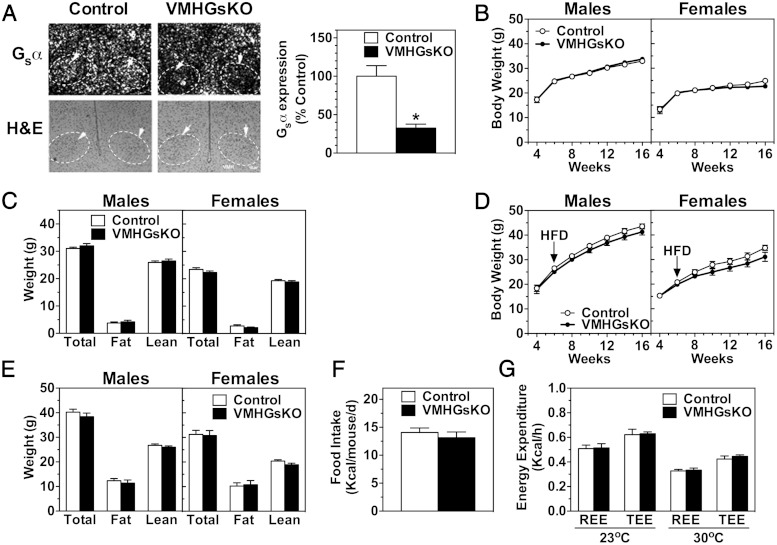
Mice with homozygous deletion of Gsα in the VMH (VMHGsKO) were generated by appropriate crosses of SF1-cre and Gsα-floxed mice. Results of in situ hybridization showed VMH Gsα mRNA expression to be reduced by 68% in VMHGsKO mice as compared with controls (Figure 1A). Residual Gsα expression in the VMH is expected because SF1-cre is not expressed in glial and other nonneural cells, as well as non-SF1 neurons, within the VMH. Although SF1 is also expressed in the pituitary, gonad, and adrenal glands (25, 26), we found no differences in serum levels of corticosterone or sex steroids between control and VMHGsKO mice (control vs VMHGsKO: corticosterone, 181 ± 28 vs 177 ± 57 ng/mL; T in males, 2.52 ± 0.93 vs 2.62 ± 0.99 ng/mL; estradiol in females, 23.9 ± 4.5 vs 27.5 ± 1.5 pg/mL). VMHGsKO mice had normal survival with predicted Mendelian ratios at weaning.
Figure 1.
Gsα deficiency in the VMH does not affect energy balance. A, Left panel, Representative images of in situ hybridization for Gsα mRNA (above) and hematoxylin and eosin (H&E) staining (lower panels) of VMH (indicated with arrows and dashed outlines) from control (left panels) and VMHGsKO mice (right panels). Scale bar, 100 μm. Hybridization with a sense Gsα riboprobe produced no significant signal (not shown). Right panel, Quantification of VMH Gsα mRNA expression as percentage of control (n = 5/group). *, P < .05. B–E, Body weight curves (B and D) and body composition (C and E) of male and female VMHGsKO mice and their control littermates on RD (B and C) and HFD (D and E). F and G, Food intake (F) and resting (REE) and total energy expenditure (TEE) at ambient (23°C) and thermoneutral temperature (30°C) (G) measured in male control and VMHGsKO mice maintained on a HFD for 2 months (n = 7–18/group).
Energy balance is unaffected in homozygous VMHGsKO mice
Both male and female homozygous VMHGsKO mice had similar growth curves (body weight vs age) and body composition as compared with control littermates on both the RD (Figure 1, B and C) and the HFD (Figure 1, D and E). Likewise, there were no differences in food intake or resting or total energy expenditure observed between male VMHGsKO and control mice after 2 months on the HFD (Figure 1, F and G). Consistent with normal body composition, serum leptin levels were similar to controls in both male and female VMHGsKO mice on both the RD and HFD (Table 1). There were also no differences in serum levels of adiponectin, total cholesterol, free fatty acids, or triglycerides, except for a significant reduction in serum triglyceride levels in female VMHGsKO mice on HFD (Table 1). These results indicate that energy balance and lipid metabolism were unaffected for the most part in VMHGsKO mice.
Table 1.
Serum Chemistry in VMHGsKO and Control Mice on RD or HFDa
| Female RD |
Male RD |
Female HFD |
Male HFD |
|||||
|---|---|---|---|---|---|---|---|---|
| Control | VMHGsKO | Control | VMHGsKO | Control | VMHGsKO | Control | VMHGsKO | |
| Insulin, ng/mL | 1.00 ± 0.30 | 0.82 ± 0.31 | 1.60 ± 0.38 | 1.25 ± 0.48 | 1.38 ± 0.31 | 0.54 ± 0.03 | 21.4 ± 6.14 | 5.82 ± 1.69b |
| Triglycerides, mg/dL | 90 ± 12 | 81 ± 8 | 138 ± 17 | 141 ± 12 | 122 ± 12 | 78 ± 8b | 112 ± 24 | 98 ± 12 |
| FFAs, mM | 0.63 ± 0.13 | 0.86 ± 0.08 | 0.53 ± 0.12 | 0.82 ± 0.15b | 0.74 ± 0.08 | 0.70 ± 0.09 | 0.48 ± 0.09 | 0.45 ± 0.07 |
| Leptin, ng/mL | 7.15 ± 2.05 | 5.21 ± 0.42 | 7.95 ± 1.25 | 5.76 ± 1.66 | 20.5 ± 7.7 | 10.7 ± 3.8 | 31.1 ± 5.3 | 28.5 ± 4.8 |
| Cholesterol, mg/dL | 105 ± 7 | 104 ± 7 | 138 ± 12 | 119 ± 9 | 148 ± 7 | 129 ± 13 | 184 ± 6 | 187 ± 10 |
| Adiponectin, g/mL | 13.8 ± 1.4 | 13.7 ± 0.8 | 5.4 ± 0.6 | 5.1 ± 0.3 | ND | ND | ND | ND |
Abbreviations: FFA, free fatty acid; ND, not done. Data are presented as mean ± SEM.
Measured in 3-month-old mice on a RD or 6.5-month-old mice on 5 months of a HFD (n = 4–7/group).
P < .05 vs control littermates.
Homozygous VMHGsKO mice have improved glucose metabolism
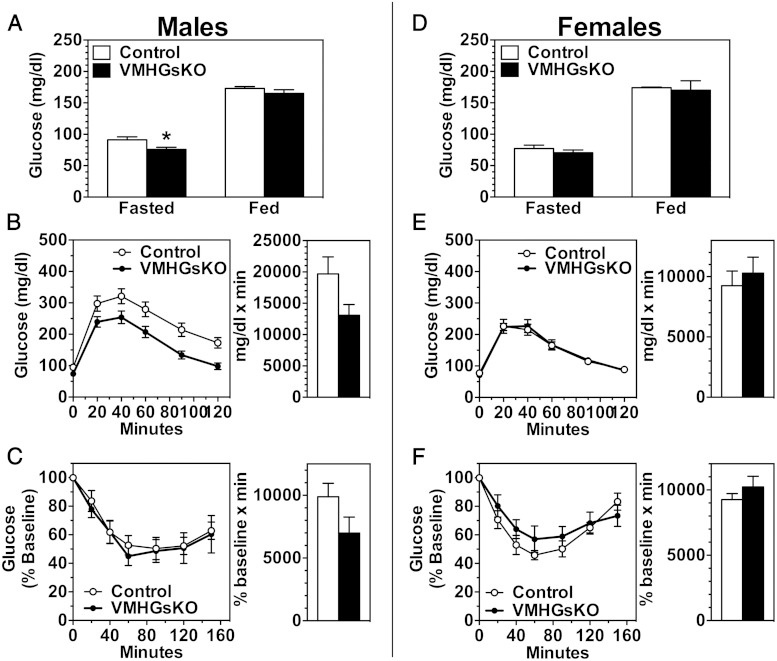
Despite the lack of an effect on adiposity, VMHGsKO mice did show significant alterations in glucose metabolism. On the RD, fasting blood glucose was significantly reduced in male, but not in female, VMHGsKO mice (Figure 2, A and D). In the nonfasted state, both glucose and insulin levels were not significantly altered in either male or female VMHGsKO mice, although insulin levels tended to be lower in male VMHGsKO mice (Figure 2, A and D, and Table 1). Male VMHGsKO mice had improved glucose tolerance (Figure 2B; P = .051 for area under curve), whereas their insulin sensitivity as measured by insulin tolerance test was unaffected (Figure 2C). In contrast, female VMHGsKO mice showed no changes in glucose tolerance or insulin sensitivity (Figure 2, E and F).
Figure 2.
Male VMHGsKO mice have improved glucose tolerance on a RD. A–C, Blood glucose levels in the fed and fasted state (A), glucose tolerance tests (B), and insulin tolerance tests (C) measured in male VMHGsKO and control mice maintained on a RD (n = 7–16/group). D–F, Blood glucose levels in the fed and fasted state (D), glucose tolerance test (E), and insulin tolerance tests (F) measured in female VMHGsKO and control mice maintained on a RD (n = 7–11/group). Area under the curves for glucose tolerance tests and areas below baseline for insulin tolerance tests are shown to the right of each panel (P = .051 for area under curve in panel B). *, P < .05.
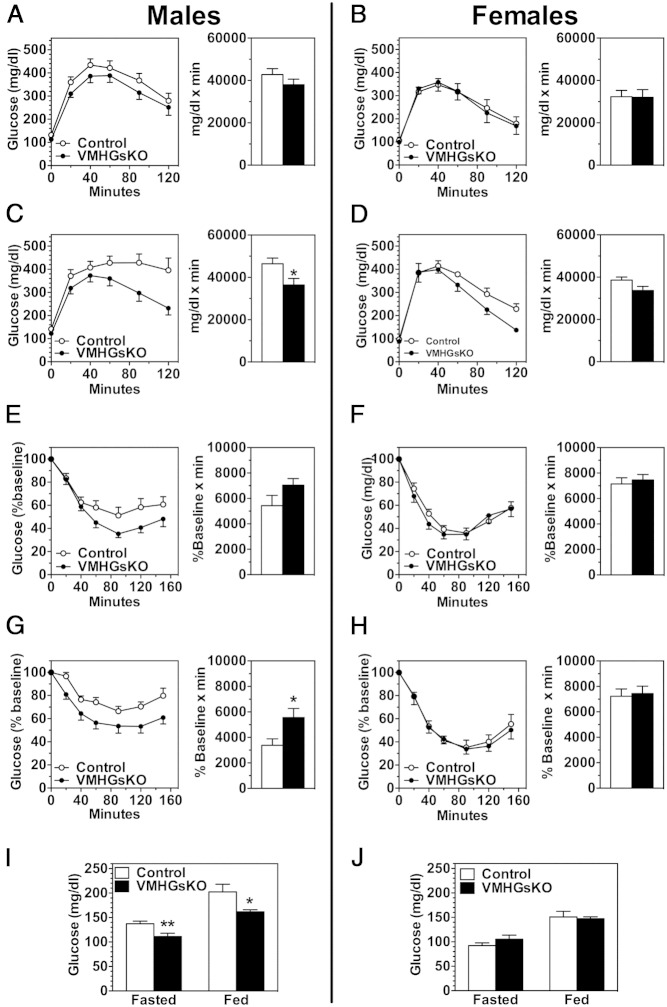
After 2 months on the HFD, both glucose tolerance and insulin sensitivity appeared to be slightly improved in male VMHGsKO mice (Figure 3, A and E), although the differences were not significant. However, after 5 months of HFD, male VMHGsKO mice had significantly reduced fed and fasting glucose and fed insulin levels (Figure 3I and Table 1) as well as significantly improved glucose tolerance and insulin sensitivity (Figure 3, C and G), despite having no significant differences in body weight or composition compared with controls (Figure 1, D and E). In contrast, female VMHGsKO mice showed no significant changes in glucose metabolism after 2 or 5 months on the HFD (Figure 3, B, D, F, H, and J, and Table 1), although there was a tendency for lower insulin levels (Table 1) and slightly improved glucose tolerance (Figure 3D) after 5 months on the HFD. Part of the apparent lack of effect of HFD on glucose metabolism in female VMHGsKO mice may relate to the fact that glucose metabolism was much less affected by HFD in their littermate controls. Overall, these results indicate that despite a lack of effect on adiposity Gsα deficiency in the VMH leads to improved glucose homeostasis, particularly in males, which is exacerbated by a HFD.
Figure 3.
VMHGsKO mice have improved glucose metabolism on a HFD. A–D, Glucose tolerance tests in male (A and C) and female (B and D) VMHGsKO and control mice maintained on a HFD for 2 months (A and B) or 5 months (C and D) (n = 5–17/group). E–H, Insulin tolerance tests in male (E and G) and female (F and H) VMHGsKO and control mice maintained on a HFD for 2 months (E and F) or 5 months (G and H) (n = 6–11/group). Area under the curves for glucose tolerance tests and areas below baseline for insulin tolerance tests are shown to the right of each panel. I and J, Blood glucose levels during fasted and fed states in male (I) and female (J) VMHGsKO and control mice maintained on a HFD for 5 months (n = 8–12/group). *, P < .05; **, P < .01.
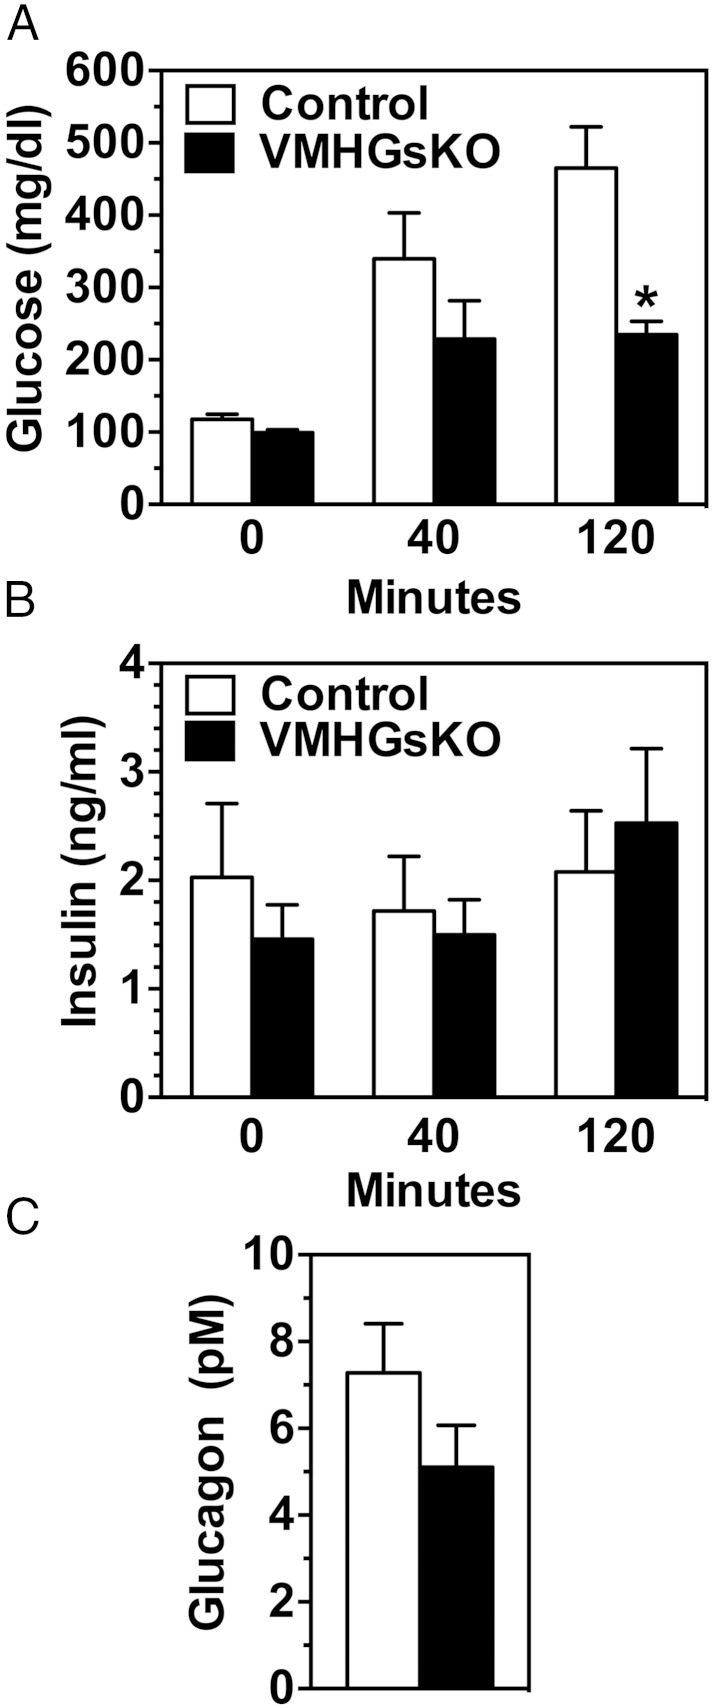
The improved insulin sensitivity in male VMHGsKO mice after 5 months of HFD was not associated with increased insulin-stimulated 2-deoxyglucose uptake in interscapular brown adipose tissue, inguinal or epididymal white adipose tissue, liver, or quadriceps or gastrocnemius muscle (Supplemental Figure 1A). mRNA levels of glucose-6-phosphatase, a rate-limiting gene for gluconeogenesis, were reduced by approximately 50% in livers of VMHGsKO maintained on either the RD or HFD (Supplemental Figure 1B), raising the possibility that gluconeogenesis may be impaired in these mice. We also examined the insulin response during the glucose tolerance test in male mice after 5 months of the HFD. Although glucose levels tended to be reduced at 40 minutes and were significantly reduced at 120 minutes (Figure 4A), there were no significant differences in insulin levels at either time point, consistent with improved insulin sensitivity. However, we cannot rule out the possibility that insulin secretion is also inappropriate. Glucagon levels in overnight-fasted mice (time 0 of the glucose tolerance test) tended to be lower, but the differences were not statistically significant (Figure 4C).
Figure 4.
Insulin and glucagon levels are unaffected in VMHGsKO mice. A and B, Serum glucose (A) and insulin (B) levels at times 0, 40, and 120 minutes during a glucose tolerance test performed in overnight fasted male control and VMHGsKO mice that were maintained on 5 months of a HFD (n = 8–9/group). C, Serum glucagon levels at time 0 during the glucose tolerance test (overnight fasted). *, P < .05 vs control.
AMP kinase (AMPK) in the VMH has been shown to be an important modulator of peripheral glucose metabolism by functioning as a sensor for hypoglycemia (27, 28). We observed no differences in AMPKα2 gene expression (Supplemental Figure 2A) or AMPKα phosphorylation (a measure of activation, Supplemental Figure 2B) in hypothalami isolated from control or VMHGsKO mice on 5 months of HFD. However, we cannot rule out an effect on AMPKα in VMHGsKO mice because this approach may not be sensitive enough to identify the differences restricted to the VMH.
VMHGsKO mice maintain leptin sensitivity on the HFD
Recent studies have shown that cAMP signals may affect leptin action, especially under conditions of excess nutrients, by induction of the Socs3 gene, which negatively regulates leptin signaling (19, 21, 22, 29). Loss of SOCS3 in the VMH SF1 neurons was shown to alter leptin sensitivity and lead to improved glucose metabolism, particularly on HFD, in the absence of altered body weight (23), a phenotype similar to what we observed in VMHGsKO mice. We therefore hypothesized that the phenotype observed in VMHGsKO mice may be associated with increased leptin sensitivity, probably via reduction in SOCS3 expression in the VMH.
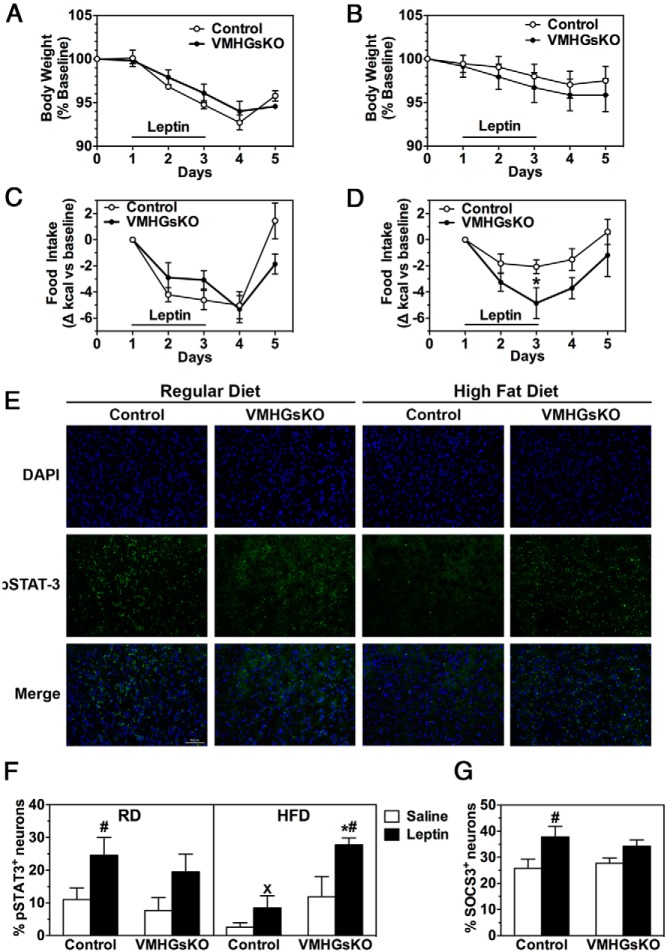
To examine leptin sensitivity, we measured the change in body weight and food intake during ip administration of leptin twice a day for 3 days in male VMHGsKO and control mice maintained on either the RD or HFD. VMHGsKO mice maintained on the RD showed no differences compared with the controls in either body weight loss or reduction in food intake in response to leptin (Figure 5, A and C). Consistent with no apparent change in leptin sensitivity, overnight-fasted VMHGsKO and control mice on RD showed similar levels of STAT3 phosphorylation in the VMH at baseline (after saline, Figure 5, E and F) and in response to leptin administration (Figure 5F). As expected, control mice on HFD showed reduced sensitivity to leptin in terms of weight loss, food intake, and STAT3 phosphorylation (Figure 5, B, D, and F) and tended to have reduced STAT3 phosphorylation at baseline (Figure 5, E and F). In contrast, VMHGsKO mice on the HFD maintained their sensitivity to leptin's effect on food intake and induction of STAT3 phosphorylation (Figure 5, D, E, and F) and baseline STAT3 phosphorylation (Figure 5, E and F), although they tended to show a slightly greater weight loss in response to leptin as compared with controls (Figure 5B).
Figure 5.
VMHGsKO mice maintain leptin sensitivity on a HFD. A–D, Body weight (A and B) and daily food intake (C and D) during leptin administration of male control and VMHGsKO mice maintained on either a RD (A and C) or 5 months of a HFD (B and D). E, Representative images of VMH showing 4′,6′-diamidino-2-phenylindole (DAPI) staining (top panels), phosphorylated STAT3 staining (pSTAT3; middle panels), and merged images (lower panels) from control and VMHGsKO mice on a RD (left panels) or 5 months of HFD (right panels). Scale bar, 50 μm. F, Quantification of the percentage of pSTAT3+ VMH neurons from control and VMHGsKO mice maintained on a RD or HFD after treatment with saline or leptin (n = 4–8/group). G, Quantification of percentage of SOCS3+ VMH neurons in male mice maintained on a HFD for 5 months after treatment with saline or leptin (n = 4–7/group). *, P < .05 vs control; #, P < .05 vs saline; x, P < .05 vs RD analyzed by one-way ANOVA.
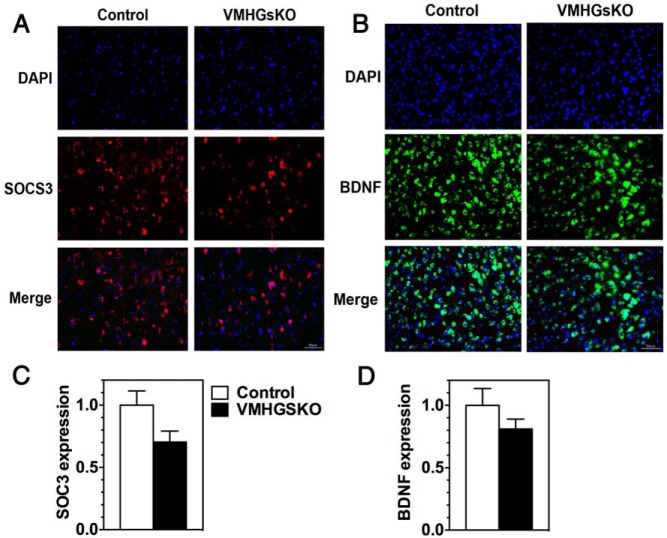
Whereas the STAT3 phosphorylation response to leptin was greater in VMHGsKO mice than in control mice on the HFD, the SOCS3 response to leptin was reduced by approximately 50% in VMHGsKO mice as compared with control mice in the same experiment (Figure 5G; 46% increase in control vs 24% increase in VMHGsKO mice in response to leptin). Levels of SOCS3 protein in the VMH tended to be lower with an approximately 30% reduction in randomly fed VMHGsKO mice maintained on the HFD as compared with controls (Figure 6, A and C, P = .07), whereas there were no differences in VMH BDNF levels between mutant and control mice (Figure 6, B and D).
Figure 6.
SOCS3 and BDNF expression in VMH of male control and VMHGsKO mice maintained on a HFD. A, Representative images of VMH showing 4′,6′-diamidino-2-phenylindole (DAPI) staining (top panels), SOCS3 staining (middle panels), and merged images (lower panels) from control and VMHGsKO mice maintained on 5 months of a HFD. Scale bar, 50 μm. B, Representative images of VMH showing DAPI staining (top panels), BDNF staining (middle panels), and merged images (lower panels) from control and VMHGsKO mice maintained on 5 months of a HFD. Scale bar, 50 μm. C and D, Quantification of SOCS3 (C) and BDNF (D) expression in VMH of control and VMHGsKO mice on HFD (n = 4/group).
Gsα is not imprinted in VMH
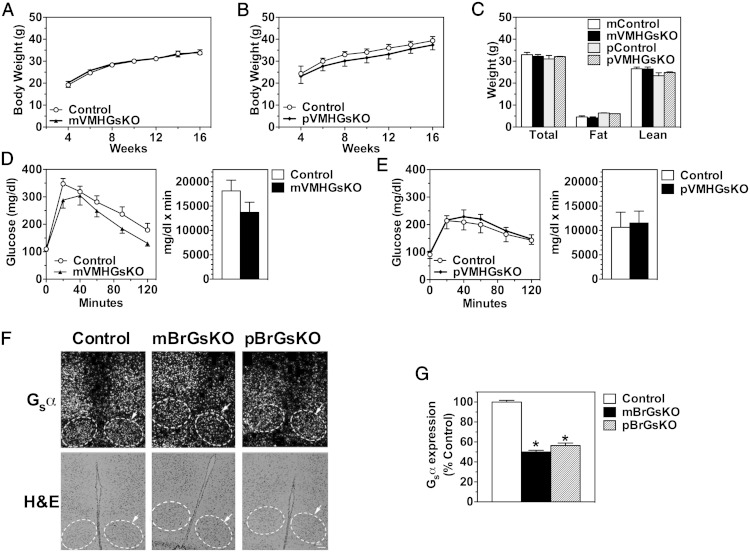
To determine whether the parent-of-origin-specific metabolic effects observed in whole brain-specific heterozygous Gsα knockouts (4) are due to Gsα imprinting in the VMH, we examined the phenotype of mice with heterozygous deletion of Gsα on either the maternal or paternal allele (mVMHGsKO and pVMHGsKO mice, respectively). Both mVMHGsKO and pVMHGsKO mice showed no differences in body weight, body composition, glucose tolerance, or insulin tolerance compared with littermate controls (Figure 7, A–E, and data not shown). Consistent with these results, in situ hybridization showed no evidence for Gsα imprinting in the VMH as VMH Gsα mRNA expression was similarly reduced by approximately 50% in whole brain maternal and paternal Gsα heterozygotes (mBrGsKO and pBrGsKO, respectively; Figure 7, F and G). These results suggest that the obesity and impaired glucose metabolism resulting from germline or whole brain maternal Gsα mutations are not due to Gsα imprinting or loss of Gsα expression in the VMH.
Figure 7.
Gsα is not imprinted in the VMH. A and B, Body weight (growth) curves of male mVMHGsKO (A) and pVMHGsKO (B) and their respective littermate controls maintained on regular chow diet. C, Body weight and composition of male mVMHGsKO and pVMHGsKO mice and their respective control littermates. D and E, Glucose tolerance tests performed on 12-week-old male mVMHGsKO (D) and pVMHGsKO (E) and their respective controls. Areas under curves are shown to the right of each panel. F, Representative VMH sections from control (left panel), mBrGsKO (middle panel), and pBrGsKO (right panel) showing in situ hybridization for Gsα mRNA (upper panels) and hematoxylin and eosin (H&E) staining (lower panels). Arrows and dashed outlines indicate VMH. Scale bar, 100 μm. In situ hybridization with a sense Gsα probe shows no signal (not shown). G, Quantitation of VMH Gsα mRNA expression levels based on in situ hybridization (n = 5–10/group). *, P < .01 vs Control.
Discussion
In this study we examined the role of Gsα signaling in the VMH because it has been implicated in the regulation of both feeding and peripheral glucose metabolism. Homozygous VMH Gsα deficiency in VMHGsKO mice did not have an effect on energy balance (body weight, adiposity, energy expenditure, or food intake) in animals raised on the RD or HFD, suggesting that Gsα signaling in the VMH SF1 neurons play a minimal role in control of energy balance. These findings are somewhat surprising because various factors that activate Gsα/cAMP signaling pathways (eg, glucagon-like peptide 1, melanocortins) have been shown to exert effects on energy balance within the VMH (11, 30). Although activation of the melanocortin receptor MC4R has been shown to induce BDNF expression in the VMH and BDNF in the VMH is an important regulator of food intake, body weight, and body length (9–11), VMH BDNF expression, adiposity, body length, and food intake were not affected in VMHGsKO mice. These results, plus our prior results showing no effect of whole-brain maternal Gsα deficiency on food intake or body length (4), suggest that if MC4R up-regulates BDNF in the VMH, it may do so through a Gsα-independent mechanism. It may also be possible that the lack of an effect on energy balance in VMHGsKO mice reflects the induction of compensatory mechanisms either in the VMH or at other sites.
Despite the absence of obesity, VMHGsKO mice displayed improved glucose metabolism when placed on a HFD. The effects on glucose metabolism were more prominent in males, which was not due to differences in Gsα expression because Gsα mRNA levels were equally reduced in male and female VMHGsKO mice (data not shown). We also ruled out the possibility that these effects were caused by Gsα deficiency in the pituitary, gonads, or adrenal glands because levels of hormones secreted by these glands were unaltered in VMHGsKO mice. We did not observe a change in hypothalamic AMPKα expression or activation as a possible explanation for the abnormal glucose metabolism in VMHGsKO mice, although we cannot rule out alterations in AMPKα limited to the VMH. However, if VMH AMPK was altered in VMHGsKO mice, one might have expected these mice to also have altered energy balance because VMH AMPK has been implicated as being important in energy balance as well as glucose metabolism (30–32).
The resistance to the effects of HFD on glucose metabolism observed in VMHGsKO mice was also accompanied by the prevention of leptin resistance on the HFD, particularly with respect to its effects on food intake and STAT3 phosphorylation, when measured over a 3-day period. These results are consistent with prior studies showing that increased activation of Epac1 by cAMP leads to leptin resistance via induction of SOCS3, an intracellular factor that inhibits leptin signaling (19, 21, 22, 29), whereas Epac1 deficiency leads to resistance to diet-induced obesity and improved glucose metabolism and leptin sensitivity (20). In fact, one study showed that loss of SOCS3 in the VMH SF1 neurons leads to improved glucose metabolism on a HFD without a change in adiposity, a phenotype very similar to that observed in VMHGsKO mice. We observed an approximately 30% reduction in VMH SOCS3 expression and an approximately 50% reduction in the SOCS3 response to leptin in HFD-fed VMHGsKO mice, although these differences did not reach statistical significance. Although we believe it is likely that impaired SOCS3 expression is involved in the improved leptin sensitivity in VMHGsKO mice, other mechanisms are also likely to be involved. Overall, our results provide additional evidence that the Gsα/cAMP signaling pathway is required for preserving leptin sensitivity under condition of excess nutrients in the VMH.
We also studied mice with either maternal or paternal heterozygous Gsα mutation in SF1 neurons to see whether the parent-of-origin-specific metabolic phenotype resulting from maternal Gsα mutations in the CNS is due to Gsα imprinting in the VMH. Consistent with a lack of an effect on energy balance in homozygous VMHGsKO mice, no metabolic abnormalities were found in either mVMHGsKO or pVMHGsKO heterozygous mice, and in situ hybridization studies confirmed that Gsα is not imprinted in the VMH. Therefore, the parent-of-origin-specific metabolic effects associated with Gsα mutations in mice (4), as well as Albright hereditary osteodystrophy patients, is not related to Gsα defects in the VMH. We showed previously that maternal Gsα mutation in Sim1 neurons of the paraventricular nucleus of the hypothalamus leads to a minimal metabolic phenotype (6). Thus, the critical brain site(s) responsible for the obesity and insulin resistance associated with maternal Gsα mutations remain to be determined.
Acknowledgments
We thank Oksana Gavrilova for scientific input, and Shalini Jain, Yinyan Ma, Tatyana Chanturiya, and Hui Sun for technical assistance (all from the National Institute of Diabetes and Digestive and Kidney Diseases, National Institutes of Health).
Present address for A.B.: Albert Einstein College of Medicine, New York, New York 10461.
Present address for A.K.: US Agency for International Development, Washington, DC 20004.
Present address for C.Y.: Stanford University School of Medicine, Palo Alto, California 94305.
Present address for T.H.: University of Virginia School of Medicine, Charlottesville, Virginia 22908.
This work was supported by the Intramural Research Program of the National Institute of Diabetes and Digestive and Kidney Diseases, National Institutes of Health (Bethesda, Maryland).
Disclosure Summary: The authors have nothing to disclose.
Footnotes
- AMPK
- AMP kinase
- BDNF
- brain-derived neurotrophic factor
- CNS
- central nervous system
- Epac
- exchange protein directly activated by cAMP
- HFD
- high-fat diet
- MC4R
- melanocortin 4 receptor
- RD
- regular chow diet
- SF1
- steroidogenic factor 1
- SOCS3
- suppressor of cytokine signaling 3
- STAT
- signal transducer and activator of transcription
- VMH
- ventromedial nucleus of the hypothalamus.
References
- 1. Chen M, Nemechek NM, Mema E, Wang J, Weinstein LS. Effects of deficiency of the G protein Gsα on energy and glucose homeostasis. Eur J Pharmacol. 2011;660:119–124. [DOI] [PMC free article] [PubMed] [Google Scholar]
- 2. Long DN, McGuire S, Levine MA, Weinstein LS, Germain-Lee EL. Body mass index differences in pseudohypoparathyroidism type 1a versus pseudopseudohypoparathyroidism may implicate paternal imprinting of Gαs in the development of human obesity. J Clin Endocrinol Metab. 2007;92:1073–1079. [DOI] [PubMed] [Google Scholar]
- 3. Muniyappa R, Warren MA, Zhao X, et al. Reduced insulin sensitivity in adults with pseudohypoparathyroidism type 1a. J Clin Endocrinol Metab. 2013;98:E1796–E1801. [DOI] [PMC free article] [PubMed] [Google Scholar]
- 4. Chen M, Wang J, Dickerson KE, et al. Central nervous system imprinting of the G protein Gsα and its role in metabolic regulation. Cell Metab. 2009;9:548–555. [DOI] [PMC free article] [PubMed] [Google Scholar]
- 5. Chen M, Gavrilova O, Liu J, et al. Alternative Gnas gene products have opposite effects on glucose and lipid metabolism. Proc Natl Acad Sci USA. 2005;102:7386–7391. [DOI] [PMC free article] [PubMed] [Google Scholar]
- 6. Chen M, Berger A, Kablan A, Zhang J, Gavrilova O, Weinstein LS. Gsα deficiency in the paraventricular nucleus of the hypothalamus partially contributes to obesity associated with Gsα mutations. Endocrinology. 2012;153:4256–4265. [DOI] [PMC free article] [PubMed] [Google Scholar]
- 7. King BM. The rise, fall, and resurrection of the ventromedial hypothalamus in the regulation of feeding behavior and body weight. Physiol Behav. 2006;87:221–244. [DOI] [PubMed] [Google Scholar]
- 8. Majdic G, Young M, Gomez-Sanchez E, et al. Knockout mice lacking steroidogenic factor 1 are a novel genetic model of hypothalamic obesity. Endocrinology. 2002;143:607–614. [DOI] [PubMed] [Google Scholar]
- 9. Rios M, Fan G, Fekete C, et al. Conditional deletion of brain-derived neurotrophic factor in the postnatal brain leads to obesity and hyperactivity. Mol Endocrinol. 2001;15:1748–1757. [DOI] [PubMed] [Google Scholar]
- 10. Unger TJ, Calderon GA, Bradley LC, Sena-Esteves M, Rios M. Selective deletion of Bdnf in the ventromedial and dorsomedial hypothalamus of adult mice results in hyperphagic behavior and obesity. J Neurosci. 2007;27:14265–14274. [DOI] [PMC free article] [PubMed] [Google Scholar]
- 11. Xu B, Goulding EH, Zang K, et al. Brain-derived neurotrophic factor regulates energy balance downstream of melanocortin-4 receptor. Nat Neurosci. 2003;6:736–742. [DOI] [PMC free article] [PubMed] [Google Scholar]
- 12. Mountjoy KG, Mortrud MT, Low MJ, Simerly RB, Cone RD. Localization of the melanocortin-4 receptor (MC4-R) in neuroendocrine and autonomic control circuits in the brain. Mol Endocrinol. 1994;8:1298–1308. [DOI] [PubMed] [Google Scholar]
- 13. Kishi T, Aschkenasi CJ, Lee CE, Mountjoy KG, Saper CB, Elmquist JK. Expression of melanocortin 4 receptor mRNA in the central nervous system of the rat. J Compar Neurol. 2003;457:213–235. [DOI] [PubMed] [Google Scholar]
- 14. Mercer JG, Hoggard N, Williams LM, Lawrence CB, Hannah LT, Trayhurn P. Localization of leptin receptor mRNA and the long form splice variant (Ob-Rb) in mouse hypothalamus and adjacent brain regions by in situ hybridization. FEBS Lett. 1996;387:113–116. [DOI] [PubMed] [Google Scholar]
- 15. Elmquist JK, Ahima RS, Maratos-Flier E, Flier JS, Saper CB. Leptin activates neurons in ventrobasal hypothalamus and brainstem. Endocrinology. 1997;138:839–842. [DOI] [PubMed] [Google Scholar]
- 16. Dhillon H, Zigman JM, Ye C, et al. Leptin directly activates SF1 neurons in the VMH, and this action by leptin is required for normal body-weight homeostasis. Neuron. 2006;49:191–203. [DOI] [PubMed] [Google Scholar]
- 17. Bingham NC, Anderson KK, Reuter AL, Stallings NR, Parker KL. Selective loss of leptin receptors in the ventromedial hypothalamic nucleus results in increased adiposity and a metabolic syndrome. Endocrinology. 2008;149:2138–2148. [DOI] [PMC free article] [PubMed] [Google Scholar]
- 18. Kim KW, Zhao L, Donato J, Jr, et al. Steroidogenic factor 1 directs programs regulating diet-induced thermogenesis and leptin action in the ventral medial hypothalamic nucleus. Proc Natl Acad Sci USA. 2011;108:10673–10678. [DOI] [PMC free article] [PubMed] [Google Scholar]
- 19. Fukuda M, Williams KW, Gautron L, Elmquist JK. Induction of leptin resistance by activation of cAMP-Epac signaling. Cell Metab. 2011;13:331–339. [DOI] [PMC free article] [PubMed] [Google Scholar]
- 20. Yan J, Mei FC, Cheng H, et al. Enhanced leptin sensitivity, reduced adiposity, and improved glucose homeostasis in mice lacking exchange protein directly activated by cyclic AMP isoform 1. Mol Cell Biol. 2013;33:918–926. [DOI] [PMC free article] [PubMed] [Google Scholar]
- 21. Fasshauer M, Klein J, Lossner U, Paschke R. Isoproterenol is a positive regulator of the suppressor of cytokine signaling-3 gene expression in 3T3-L1 adipocytes. J Endocrinol. 2002;175:727–733. [DOI] [PubMed] [Google Scholar]
- 22. Yarwood SJ, Borland G, Sands WA, Palmer TM. Identification of CCAAT/enhancer-binding proteins as exchange protein activated by cAMP-activated transcription factors that mediate the induction of the SOCS-3 gene. J Biol Chem. 2008;283:6843–6853. [DOI] [PubMed] [Google Scholar]
- 23. Zhang R, Dhillon H, Yin H, et al. Selective inactivation of Socs3 in SF1 neurons improves glucose homeostasis without affecting body weight. Endocrinology. 2008;149:5654–5661. [DOI] [PMC free article] [PubMed] [Google Scholar]
- 24. Chen M, Gavrilova O, Zhao WQ, et al. Increased glucose tolerance and reduced adiposity in the absence of fasting hypoglycemia in mice with liver-specific Gsα deficiency. J Clin Invest. 2005;115:3217–3227. [DOI] [PMC free article] [PubMed] [Google Scholar]
- 25. Ikeda Y, Luo X, Abbud R, Nilson JH, Parker KL. The nuclear receptor steroidogenic factor 1 is essential for the formation of the ventromedial hypothalamic nucleus. Mol Endocrinol. 1995;9:478–486. [DOI] [PubMed] [Google Scholar]
- 26. Shinoda K, Lei H, Yoshii H, et al. Developmental defects of the ventromedial hypothalamic nucleus and pituitary gonadotroph in the Ftz-F1 disrupted mice. Dev Dyn. 1995;204:22–29. [DOI] [PubMed] [Google Scholar]
- 27. McCrimmon RJ, Fan X, Ding Y, Zhu W, Jacob RJ, Sherwin RS. Potential role for AMP-activated protein kinase in hypoglycemia sensing in the ventromedial hypothalamus. Diabetes. 2004;53:1953–1958. [DOI] [PubMed] [Google Scholar]
- 28. McCrimmon RJ, Shaw M, Fan X, et al. Key role for AMP-activated protein kinase in the ventromedial hypothalamus in regulating counterregulatory hormone responses to acute hypoglycemia. Diabetes. 2008;57:444–450. [DOI] [PubMed] [Google Scholar]
- 29. Zhao AZ, Huan JN, Gupta S, Pal R, Sahu A. A phosphatidylinositol 3-kinase phosphodiesterase 3B-cyclic AMP pathway in hypothalamic action of leptin on feeding. Nat Neurosci. 2002;5:727–728. [DOI] [PubMed] [Google Scholar]
- 30. Beiroa D, Imbernon M, Gallego R, et al. GLP-1 agonism stimulates brown adipose tissue thermogenesis and browning through hypothalamic AMPK. Diabetes. 2014;63:3346–3358. [DOI] [PubMed] [Google Scholar]
- 31. Lopez M, Varela V, Vasquez MJ, et al. Hypothalamic AMPK and fatty acid metabolism mediate thyroid regulation of energy balance. Nat Med. 2010;16:1001–1008. [DOI] [PMC free article] [PubMed] [Google Scholar]
- 32. López M, Lage R, Saha AK, et al. Hypothalamic fatty acid metabolism mediates the orexigenic action of ghrelin. Cell Metab. 2008;7:389–399. [DOI] [PubMed] [Google Scholar]


