

Abstract
Type 2 diabetes (T2D) is generally thought to result from the combination of 2 metabolic defects, insulin resistance, which increases the level of insulin required to maintain glucose within the normal range, and failure of insulin-secreting pancreatic β-cells to compensate for the increased demand. We build on a mathematical model pioneered by Topp and colleagues to elucidate how compensation succeeds or fails. Their model added a layer of slow negative feedback to the classic insulin-glucose loop in the form of a slow, glucose-dependent birth and death law governing β-cell mass. We add to that model regulation of 2 aspects of β-cell function on intermediate time scales. The model quantifies the relative contributions of insulin action and insulin secretion defects to T2D and explains why prevention is easier than cure. The latter is a consequence of a threshold separating the normoglycemic and diabetic states (bistability), which also underlies the success of bariatric surgery and acute caloric restriction in rapidly reversing T2D. The threshold concept gives new insight into “Starling's Law of the Pancreas,” whereby insulin secretion is higher for prediabetics and early diabetics than for normal individuals.
Plasma glucose is normally maintained within narrow ranges by a classic negative feedback system. Glucose rises after meals, stimulating secretion of insulin by pancreatic β-cells, which brings glucose back to baseline over several hours by promoting its storage as glycogen and its use as a fuel. However, when the system is chronically challenged by excess nutrients, resulting in obesity, homeostasis can be impaired by insulin resistance, requiring more insulin to achieve the same results. Most insulin-resistant individuals are able to maintain normoglycemia by increasing insulin secretion. Those who are unable to raise insulin levels adequately progress to type 2 diabetes (T2D).
The above scenario, that T2D results from the failure of insulin secretion to compensate for insulin resistance, is widely accepted and may be termed “the standard model.” However, it has come under criticism for 2 main reasons. First, cross-sectional studies of progression to diabetes have shown that during prediabetes and early diabetes plasma insulin concentrations are higher than normal, but glucose is normal or near normal. The onset of diabetes is associated with falling insulin rather than low insulin. These observations have been codified as “Starling's Law of the Pancreas,” which postulates that insulin is an inverted U-shaped function of glucose: as glucose rises over years, insulin first rises to supernormal levels, then falls, marking the onset of T2D. Insulin can remain elevated for years before finally falling below normal (1). Because glucose does not increase much during the prediabetic phase when insulin levels rise dramatically, it is natural to suppose that high insulin causes high glucose rather than the reverse. It has been suggested that hypersecretion is the primary defect, causing insulin resistance or β-cell failure (2–4).
Second, even if one accepts that insulin resistance is the cause of hyperglycemia: it is not clear how β-cells can compensate for insulin resistance in the absence of a signal from increased glucose (5, 6).
We address these questions with a mathematical model and show that the standard model is consistent with the observation that hyperinsulinemia precedes hyperglycemia. The model accounts in detail for the onset of diabetes in a classical animal model, the Zucker diabetic fatty (ZDF) rat, which follows the Starling Law. From this case study we extract general principles that can be applied, with quantitative modifications, to humans.
Our model is an update of the pioneering model of Topp et al (7). They proposed that when the normal daily insulin-glucose feedback system is unable to maintain normal glucose levels, such as when it is hindered by insulin resistance, a second slower level of negative feedback comes into play to increase β-cell mass. If mass does not expand adequately or rapidly enough, however, glucose may rise to a tipping point at which glucotoxicity causes mass to contract rather than expand. Negative feedback then gives way to positive feedback, accelerating the progression of diabetes.
We examine whether compensation involves enhanced β-cell function (secretion per cell) as well as increased β-cell mass (number of cells). This is problematic because most studies only measure insulin, which depends on both mass and function and is not easily dissociated into its components. We take advantage of a coherent longitudinal dataset from ZDF rats in which independent measurements of plasma insulin and mass were made and used to infer function (8).
We also address the signal for compensation, showing that if insulin resistance develops slowly, glucose need not rise detectably to provide a signal. Further, we incorporate new data (9), suggesting that, rather than glucose per se, the signal for β-cell replication is β-cell workload (secretion rate per cell). We investigate whether homeostatic regulation of workload leads to homeostatic regulation of β-cell mass, function, and glucose.
All of the above features of the model are explained concisely by a threshold separating normoglycemic and hyperglycemic states. This indicates that the model framework is not sensitive to the quantitative assumptions. We demonstrate the power of this unifying framework by explaining why prevention of diabetes is much easier than cure and why bariatric surgery is more effective than ordinary diets.
Materials and Methods
The model equations were solved using the free software package XPPAUT (10). XPPAUT was also used to create bifurcation diagrams, summaries of how the system behavior depends quantitatively and qualitatively on parameters. Equations and parameter values are described in the Supplemental Materials along with computer code for simulating the models.
Model parameters were determined by fitting output by eye to data from female ZDF rats (8). To simulate humans, adjustments were made to account for their greater β-cell mass and slower progression of insulin resistance and diabetes. Default parameters are listed in Supplemental Tables 1–4, and modifications for particular figures are given in the legends.
Results
Verbal and pictorial summary of model
Here, we describe the model qualitatively; the equations are contained in the Supplemental Materials.
The model of Topp et al (7), our starting point, and its successors (11, 12), have 2 components. The first component governs the rapid meal-to-meal response of insulin to glucose and consequent glucose disappearance (Eqs. 1 and 2). When glucose rises, insulin secretion responds through a sigmoidal dose-response curve (DRC) (Figure 1A). More subtle aspects of insulin secretion that depend on the rate and duration of the glucose rise were neglected for simplicity, and we follow suit here.
Figure 1.
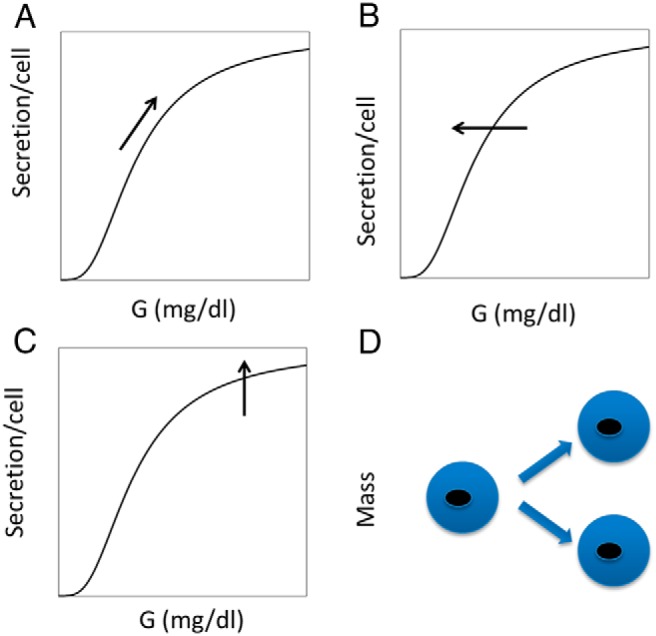
Proposed hierarchy of β-cell responses to hyperglycemia. A, During normal postprandial rises in glucose, insulin secretion increases according to the glucose DRC. B, Persistent increases in glucose over hours to days trigger a left shift in the DRC, for example by reducing the number of KATP channels in the plasma membrane. This raises cytosolic calcium and mainly increases secretion at low glucose. C, Chronic increases in glucose increase maximal secretory response by increasing hormonal (eg, GLP-1) or metabolic amplification pathways. This increases the efficacy of calcium in triggering exocytosis of insulin granules and mainly increases secretion at high glucose. D, Ultimately, chronic hyperglycemia increases β-cell mass by stimulating proliferation. When successful, this reduces the workload of the individual β-cells and restores calcium and M to normal.
The second component describes the slow compensation of the insulin-glucose system when insulin sensitivity (SI) or some other parameter is changed. The response consists of an increase in β-cell mass by replication, driven by persistently elevated glucose, which is a signal that the fast response system is not adequate (Figure 1D; Eq. 4).
The data in Ref. 8 show that mass expansion, even in rodents, is insufficient to account for the observed rise in insulin concentrations. We therefore extend the model of Topp et al (7) by making β-cell function dynamic in 2 distinct ways. First, we assume that persistent high glucose shifts the glucose DRC to the left, analogous to reducing the half-maximal concentration (Km) of an enzymatic reaction (Figure 1B). One way to achieve such a left shift, corresponding to an increase in the variable γ (Eq. 5), is a reduction in the number of ATP-sensitive K+ (KATP) channels in the plasma membrane of the β-cell. Although calcium is not included explicitly in the model, this would result in increased cytosolic calcium, and hence increased insulin secretion, at a given level of glucose. β-Cells can adjust K(ATP) trafficking and calcium levels rapidly, as demonstrated in the experimental companion paper (47), which shows that isolated pancreatic islets in vitro exhibit such changes after overnight culture in high glucose. Increased glucose sensitivity in response to prolonged high glucose could also result from up-regulation of glucokinase (13) as well as altered expression or activity of many other factors. We neglect these in this debut of the model to keep it simple and focus on key principles rather than aim for completeness.
The second way we increase function in the model is to increase the maximum rate of insulin secretion, analogous to increasing the maximum rate (Vmax) of an enzymatic reaction (Figure 1C) and corresponding to the variable σ (Eq. 6). Although increasing γ mainly increases insulin secretion at low glucose, σ mainly increases secretion when glucose is high enough to close most of the KATP channels. It thus resembles the potentiation of glucose-induced secretion by metabolic amplification (14) or elevation of cAMP (15) by the incretins glucagon-like peptide-1 (GLP-1) and glucose-dependent insulinotropic polypeptide (16). These mechanisms all increase the effectiveness of calcium to stimulate exocytosis rather than increasing calcium concentration. Our fits to the ZDF rat data suggest that σ is slower than γ but faster than β. The 4 response mechanisms in Figure 1 are thus ordered by their timescales.
In the model of Topp et al (7), increased β-cell replication is driven directly by glucose. Normally, glucose increases insulin secretion indirectly by increasing β-cell metabolic rate (M), which closes KATP channels and raises calcium. Porat et al (9), however, dissociated these 2 effects, finding that increasing M with a glucokinase activator (GKA) did not increase proliferation if KATP channel closure was prevented by either the channel opener diazoxide or channel mutations. This indicates that a calcium rise and/or insulin secretion is required to stimulate proliferation. In fact, although GKA could amplify the effect of KATP closure, GKA alone, in the absence of a calcium rise or secretion, decreased proliferation. Apoptosis was not measured in that study, but Kassem et al (17) found that a GKA-activating mutation increased both proliferation and apoptosis. The data are complex, but most of the results can be accounted for by 2 simple assumptions. First, proliferation is driven mainly by increased insulin secretion rate (ISR) (Eq. 3), as cells seek to avoid excessive workload. Second, apoptosis is driven mainly by increased β-cell M (Figure 2; Eq. 7). We suggest that normal postprandial increases in insulin raise both ISR and M in parallel, leaving mass unchanged. However, persistent increases in glucose from, for example, reduced SI, would either tilt the balance in favor of ISR and promote proliferation to compensate, or favor increased M, leading to decompensation (see Supplemental Figures 1–3).
Figure 2.
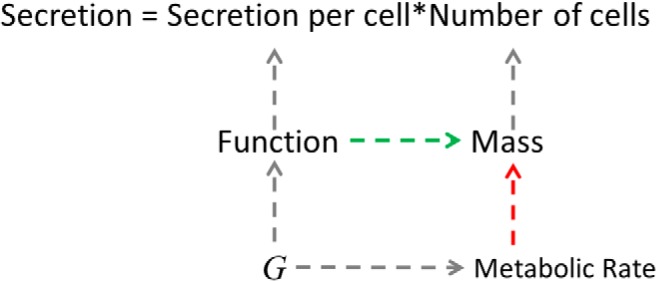
How hyperglycemia increases β-cell mass. Secretion is the product of secretion per cell (function or workload) and the number of cells (mass). Although in the model of Topp et al (7), glucose (G) directly increases mass, we propose, following Ref. 9, that elevated glucose increases mass indirectly by increasing function, which stimulates proliferation. We propose further that elevated glucose increases the M of the β-cells, which increases the rate of apoptosis. The balance of the 2 effects of glucose determines whether mass increases or decreases.
Compensation and failure
Figure 3 simulates the compensation to a step increase in insulin resistance. We use parameters appropriate for rat, and the events accordingly unfold rapidly. The shift in the glucose DRC, γ, is treated as a dynamic variable, but for now, the maximal rate of secretion, σ, is kept fixed to isolate the effect of γ. At time 0, SI, is stepped down 50%, resulting in a 20% increase in glucose (G) (Figure 3A, green curve). In response, γ increases within a day (Figure 3, lower left), and this left shift in the DRC restores G almost to normal before the end of day 6 and completely to normal by day 30 (data not shown). However, the system is not in its normal state, because ISR is elevated. This provides the drive for β-cell proliferation (Eq. 4′). Over several weeks mass increases (Figure 3C), which increases insulin (I) (not shown) but reduces ISR (Figure 3D). As β stands up, γ stands down, and after 2 weeks, γ is restored to normal (Figure 3B).
Figure 3.
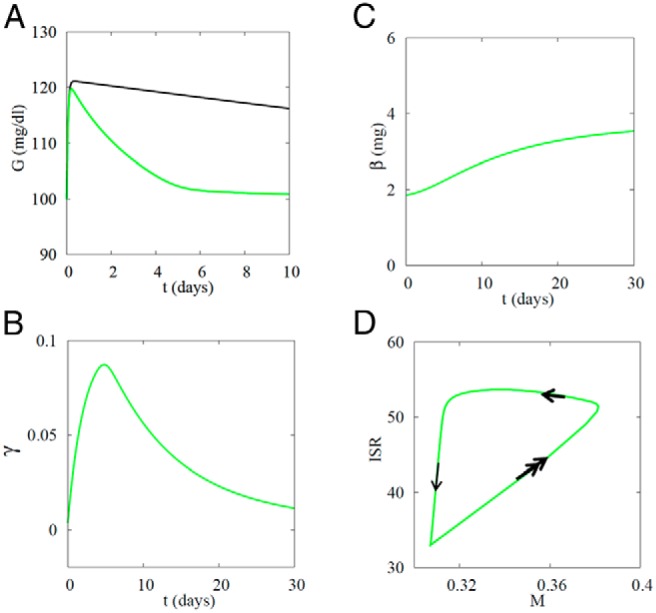
Successful β-cell compensation prevents diabetes when SI decreases from 0.8 to 0.4 mL/(μU d). A, Glucose rises rapidly when SI is decreased but recovers over a week as the glucose DRC shifts left (γ increases). Black curve, slower recovery of G when γ is fixed at the basal level (0). B, γ Increases, corresponding to a left shift of the glucose DRC, then recovers as β increases. C, β rises slowly to a new steady state. D, Trajectory in β-cell M-insulin secretion rate or workload (M–ISR) plane. Double arrows, fast motion along glucose DRC raises M and ISR in parallel; single thick arrow, intermediate speed, corresponding to rise of γ, lowers M; thin arrow, slow, corresponding to rise of β, lowers ISR. Amax = 5.5.
This process is shown from another point of view in Figure 3D, where we have plotted ISR vs M. The system begins at the lower left with low ISR and low M. The fastest response (Figure 3D, double arrows) is to increase ISR and M in parallel in response to the increase in G; the cells follow their DRCs as after a meal. However, increasing I according to the DRC is not sufficient to restore G to normal because SI was reduced. This evokes the next line of defense, the increase in γ, which reduces M while keeping ISR high, a left motion in the M–ISR plane (Figure 3D, single thick arrow). Finally, on the slowest time scale, mass increases (Figure 3D, single thin arrow), which restores ISR to basal. On a per cell basis, this returns the system to its starting point, but at the whole-body level mass β and I are increased. ISR averaged over the first week increases by about 62%, about 10 times the increase in glucose (∼6%). Thus, not only is ISR an effective way to regulate β-cell mass, as postulated in Ref. 9, but it amplifies the changes in glucose, increasing the sensitivity of the response to hyperglycemia by an order of magnitude.
If γ were not dynamic but constant, as in Ref. 7, G would still decrease (Figure 3A, black curve) because mass would still increase, but the transient change in G would be much larger, and it would take weeks, not days, to return G to baseline (data not shown).
In contrast, Figure 4 shows failure of compensation for insulin resistance when the reduction in SI is larger. As in Figure 3, the β-cells respond by traveling up the DRC and then, when the high glucose persists, shift the DRC to the left (increased γ). However, because the insulin resistance is more severe, this fails to restore G to a normal level, so γ stays high. Although ISR is increased, as in Figure 3, M also increases, and the net effect is a decline in mass. Thus, the larger drop in SI results in positive feedback rather than negative feedback, and G and ISR climb irreversibly as mass shrinks catastrophically. The trajectory in the M–ISR plane (Figure 4D) moves up and to the right and never returns to the initial healthy state.
Figure 4.
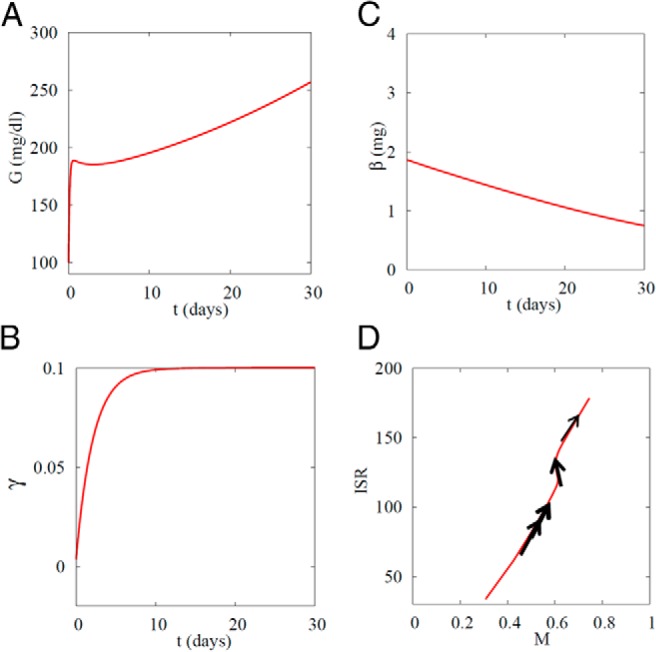
Failure of β-cell compensation results in diabetes when SI is decreased from 0.8 to 0.1 mL/(μU d). A, Glucose rises rapidly when SI is decreased and, after partial recovery, rises slowly. B, Glucose DRC shifts left (γ increases) and cannot recover because glucose remains elevated. C, β-Cell mass β slowly decays. D, Trajectory in M–ISR plane. In contrast to Figure 2, workload (ISR) never recovers. Double arrows, fast motion along glucose DRC raises M and ISR in parallel; single thick arrow, intermediate speed, corresponding to rise of γ; thin arrow, slow, corresponding to fall of β. Amax = 5.5.
Figures 3 and 4 show that small decreases in SI can be compensated, but larger ones cannot. This is because large decreases in SI raise G above a threshold where glucotoxicity-induced apoptosis exceeds increased proliferation. Figure 5 extends this by showing the interaction between the susceptibility to apoptosis, represented by the parameter Amax in Eq. 10, and how far SI, must fall to cause diabetes. The upward-sloping dark line indicates that the threshold level of SI for developing diabetes increases with the tendency for β-cell apoptosis. That is, individuals with high SI can tolerate all but the highest degree of apoptosis propensity. Equivalently, in individuals with low apoptosis propensity, SI must fall to a low level to trigger diabetes. Alternatively, increasing the capacity to proliferate (Pmax; Eq. 9) would be protective and make the threshold slant down to the right rather than up to the left.
Figure 5.
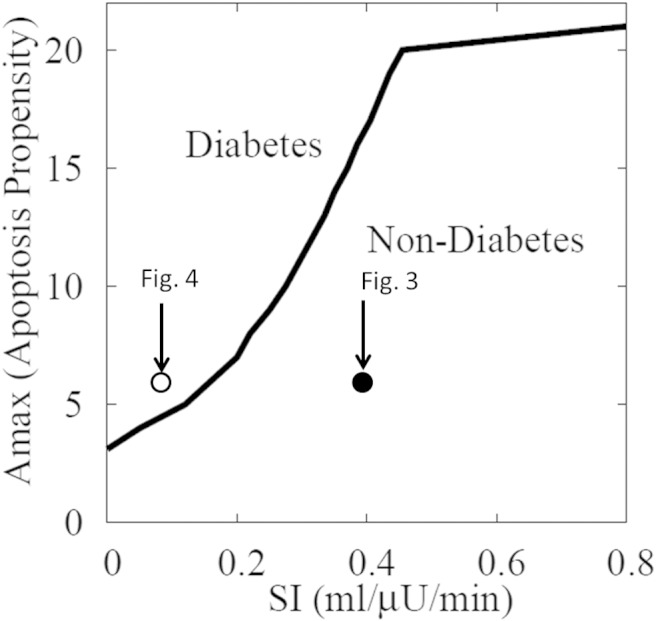
Summary of simulations for instantaneous drops of SI to various levels, like those in Figure 3 (SI dropped from 0.8 to 0.4 mL/[μU min], open circle) and Figure 4 (SI dropped from 0.8 to 0.1 mL/[μU min], closed circle), for various levels of propensity to apoptosis (Amax; Eq. 10). Diabetes is defined as average daily glucose above 125 mg/dL. The larger Amax is, the easier it is to progress to diabetes by reducing SI; conversely, the lower SI is, the lower Amax must be for compensation to be successful.
Case study: the ZDF rat
In Figures 3–5, we assumed for simplicity that SI changed instantaneously, but in reality it changes gradually, as in the data from female ZDF rats (8) we model next. For convenience, the key figures in that paper are assembled in Supplemental Figure 5. The rats did not become diabetic unless fed a high-fat diet (HFD). SI, estimated from the measured G and I using Eq. 1, dropped with age in both the low-fat diet (LFD) and HFD groups but more deeply and rapidly during HFD. As expected from the model, β-cell mass increased, and in fact, initially increased more in HFD than LFD before declining. Mass did not decline until the animals were already very hyperglycemic, and at the end of the experiment mass was about the same in the LFD and HFD rats even though the glucose levels were very different (10mM vs 30mM). Another feature that requires explanation is that the insulin levels rose earlier and more rapidly than mass (especially in HFD) and also fell earlier and more rapidly. A possible resolution was suggested in Ref. 8 by estimating β-cell function. This was done by substituting the measured G, I, and β values and the derived SI values into Eqs. 1–3 and solving for σ. We assume those measurements represent mainly σ in our model, although they could include effects that we ascribe to γ. The data show that in the HFD animals σ increased before mass in response to elevated G but then fell, and suggest that this triggered the diabetes and the fall of mass.
Our model can simulate all the above features provided σ is made the fifth and final dynamic variable in the model (Eq. 6), as shown in Figure 6. Although many characteristics of the HFD rats could have differed from those of the LFD rats, we hypothesized for simplicity that the different outcomes could be explained solely by different rates of fall of SI (Figure 6A). The LFD rats (green curves) look much like the example of successful compensation in Figure 2, except that the changes in Figure 6 are slower. As G rises, γ increases (left shift of the DRC) (Figure 6B) and then recovers as β increases (Figure 6F). σ increases only modestly (Figure 6C). The net effect is an increase in insulin (Figure 6E) that is adequate to maintain normal G (Figure 6D).
Figure 6.

Simulation of female ZDF rats on LFD (green) and HFD (red). The only difference between the 2 cases is the rate at which SI falls (Eq. 17). In the LF case, β-cell mass grows rapidly enough to compensate for the mild rate of drop in SI (S0 = 0.23 mL/[μU d], τSI = 16.2 d). In the HF case, the drop in SI is too deep and rapid (S0 = 0.022 mL/[μU d], τsI = 5.1 d) to be compensated by the combined effects of increased mass and function, resulting in diabetes. Compare with data in Supplemental Figure 5, taken from Ref. 8 (Figures 2–4). Note that their G values, which are nonfasted, are about twice ours, which are daily average values and dominated by the fasting levels. Their parameter for β-cell function (βsc) corresponds to a combination of our σ and γ. Amax = 3.1.
For the HFD rats (red curves in Figure 6), G increases more than for the LFD rats because of the more rapid fall of SI. Initially the increase in glucose is modest but then it becomes rapid, in agreement with the data (Supplemental Figure 5). γ increases more than for the LFD rats and, more important, never recovers, because the increases in σ and β, although large, are insufficient to bring G back down. The rise in insulin is much greater than for LFD but is nonetheless insufficient to prevent diabetes. In agreement with the experiments, the increase in I is also larger and faster than the increase in β and peaks earlier. The increase in I results mainly from increased σ and γ, with β contributing later and less because it is slower.
Note that in the simulation G keeps rising even after SI stabilizes, as in the experimental data (8). This rise is due to progressive declines in σ, and eventually mass, that are independent of SI after the initial sharp drop carries the system over the threshold.
Preventing and reversing diabetes in humans
Next, we consider the effects of interventions to alter the course of diabetes in humans. The model has been “humanized” by increasing volume of distribution 500-fold compared with rats, which increases islet mass in the same proportion. In addition mass dynamics were made 200-fold slower to fit data from human cadavers (18), and function (σ) was made 23-fold slower. (The results are not sensitive to these choices for the time scales, as long as they are at least an order of magnitude slower than in rodents and mass is much slower than function.)
Figure 7 shows the effects of increasing SI at 3 different time points: prediabetes (black curves), early diabetes (green curves), and late diabetes (red curves). If SI is raised early and rapidly enough after the onset of diabetes (Figure 7A), normal glucose is restored (Figure 7D, green curve). The system crosses back below threshold, as indicated by the fact that G starts to fall and σ starts to rise. The glucose DRC remains left-shifted (γ remains positive) (Figure 7B), but it eventually normalizes if the simulation is continued (not shown). In contrast, if the intervention is too late (eg, 46 mo) (Figure 7A, red curve), G continues to rise after a brief decline (Figure 7D, red curve). Note that I decreases both when the intervention successfully reverses diabetes (Figure 7E, green curve) and when it fails (Figure 7E, red curve), but for 2 distinct reasons. In the successful intervention, I decreases because G decreases and high I is no longer needed. In the unsuccessful interventions, I continues to decrease even after G starts to rise again because function and mass fail (σ and β decrease) (Figure 7, C and F). The most interesting case, however, is the black curves: if SI is stabilized early enough during prediabetes, progression is halted. As long as the system remains below threshold, it is not necessary to restore SI to normal, just to prevent it from decreasing further. Once threshold is crossed, recovery requires an increase in SI to return the system below threshold.
Figure 7.

Simulation of intensive lifestyle intervention, assumed to improve SI, to prevent or reverse diabetes. If SI is increased early enough (green) after onset of diabetes (125 mg/dL average daily glucose, dashed line in D), normoglycemia is restored. If the SI increase is too late (red), only transient improvement is achieved before relapse. If intervention begins before diabetes threshold is crossed (black), SI need only be stabilized, not increased. Rodent parameters have been humanized by increasing volume of distribution 500-fold and slowing the response of β and σ 200- and 23.3-fold, respectively.
These simulations offer an explanation for the findings that a program of weight loss and exercise, which by design was moderate and gradual to make it sustainable, was effective at preventing (19) but not reversing diabetes (20). They also help explain why it is difficult to reverse diabetes of longer duration (21). The study in Ref. 19 also considered metformin as a prevention treatment. Metformin likely acts mainly on hepatic glucose production rather than peripheral insulin resistance, but the results in the model are similar. If applied early enough it can be effective for prevention, but it cannot reverse established T2D.
Bariatric surgery, in contrast, can produce lasting reversal of diabetes on a mass scale (22), albeit not in all subjects and with a tendency towards relapse (23). Acute caloric restriction has been reported to have similar efficacy (24) and to rapidly normalize hepatic glucose production (25). In both interventions, the improvement occurs almost immediately, long before weight loss.
The mechanism underlying the metabolic benefits of bariatric surgery is currently unknown and hotly debated, but guided by data (26, 27) showing that hepatic glucose production is rapidly reduced (within the first week) after Roux-en-Y gastric bypass (RYGB), we assume a rapid reduction of the term R0 in Eq. 1. Another study (28) showed a rapid normalization of fasting plasma glucose and insulin after RYGB, further evidence of reduced hepatic glucose production.
That study also showed a trend toward partially improved β-cell function in the first week after surgery. The improved function may be at least partly due to GLP-1, which was also increased during the first week (28). Putting these pieces together, we simulate in Figure 8 the effects of RYGB as a lowering of R0 (Eq. 1) and an increase in σ. We did not alter SI, which also showed a trend toward partial improvement (28), but that would only improve the result.
Figure 8.

Simulation of reversal of advanced diabetes by bariatric surgery. At t = 37 months, hepatic glucose production (R0) is decreased from 864 to 340 mg/(dL d), and function (σ) is stepped up from 300 to 400, rapidly reversing the hyperglycemia. As a consequence, insulin levels are normalized, and the patient is pushed below threshold, which allows function to slowly recover further. Mass also recovers slowly once glucose goes below threshold. SI is held fixed at 0.18 mL/(μU d) but would further contribute if allowed to recover even partially. Dashed line in D, 125 mg/dL.
In contrast to Figure 7, where slow improvement in σ was a consequence of lowered glucose, in Figure 8, we assume that the surgery directly and rapidly improved β-cell function (in Figure 8, step increase at arrow in C). Consequently, even late intervention (>30 mo) is able to restore normoglycemia. As in the successful reversal of T2D in Figure 7, I falls because of the drop in G. In contrast to the hypothesis that diabetes is reversed because I is reduced (3), the model suggests that I is reduced because the diabetes is reversed.
The simulated intervention can fail if it is made too late or G is higher (data not shown), consistent with reports that earlier treatment and less severe hyperglycemia are associated with higher likelihood of success of bariatric surgery (23).
Central role of bistability
We have shown that the model accounts for successful compensation for insulin resistance and failure that results in diabetes, and delineates the conditions for interventions to reverse established diabetes. The model shows further that these features result from the combination of negative feedback (homeostasis) for small perturbations from normal and positive feedback (failure) for large perturbations. Such characteristics are ubiquitous in dynamical systems and lead naturally to a threshold separating 2 coexisting steady states (bistability), here health and disease (29). This is illustrated in Figure 9.
Figure 9.

Schematic of model structure showing coexistence (bistability) of normoglycemic and diabetic states. Decreases in SI tend to push glucose up, and increases in SI tend to push glucose down. Below threshold (nominally 125-mg/dL glucose), the intrinsic dynamics increase I to counteract the effects of decreased SI, whereas above threshold they reduce I and amplify the effects of decreased SI. See Supplemental Figure 4 for a mathematically quantitative version of this diagram.
The threshold, indicated by the dashed blue line, corresponds to 125-mg/dL G, the diagnostic level of diabetes. Below threshold, I increases and G decreases toward normal (downward, straight blue arrow) because of increased mass and/or function. Above threshold, I decreases and G increases toward diabetes (upward, straight blue arrow) because of decreased mass and/or function. The system also defends against hypoglycemia. If G is below normal, mass and/or function decrease to drive G back up.
For an individual with normal G who loses SI due to weight gain, G would rise unless opposed by increased insulin. If the decrease in SI is slow enough for mass and function to compensate, G recovers (blue, upside-down U-shaped arrow in Figure 9). However, if the decrease in SI is too rapid, or mass and function respond sluggishly, G rises in spite of increased I (upward red arrow). Once the threshold is crossed, compensation is overwhelmed by glucotoxicity and secretion decreases, raising G further. The threshold represents the point at which the net effect of mass and function changes on insulin reverses, corresponding to the peak of the Starling curve. Once above this point, typical diet and exercise interventions are ineffective because they cannot overcome the cellular processes driving down mass and function. Analogously, below threshold, increasing G is like trying to go up a down escalator, whereas above threshold, increases in G become easy, because the escalator switches to the up direction. Acute caloric restriction, whether by reduced intake or bariatric surgery (light blue, downward arrow in Figure 9), can overcome this challenge. A more precise and mathematical analysis is given in Supplemental Figure 4.
Discussion
Core model features and predictions
Building upon a previous model of β-cell mass regulation of (7), we have developed a mathematical model for the pathogenesis, prevention and reversal of T2D. The model is based on the “standard model” whereby T2D develops in response to insulin resistance unless prevented by increased β-cell mass and function (objections to this view are discussed briefly below). We revised the mass regulation component in Ref. 7 by making β-cell proliferation responsive to secretory workload (secretion per unit mass) rather than directly to glucose, in line with (9). The toxic effect of glucose on β-cell mass has been incorporated as an apoptosis rate that increases with β-cell M. Under normal conditions, postprandial increases in glucose are assumed to increase both proliferation and apoptosis, increasing β-cell turnover but maintaining mass constant (Figure 2). When those signals become persistently unbalanced, as in insulin resistance, mass either increases to restore normal workload (negative feedback) or fails to respond adequately, leading to T2D (positive feedback). We have shown that the homeostatic regulation of workload based on these principles naturally leads to regulation of both glucose and β-cell mass. Moreover, workload is a more sensitive signal than glucose because the dynamic range of ISR (Figure 3) is larger. This is a natural feature of the G–I system, which allows I to vary much more than G.
In addition, we have incorporated 2 forms of functional compensation, both more rapid than mass. The faster form of the 2 is a left shift in the glucose DRC (increased γ; analogous to decreased Km in enzyme kinetics), which could be achieved by reducing β-cell KATP channel trafficking to the plasma membrane, thereby up-regulating calcium-dependent triggering of insulin secretion (14). The second, slower response is an increased maximum rate of insulin secretion (σ, analogous to Vmax in enzyme kinetics), corresponding to the metabolic (14) and hormonal (15) amplification pathways of insulin secretion. The need for function to change dynamically was suggested by a longitudinal study of diabetes progression in ZDF rats (8), which showed that the measured increase of β-cell mass was insufficient to account for increased plasma insulin.
The extended model thus proposes a 4-level hierarchy of responses (Figure 1). Ordinary postprandial rises in glucose are met by traversing the glucose DRC, which increases workload and M. Persistent high postprandial glucose over a period of days shifts the DRC to the left (increased γ), reducing metabolic stress but increasing cytosolic calcium and leaving workload elevated. Chronic high workload over weeks in rodents (months in humans) enhances the amplifying pathways (increased σ). This relieves the stress of high calcium by making calcium more effective in stimulating exocytosis, but leaves workload elevated. Ultimately, mass increases, reducing workload and relieving the stress of chronically high insulin secretion, including endoplasmic reticulum (ER) stress. If the increase in mass is adequate, normal glucose and workload are restored, at the expense of hyperinsulinemia.
The predicted left shift in the DRC has been tested and confirmed experimentally in the companion paper (47). We further predict that the left shift should only be transient when insulin resistance is well compensated, as illustrated in our simulation of ZDF female rats fed a LFD. A persistent left shift, as in our simulation of ZDF rats on HFD, is a marker of failure to increase function (σ) or mass sufficiently to overcome insulin resistance. This is seen in db/db mice (30) and is predicted for other mouse models of diabetes and humans with T2D.
Thus, although decline of σ is a marker of β-cell failure (Figure 6C), decline of γ likely indicates a successful hand-off of responsibility for compensation to σ. This difference stems from our assumption that σ is subject to glucotoxicity (Supplemental Figure 2), but γ is not. This remains to be tested experimentally.
Preexisting, genetic defects in γ do play in important role in T2D pathogenesis. Gain of function mutations in KATP channels are prominent risk factors in genome wide association studies. Model simulations (not shown) confirm that mild gain of function mutations lead to T2D in the presence of moderate insulin resistance.
The 2 function variables in the model, γ and σ, correspond approximately to the 2 major classes of insulin secretagogues, KATP channel blockers and incretin mimetics, respectively. Supplemental Figure 6 illustrates how they affect the glucose DRC. Supplemental Figure 6A shows that increasing glucose sensitivity shifts the curve to the left and has its biggest relative effect at low glucose (ie, fasting glucose), whereas increasing maximum capacity has its biggest effect at high glucose (ie, postprandial glucose).
Supplemental Figure 6B shows another important difference between the 2 therapeutic targets. If a KATP blocker is applied after σ has already substantially declined, or if it is applied early but does not control G sufficiently to prevent σ from declining, then it becomes ineffective. This veto power of σ over γ is one possible cause of sulfonylurea failure. Another possibility is that β-cells do not lose secretory capacity but simply stop responding to the drug, either because calcium no longer rises sufficiently or because the exocytotic response to calcium is down-regulated. A study with implanted glibenclamide pellets suggests this type of failure, because secretion recovered after 24-hour drug washout (31).
Objections to the standard model
The assumption that increased β-cell workload drives compensation for insulin resistance by both mass and function helps answer a key objection to the standard model, namely, that there is no obvious rise in G to stimulate compensation. By amplifying the glucose signal, workload allows the response to be sensitive to small changes in glucose.
A further response to this objection is provided by the simulation of the progression to T2D in ZDF rats (Figure 6). When the decline in SI is slow, as in the natural history of T2D, the response of mass and function can buffer it successfully, continuously correcting for miniscule deviations in glucose.
It may nonetheless be the case that hyperinsulinemia begets further insulin resistance, as proposed in Refs. 2–4. Work in progress suggests that a secondary, frictional effect of hyperinsulinemia to induce insulin resistance (32) can be added to the model without changing the result that T2D arises from failure of compensation. For another model and point of view see Ref. 33.
The centrality of threshold
The response to insulin resistance is ultimately all-or-none, it is either compensated or leads to diabetes. The system is very good at buffering against small changes in SI, but when it fails, it fails catastrophically, producing a rapid and inexorable rise in glucose. According to the Starling Law, diabetes commences when insulin starts to decrease, not when the level of insulin falls below normal. This is evident in the ZDF rat data (Supplemental Figure 5) and in our ZDF simulations (Figure 6). Moreover, the period of most rapid rise of G coincides with the peak of I, indicative of a threshold crossing. Over time, the clinical definition of T2D has been adjusted empirically based on the potential for future complications (34), but, interestingly, it now essentially coincides with the peak of the Starling curve and thus to crossing the threshold. Further evidence for a threshold is provided by longitudinal data showing that glucose rises very slowly for years before suddenly rising rapidly in both humans (35) and monkeys (36).
The model shows further that the degree of insulin resistance that results in crossing the threshold depends on the ability of the β-cells to respond (Figure 5). The less susceptible the β-cells are to apoptosis, the greater the loss of SI that can be tolerated. Figure 5 thus includes 2 distinct pathways to T2D, one primarily involving insulin resistance (Figure 5, lower left part of diabetes region) and the other primarily involving defective insulin secretion (Figure 5, upper right part of diabetes region), but suggests these are extreme cases of a continuum. If one defect is greater, less is required of the other to cause T2D. Figure 5 also implies that mild β-cell insufficiency can be a silent preexisting genetic trait that is only unmasked when insulin resistance arises.
The threshold explains why prevention of diabetes is much easier than reversal. Before an individual crosses threshold, the G–I system exerts negative feedback and tends to restore normal glucose. At this stage it is sufficient to halt the decline of SI by diet and exercise, which allows the system to heal itself over time (Figure 7). After crossing threshold, however, the dynamics switch to positive feedback, which reduces β and σ and drives glucose even higher. More drastic interventions are then required to return below threshold. The only ways currently known to achieve this are bariatric surgery and acute caloric restriction.
The model predicts that the threshold arises from bistability between normoglycemic and diabetic states (Figure 9 and Supplemental Figure 4). Direct evidence for bistability is provided by the bimodal outcome of partial pancreatectomy in rats (37, 38). We suggest that small differences in either the fraction of pancreas removed or innate ability to expand β-cell mass were amplified into well-separated normal and diabetic outcomes.
The rapid reversal of diabetes after bariatric surgery and acute caloric restriction also strongly suggests coexisting healthy and diseased states. Although we had to make assumptions about mechanism to simulate the metabolic consequences of bariatric surgery (Figure 8), the specific assumptions are not critical. The model merely requires 1 or more parameters (hepatic glucose production, SI, β-cell mass or function, insulin clearance, or insulin-independent glucose uptake) to change rapidly and sufficiently to drive the system back below threshold. The model also predicts that if bariatric surgery were reversed, diabetes would not return, provided the individual did not regain weight. This could be tested in rodents, whose dietary intake can be controlled.
β-Cell mass in humans and rodents
We initially parametrized the model to account for data from ZDF rats (8), but found that simply increasing the volume of distribution and making β-cell mass and the component of function represented by σ much slower was sufficient to simulate human diabetes (Figures 7 and 8). The model suggests that function plays a bigger role than mass in rodents and even more so in humans, because it responds more rapidly.
It has been argued that β-cell proliferation is virtually nonexistent in adult humans because it is difficult to find markers of proliferation in islets from human cadavers (39, 40). However, mass was increased 30%–60% in pancreases from obese nondiabetic humans and decreased 30% in pancreases from diabetic humans (40–42). It is beyond the scope of this article to reconcile these findings, but we note that insulin resistance develops much more slowly in humans. Therefore, a much slower rate of replication is sufficient to produce the observed increases in mass, which are an order of magnitude smaller than in rodents. Also, β-cell mass may increase not by replication, but by transdifferentiation of α-cells (43, 44), or there may be dormant β-cells that do not secrete until needed (45, 46). Thus, β-cell mass may not increase but functional β-cell mass may do so. The model can work equally well with that assumption.
Further progress will require new experimental data. The dependence of proliferation and apoptosis on ISR and M in the model, although guided by experiment, is of a rudimentary, phenomenological nature because we lack quantitative data to constrain the auxiliary functions. New data are needed in particular to separate the effects of increased calcium and insulin secretion and to assess the possible roles of ER stress and reactive oxygen species. Further research on the long-term regulation of β-cell function is critical, as this is likely to play a more important role in humans than mass. Finally, the field has been hampered by the need to rely on pancreases from cadavers because there is no noninvasive, longitudinal way to measure β-cell mass or function. We hope the model will provide incentive to develop such methods and give guidance on interpreting the data they produce.
Acknowledgments
We thank Richard Bertram for careful reading of the manuscript and numerous poster attendees for helpful comments.
This work was supported by the Intramural Research Program of the National Institutes of Health (National Institute of Diabetes and Kidney Diseases) (A.S.S. and J.H.). L.S.S. was supported by the National Institute of Diabetes and Digestive and Kidney Diseases Grant RO1DK46409.
Disclosure Summary: The authors have nothing to disclose.
For related article see page 611
- DRC
- dose-response curve
- G
- glucose
- GKA
- glucokinase activator
- GLP-1
- glucagon-like peptide-1
- HFD
- high-fat diet
- I
- insulin
- ISR
- insulin secretion rate
- KATP
- ATP-sensitive K+
- LFD
- low-fat diet
- M
- metabolic rate
- RYGB
- Roux-en-Y gastric bypass
- SI
- insulin sensitivity
- T2D
- type 2 diabetes
- ZDF
- Zucker diabetic fatty.
References
- 1. DeFronzo RA. Lilly lecture 1987. The triumvirate: β-cell, muscle, liver. A collusion responsible for NIDDM. Diabetes. 1988;37(6):667–687. [DOI] [PubMed] [Google Scholar]
- 2. Hansen BC, Bodkin NL. β-Cell hyperresponsiveness: earliest event in development of diabetes in monkeys. Am J Physiol. 1990;259(3 pt 2):R612–R617. [DOI] [PubMed] [Google Scholar]
- 3. Pories WJ, Dohm GL. Diabetes: have we got it all wrong? Hyperinsulinism as the culprit: surgery provides the evidence. Diabetes Care. 2012;35(12):2438–2442. [DOI] [PMC free article] [PubMed] [Google Scholar]
- 4. Shanik MH, Xu Y, Skrha J, Dankner R, Zick Y, Roth J. Insulin resistance and hyperinsulinemia: is hyperinsulinemia the cart or the horse? Diabetes Care. 2008;31(suppl 2):S262–S268. [DOI] [PubMed] [Google Scholar]
- 5. Stumvoll M, Tataranni PA, Bogardus C. The hyperbolic law–a 25-year perspective. Diabetologia. 2005;48(2):207–209. [DOI] [PubMed] [Google Scholar]
- 6. McGarry JD. What if Minkowski had been ageusic? An alternative angle on diabetes. Science. 1992;258(5083):766–770. [DOI] [PubMed] [Google Scholar]
- 7. Topp B, Promislow K, deVries G, Miura RM, Finegood DT. A model of β-cell mass, insulin, and glucose kinetics: pathways to diabetes. J Theor Biol. 2000;206(4):605–619. [DOI] [PubMed] [Google Scholar]
- 8. Topp BG, Atkinson LL, Finegood DT. Dynamics of insulin sensitivity, β-cell function, and β-cell mass during the development of diabetes in fa/fa rats. Am J Physiol Endocrinol Metab. 2007;293(6):E1730–E1735. [DOI] [PubMed] [Google Scholar]
- 9. Porat S, Weinberg-Corem N, Tornovsky-Babaey S, et al. Control of pancreatic β cell regeneration by glucose metabolism. Cell Metab. 2011;13(4):440–449. [DOI] [PMC free article] [PubMed] [Google Scholar]
- 10. Ermentrout B. Simulating, Analyzing, and Animating Dynamical Systems. Philadelphia, PA: SIAM; 2002. Available at: http://www.math.pitt.edu/∼bard/xpp/xpp.html. [Google Scholar]
- 11. De Gaetano A, Hardy T, Beck B, et al. Mathematical models of diabetes progression. Am J Physiol Endocrinol Metab. 2008;295(6):E1462–E1479. [DOI] [PubMed] [Google Scholar]
- 12. Wang YF, Khan M, van den Berg HA. Interaction of fast and slow dynamics in endocrine control systems with an application to β-cell dynamics. Math Biosci. 2012;235(1):8–18. [DOI] [PubMed] [Google Scholar]
- 13. Chen C, Hosokawa H, Bumbalo LM, Leahy JL. Mechanism of compensatory hyperinsulinemia in normoglycemic insulin-resistant spontaneously hypertensive rats. Augmented enzymatic activity of glucokinase in β-cells. J Clin Invest. 1994;94(1):399–404. [DOI] [PMC free article] [PubMed] [Google Scholar]
- 14. Henquin JC. Triggering and amplifying pathways of regulation of insulin secretion by glucose. Diabetes. 2000;49(11):1751–1760. [DOI] [PubMed] [Google Scholar]
- 15. Braun M, Ramracheya R, Johnson PR, Rorsman P. Exocytotic properties of human pancreatic β-cells. Ann NY Acad Sci. 2009;1152:187–193. [DOI] [PubMed] [Google Scholar]
- 16. Baggio LL, Drucker DJ. Biology of incretins: GLP-1 and GIP. Gastroenterology. 2007;132(6):2131–2157. [DOI] [PubMed] [Google Scholar]
- 17. Kassem S, Bhandari S, Rodríguez-Bada P, et al. Large islets, β-cell proliferation, and a glucokinase mutation. N Engl J Med. 2010;362(14):1348–1350. [DOI] [PubMed] [Google Scholar]
- 18. Meier JJ, Butler AE, Saisho Y, et al. β-Cell replication is the primary mechanism subserving the postnatal expansion of β-cell mass in humans. Diabetes. 2008;57(6):1584–1594. [DOI] [PMC free article] [PubMed] [Google Scholar]
- 19. Knowler WC, Barrett-Connor E, Fowler SE, et al. Reduction in the incidence of type 2 diabetes with lifestyle intervention or metformin. N Engl J Med. 2002;346(6):393–403. [DOI] [PMC free article] [PubMed] [Google Scholar]
- 20. Gregg EW, Chen H, Wagenknecht LE, et al. Association of an intensive lifestyle intervention with remission of type 2 diabetes. JAMA. 2012;308(23):2489–2496. [DOI] [PMC free article] [PubMed] [Google Scholar]
- 21. Karter AJ, Nundy S, Parker MM, Moffet HH, Huang ES. Incidence of remission in adults with type 2 diabetes: the diabetes, aging study. Diabetes Care. 2014:37(12):3188–3195. [DOI] [PMC free article] [PubMed] [Google Scholar]
- 22. Buchwald H, Estok R, Fahrbach K, et al. Weight and type 2 diabetes after bariatric surgery: systematic review and meta-analysis. Am J Med. 2009;122(3):248–256.e5. [DOI] [PubMed] [Google Scholar]
- 23. Arterburn DE, Bogart A, Sherwood NE, et al. A multisite study of long-term remission and relapse of type 2 diabetes mellitus following gastric bypass. Obes Surg. 2013;23(1):93–102. [DOI] [PMC free article] [PubMed] [Google Scholar]
- 24. Jackness C, Karmally W, Febres G, et al. Very low-calorie diet mimics the early beneficial effect of Roux-en-Y gastric bypass on insulin sensitivity and β-cell function in type 2 diabetic patients. Diabetes. 2013;62(9):3027–3032. [DOI] [PMC free article] [PubMed] [Google Scholar]
- 25. Lim EL, Hollingsworth KG, Aribisala BS, Chen MJ, Mathers JC, Taylor R. Reversal of type 2 diabetes: normalisation of β cell function in association with decreased pancreas and liver triacylglycerol. Diabetologia. 2011;54(10):2506–2514. [DOI] [PMC free article] [PubMed] [Google Scholar]
- 26. Bojsen-Møller KN, Dirksen C, Jørgensen NB, et al. Early enhancements of hepatic and later of peripheral insulin sensitivity combined with increased postprandial insulin secretion contribute to improved glycemic control after Roux-en-Y gastric bypass. Diabetes. 2014;63(5):1725–1737. [DOI] [PubMed] [Google Scholar]
- 27. de Weijer BA, Aarts E, Janssen IMC, et al. Hepatic and peripheral insulin sensitivity do not improve 2 weeks after bariatric surgery. Obes (Silver Spring). 2013;21(6):1143–1147. [DOI] [PubMed] [Google Scholar]
- 28. Reed MA, Pories WJ, Chapman W, et al. Roux-en-Y gastric bypass corrects hyperinsulinemia implications for the remission of type 2 diabetes. J Clin Endocrinol Metab. 2011;96(8):2525–2531. [DOI] [PubMed] [Google Scholar]
- 29. Tyson JJ, Chen KC, Novak B. Sniffers, buzzers, toggles and blinkers: dynamics of regulatory and signaling pathways in the cell. Curr Opin Cell Biol. 2003;15(2):221–231. [DOI] [PubMed] [Google Scholar]
- 30. Dula SB, Jecmenica M, Wu R, et al. Evidence that low-grade systemic inflammation can induce islet dysfunction as measured by impaired calcium handling. Cell Calcium. 2010;48(2–3):133–142. [DOI] [PMC free article] [PubMed] [Google Scholar]
- 31. Remedi MS, Nichols CG. Chronic antidiabetic sulfonylureas in vivo: reversible effects on mouse pancreatic β-cells. PLoS Med. 2008;5(10):e206. [DOI] [PMC free article] [PubMed] [Google Scholar]
- 32. Satin LS, Butler PC, Ha J, Sherman AS. Pulsatile insulin secretion, impaired glucose tolerance and type 2 diabetes. Mol Aspects Med. 2015;42:61–77. [DOI] [PMC free article] [PubMed] [Google Scholar]
- 33. Goel P. Insulin resistance or hypersecretion? The βIG picture revisited. J Theor Biol. 2015;384:131–139. [DOI] [PubMed] [Google Scholar]
- 34. Expert Committee on the Diagnosis and Classification of Diabetes Mellitus. Report of the expert committee on the diagnosis and classification of diabetes mellitus. Diabetes Care. 1997;20(7):1183–1197. [DOI] [PubMed] [Google Scholar]
- 35. Mason CC, Hanson RL, Knowler WC. Progression to type 2 diabetes characterized by moderate then rapid glucose increases. Diabetes. 2007;56(8):2054–2061. [DOI] [PubMed] [Google Scholar]
- 36. Bodkin NL, Metzger BL, Hansen BC. Hepatic glucose production and insulin sensitivity preceding diabetes in monkeys. Am J Physiol. 1989;256(5 pt 1):E676–E681. [DOI] [PubMed] [Google Scholar]
- 37. Laybutt DR, Glandt M, Xu G, et al. Critical reduction in β-cell mass results in two distinct outcomes over time. Adaptation with impaired glucose tolerance or decompensated diabetes. J Biol Chem. 2003;278(5):2997–3005. [DOI] [PubMed] [Google Scholar]
- 38. Weir GC, Bonner-Weir S. Five stages of evolving β-cell dysfunction during progression to diabetes. Diabetes. 2004;53(suppl 3):S16–S21. [DOI] [PubMed] [Google Scholar]
- 39. Cnop M, Hughes SJ, Igoillo-Esteve M, et al. The long lifespan and low turnover of human islet β cells estimated by mathematical modelling of lipofuscin accumulation. Diabetologia. 2010;53(2):321–330. [DOI] [PubMed] [Google Scholar]
- 40. Saisho Y, Butler AE, Manesso E, Elashoff D, Rizza RA, Butler PC. β-Cell mass and turnover in humans: effects of obesity and aging. Diabetes Care. 2013;36(1):111–117. [DOI] [PMC free article] [PubMed] [Google Scholar]
- 41. Rahier J, Guiot Y, Goebbels RM, Sempoux C, Henquin JC. Pancreatic β-cell mass in European subjects with type 2 diabetes. Diabetes Obes Metab. 2008;10(suppl 4):32–42. [DOI] [PubMed] [Google Scholar]
- 42. Butler AE, Janson J, Bonner-Weir S, Ritzel R, Rizza RA, Butler PC. β-Cell deficit and increased β-cell apoptosis in humans with type 2 diabetes. Diabetes. 2003;52(1):102–110. [DOI] [PubMed] [Google Scholar]
- 43. Talchai C, Xuan S, Lin HV, Sussel L, Accili D. Pancreatic β cell dedifferentiation as a mechanism of diabetic β cell failure. Cell. 2012;150(6):1223–1234. [DOI] [PMC free article] [PubMed] [Google Scholar]
- 44. Wang Z, York NW, Nichols CG, Remedi MS. Pancreatic β cell dedifferentiation in diabetes and redifferentiation following insulin therapy. Cell Metab. 2014;19(5):872–882. [DOI] [PMC free article] [PubMed] [Google Scholar]
- 45. Weir GC, Bonner-Weir S. Sleeping islets and the relationship between β-cell mass and function. Diabetes. 2011;60(8):2018–2019. [DOI] [PMC free article] [PubMed] [Google Scholar]
- 46. Olsson R, Carlsson PO. A low-oxygenated subpopulation of pancreatic islets constitutes a functional reserve of endocrine cells. Diabetes. 2011;60(8):2068–2075. [DOI] [PMC free article] [PubMed] [Google Scholar]
- 47. Glynn E, Thompson B, Vadrevu S, et al. Chronic glucose exposure systematically shifts the oscillatory threshold of mouse islets: experimental evidence for an early intrinsic mechanism of compensation for hyperglycemia. Endocrinology. 2016;157(2):611–623. [DOI] [PMC free article] [PubMed] [Google Scholar]