

Abstract
Background: Circulating amino acids, such as branched-chain amino acids (BCAAs) and aromatic amino acids (AAAs), have been associated with diabetes risk; however, little is known about how a long-term dietary intervention for weight loss affects circulating amino acids.
Objectives: We examined the effects of weight-loss diets on long-term changes in plasma amino acids and the associations of these changes with weight loss and the improvement of insulin resistance.
Design: We repeatedly measured plasma amino acid profiles over 2 y in overweight or obese participants from 2 randomized, dietary intervention, weight-loss trials [774 subjects from the POUNDS LOST (Preventing Overweight Using Novel Dietary Strategies Trial) and 318 subjects from the DIRECT (Dietary Intervention Randomized Controlled Trial)].
Results: Intervention diets consistently lowered most of the amino acid concentrations, including BCAAs and AAAs, in both trials. In the POUNDS LOST, average-protein diets (15% of daily energy) showed stronger effects than did high-protein diets (25% of daily energy) on reducing concentrations of the diabetes-associated BCAA valine at 6 mo independent of the weight change. In both trials, weight loss was directly related to the concurrent reduction of the BCAAs leucine and isoleucine, the AAAs tyrosine and phenylalanine, and 4 other amino acids. For example, per kilogram of weight loss, there was a 0.04-SD decrease in log tyrosine (∼0.6 μmol/L) in both trials. In addition, we showed that reductions in alanine and the AAA tyrosine were significantly related to improved insulin resistance (measured with the use of the homeostasis model assessment of insulin resistance), independent of weight loss, in both trials (both P < 0.05). For example, per 1-SD decrease in log tyrosine (∼17 μmol/L), there was a 0.04-SD (∼3%) improvement in insulin resistance in the POUNDS LOST and a 0.13-SD (∼8%) improvement in insulin resistance in the DIRECT.
Conclusion: Our findings underscore the potential importance of dietary interventions in improving amino acid profiles (i.e., reducing diabetes risk–enhancing amino acid concentrations) along with and beyond weight loss. The POUNDS LOST and the DIRECT were registered at clinicaltrials.gov as NCT00072995 and NCT00160108, respectively.
Keywords: dietary intervention, insulin resistance, plasma amino acids, weight loss, metabolomics
INTRODUCTION
The growing prevalence of obesity substantially contributes to the ongoing epidemic of type 2 diabetes and cardiovascular disease (1, 2). Various weight-loss interventions [e.g. modifications of diet and lifestyle (3, 4)] have shown a marked effectiveness in reducing body weight and improving metabolic risk factors although the underlying mechanisms are not well known.
Recently, metabolomic studies that used advanced metabolite-profiling technology have led to the discovery of novel metabolites that are implicated in the development of metabolic disorders (5–8). Across a number of studies, metabolites such as branched-chain amino acids (BCAAs)11 and aromatic amino acids (AAAs) have been consistently associated with risks of obesity, insulin resistance, and type 2 diabetes (9–12). Compelling evidence has also shown that circulating amino acid profiles might be affected by dietary factors and weight change (13–15). To our knowledge, no study has comprehensively examined how long-term weight-loss dietary interventions change circulating amino acids, and no study has assessed whether and how such changes are related to metabolic improvements in randomized clinical trials.
In the current study, we evaluated 2-y changes in plasma amino acid concentrations in response to weight-loss diet interventions and examined the relation of these changes with weight loss as well as with the improvement of insulin resistance in participants from the following 2 independent randomized dietary intervention trials: the POUNDS LOST (Preventing Overweight Using Novel Dietary Strategies Trial) and the DIRECT (Dietary Intervention Randomized Controlled Trial).
METHODS
Study design and population
The POUNDS LOST was a randomized dietary intervention trial that compared the effects on body weight of energy-reduced diets that differed in compositions of fat, protein, and carbohydrates. The trial was conducted at the Harvard T.H. Chan School of Public Health and Brigham and Women’s Hospital, Boston, Massachusetts, and the Pennington Biomedical Research Center for the Louisiana State University System, Baton Rouge, Louisiana, from 2004 through 2007. The study design, methods, and primary results have been described in detail elsewhere (4). In brief, 811 overweight or obese adults [mean ± SD age: 51 ± 9 y; women: 64%; white: 79%; BMI (in kg/m2): 33 ± 4] were randomly assigned to one of 4 diets with targeted percentages of energy derived from fat, protein, and carbohydrates. In the 4 respective diets, percentages of energy from fat, protein, and carbohydrates were 20%, 15%, and 65%, respectively; 20%, 25%, and 55%, respectively; 40%, 15%, and 45%, respectively; and 40%, 25%, and 35%, respectively. After 2 y of intervention, 645 participants (80%) completed the trial. In the current study, we included 774 participants from the baseline visit, 643 from the 6-mo visit, and 526 from the 2-y visit who had amino acid measurements on the basis of the availability of blood samples.
We tested findings from the POUNDS LOST by attempting to replicate results in the DIRECT, which was a workplace dietary intervention trial that took place in Dimona, Israel (3). In brief, 322 overweight or obese subjects (age: 52 ± 7 y; women: 14%; BMI: 31 ± 4) were enrolled at baseline in July 2005 and assigned to one of the 3 following nutritional protocols: a low-fat, restricted-calorie diet; a Mediterranean, restricted-calorie diet; and a low-carbohydrate, nonrestricted-calorie diet. The trial was completed in June 2007. In the current study, we included 211 participants from the baseline visit, 208 participants from the 6-mo visit, and 157 participants from the 2-y visit, again on the basis of the availability of blood samples.
The current study was approved by the local human subjects committees involved. All participants for the POUNDS LOST and the DIRECT provided written informed consent for secondary analyses of collected data; written informed consent for the current study was not required. The POUNDS LOST and the DIRECT were registered at clinicaltrials.gov as NCT00072995 and NCT00160108, respectively.
Measurement of weight and covariates
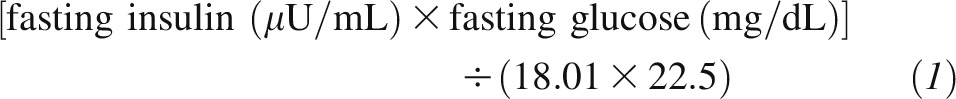
In both trials, body weight and waist circumference were measured in the morning before breakfast at baseline, 6 mo, and 2 y. Fasting blood samples were obtained at baseline, 6 mo, and 2 y. In the POUNDS LOST, analyses of glucose and insulin were performed at the Clinical Laboratory at Pennington with the use of an immunoassay with chemiluminescent detection on the Immulite analyzer (Diagnostic Products Corp.). In the DIRECT, glucose and insulin concentrations were measured with the use of an enzyme immunometric assay (Immulite automated analyzer; Diagnostic Products Corp.) at Leipzig University Laboratories, Leipzig, Germany. Insulin resistance was estimated with the use of the HOMA-IR, which was calculated as follows (16):
 |
Race was self-reported in the POUNDS LOST.
Measurement of amino acids
The profiling of amino acid concentrations was measured in 2011 (all POUNDS LOST samples and 71% of DIRECT samples) and in 2014 (the remainder of DIRECT samples) with the use of fasting plasma that had been stored at −80°C since collection. The samples were analyzed by the Institute of Laboratory Medicine, Clinical Chemistry and Molecular Diagnostics, University Hospital Leipzig, Leipzig, Germany, with the use of electrospray tandem-mass spectrometry. Detailed profiling procedures have been previously published (17, 18). The amino acids leucine and isoleucine were measured as one composite variable indicated as leucine/isoleucine (meaning “leucine and isoleucine”). In total, 25 amino acids (leucine/isoleucine was considered a single amino acid in the current study) were detected and quantified via a corresponding internal standard in both the POUNDS LOST and the DIRECT.
Statistical analysis
We ln-transformed all amino acid and HOMA-IR concentrations to improve the normality of their skewed distributions. The primary outcomes were changes in amino acid concentrations from baseline in both trials. In the POUNDS LOST, we calculated Pearson correlation coefficients to assess the pairwise correlations between baseline amino acid concentrations and between the changes in amino acids during follow-up visits.
We present a schematic of our main analyses in Supplemental Figure 1. As presented by arrow 1 in Supplemental Figure 1, we compared amino acid concentrations at 6 mo and 2 y, respectively, to baseline concentrations with the use of paired t tests. In addition, we evaluated the effects of macronutrients in the POUNDS LOST interventions [high protein compared with average protein (i.e., 25% compared with 15% of daily energy from protein) and high fat compared with low fat (i.e., 40% compared with 20% of daily energy from fat)] on changes in amino acids with the use of an ANCOVA at 6 mo and 2 y, respectively.
To test the association between weight loss and changes in amino acids in response to weight-loss diets (Supplemental Figure 1, arrow 2), we used a generalized estimating equation (GEE) method with an exchangeable correlation structure to integrate the 6-mo and 2-y changes. Covariates in model 1 included age, sex, race (in the POUNDS LOST), dietary group, follow-up time from baseline, and the respective baseline amino acid concentration. Model 2 further included baseline BMI. We sought to replicate the significant findings from the POUNDS LOST in the DIRECT with the use of the same GEE strategies. Additional adjustment for the potential batch effect in measurements of amino acids at 2 time points in the DIRECT did not materially change the results.
A strict Bonferroni correction was applied to adjust for multiple comparisons; P < 0.002 (0.05 ÷ 25) was considered significant in the POUNDS LOST, and P < 0.006 (0.05 ÷ 9 amino acids were shown to be significant in the POUNDS LOST) was considered significant in the DIRECT. In secondary analyses, we used general linear regression models to assess the relations between weight loss and changes in amino acids at 6 mo and 2 y.
Second, we examined the associations between changes in weight loss–related amino acid concentrations and changes in insulin resistance that were measured with the use of the HOMA-IR (Supplemental Figure 1, arrow 3) with the use of the GEE approach. P < 0.05 was considered significant for all secondary analyses. All statistical analyses were performed with SAS v9.4 software (SAS Institute), or R v2.13.0 software (R Foundation).
RESULTS
Baseline characteristics and amino acids
The POUNDS LOST and the DIRECT had the same follow-up periods (2 y) and similar interventions (weight-loss diets). Baseline characteristics of participants in the current analysis were similar to those reported in the original trials (3, 4) (Table 1). In both trials, participants were middle aged, overweight, or obese, and approximately one-third of subjects were hypertensive. POUNDS LOST participants were generally healthy (although 1% of participants had diabetes), whereas a larger proportion of DIRECT participants were affected by diabetes (14%) or coronary heart disease (36%).
TABLE 1.
Baseline characteristics of participants from the POUNDS LOST and DIRECT1
| Characteristic | POUNDS LOST | DIRECT |
| Participants, n | 774 | 318 |
| Age, y | 50.83 ± 9.22 | 51.29 ± 6.4 |
| Women, n (%) | 491 (63) | 44 (14) |
| BMI, kg/m2 | 32.64 ± 3.9 | 30.84 ± 3.5 |
| Waist circumference, cm | ||
| Men | 113.22 ± 10.4 | 104.51 ± 8.7 |
| Women | 97.69 ± 10.9 | 100.00 ± 12.3 |
| Race, n (%) | ||
| White | 612 (79) | 318 (100) |
| Black | 121 (16) | 0 (0) |
| Hispanic | 29 (4) | 0 (0) |
| Other | 12 (2) | 0 (0) |
| Diabetes, n (%) | 10 (1) | 45 (14) |
| Glucose, mg/dL | 91.70 ± 11.8 | 91.35 ± 31.6 |
| Insulin | 10.40 [8.5]3 | 12.57 [8.4] |
| HOMA-IR | 2.31 [2.1] | 2.66 [2.0] |
| HOMA-β | 1.32 [1.0] | 1.95 [2.4] |
| Hypertension, n (%) | 266 (34) | 104 (33) |
| Total cholesterol, mg/dL | 201.69 ± 36.5 | 195.95 ± 37.0 |
| HDL cholesterol, mg/dL | 49.19 ± 14.3 | 54.06 ± 15.7 |
| LDL cholesterol, mg/dL | 125.23 ± 31.9 | 118.88 ± 34.8 |
| Triglycerides | 120.00 [93.00] | 153.23 [84.10] |
| Coronary heart disease, n (%) | 23 (3) | 114 (36) |
DIRECT, Dietary Intervention Randomized Controlled Trial; HOMA-β, homeostatic model assessment of β cell function; POUNDS LOST, the Preventing Overweight Using Novel Dietary Strategies Trial.
Mean ± SD (all such values for continuous variables that had a normal distribution).
Median; IQR in brackets (all such values for continuous variables that had a skewed distribution).
Untransformed plasma concentrations of amino acids in POUNDS LOST participants at baseline and follow-up visits are presented in Supplemental Figure 2. Correlations between baseline plasma concentrations of amino acids in the POUNDS LOST were generally moderate with a mean correlation coefficient of 0.26 (Supplemental Figure 3).
Two-year changes in amino acids in response to weight-loss diets
Overall correlations between changes in amino acids were moderate with the mean pairwise partial Pearson correlation coefficients of 0.29 at both 6 mo and 2 y (Figure 1). In the POUNDS LOST, the plasma concentrations of a majority of amino acids decreased during the 2-y intervention course (Supplemental Figure 4). At 6 mo, concentrations of several BCAAs (leucine/isoleucine and valine), AAAs (tyrosine and phenylalanine), and other amino acids (alanine, proline, glutamic acid, and sarcosine) significantly decreased (P < 0.002). Meanwhile, concentrations of arginine significantly increased (P < 0.002). At 2 y, most of these changes were attenuated although the changes in alanine, valine, phenylalanine, and arginine remained significant (P < 0.002). In the DIRECT, similar changes in concentrations of amino acids were observed although the concentrations of arginine decreased (Supplemental Figure 5).
FIGURE 1.

Heat map of correlations of changes in amino acid concentrations in the Preventing Overweight Using Novel Dietary Strategies Trial. There were 643 participants included in the 6-mo–change analysis (A) and 527 participants in the 2-y–change analysis (B). Axes are lists of amino acids. The color of the square at an intersecting pair of amino acids represents the age-, sex-, and BMI-adjusted pairwise Pearson correlation coefficient between the changes in these amino acid concentrations. At the extremes of the color gradient, which is indicated below the figure, red represents the strongest positive correlation (r = +1) between the changes, and green represents the strongest inverse correlation (r = −1) between the changes; white or no color represents no correlation (r = 0) between the changes. The predominance of red and pink and the absence of green shows that the changes in concentrations of amino acids were generally positively correlated with each other (i.e., as one went up or down, many others changed similarly).
At 6 mo in the POUNDS LOST, we observed that the weight-loss diet arms varying in protein contents (high compared with average as a percentage of energy) showed differential effects on changes in plasma concentrations of BCAAs valine and leucine/isoleucine, the AAA phenylalanine, and the 2 other amino acids methyl-histidine and lysine (Table 2), each of which had a greater decrease in the average-protein diet arms than in the high-protein diet arms (all P < 0.05). The dietary effects were independent of the weight change, and the effects on valine and methyl-histidine remained significant after controlling for multiple testing (P < 0.002). The effects of dietary protein on changes in these amino acids were attenuated to the null at 2 y (Table 2; results of the other amino acids are shown in Supplemental Table 1) potentially because of reduced adherence to the interventions after 6 mo (4). Diets that varied in fat and carbohydrate intakes did not show significant differential effects on changes in plasma amino acids at any time point (P > 0.05, data not shown).
TABLE 2.
Changes in concentrations of amino acids that were significantly different between average- and high-protein intervention arms at the 6-mo visit in the POUNDS LOST (n = 643)1
| 6-mo visit |
24-mo visit |
|||||
| Average protein | High protein | P-difference | Average protein | High protein | P-difference | |
| Methyl-histidine | −0.24 ± 0.09 | 0.04 ± 0.10 | 3.9 × 10⁻⁵ | 0.01 ± 0.12 | 0.13 ± 0.12 | 0.14 |
| Valine | −0.27 ± 0.09 | −0.06 ± 0.09 | 0.002 | −0.33 ± 0.12 | −0.35 ± 0.12 | 0.74 |
| Phenylalanine | −0.16 ± 0.09 | 0.01 ± 0.10 | 0.01 | −0.29 ± 0.11 | −0.24 ± 0.12 | 0.56 |
| Leucine/isoleucine | −0.09 ± 0.09 | 0.05 ± 0.09 | 0.02 | −0.12 ± 0.11 | −0.17 ± 0.11 | 0.53 |
| Lysine | −0.06 ± 0.09 | 0.09 ± 0.09 | 0.02 | −0.11 ± 0.12 | −0.07 ± 0.13 | 0.64 |
All values are least-squares means ± SEs for the SD change in the log-transformed amino acid concentration. Differences were considered significant at P < 0.002, and a trend toward significance was considered at P ≥ 0.002 but <0.05. ANCOVAs were adjusted for age at baseline, sex, race, concurrent weight change, baseline BMI, and respective baseline amino acid concentration. POUNDS LOST, Preventing Overweight Using Novel Dietary Strategies Trial.
Changes in amino acids and weight loss
In the POUNDS LOST, weight loss was significantly related to concurrent changes in 9 amino acids including BCAAs (leucine/isoleucine and valine), AAAs (tyrosine and phenylalanine), and other amino acids (alanine, proline, sarcosine, hydroxyproline, and methionine) over the 2-y intervention (P < 0.002; Supplemental Figure 6). Additional adjustment for baseline BMI in the model did not materially change the associations (Table 3).
TABLE 3.
Significant changes in concentrations of amino acids per concurrent kilogram change in body weight in the POUNDS LOST (n = 774) and the DIRECT (n = 318)1
| GEE2 |
6 mo3 |
2 y3 |
||||
| Amino acid | β ± SE | P | β ± SE | P | β ± SE | P |
| POUNDS LOST | ||||||
| Alanine | 0.04 ± 0.005 | <10−20 | 0.05 ± 0.01 | 6.2 × 10⁻¹⁸ | 0.03 ± 0.01 | 2.0 × 10⁻¹⁰ |
| Tyrosine | 0.04 ± 0.004 | <10−20 | 0.05 ± 0.01 | 8.0 × 10⁻¹⁸ | 0.03 ± 0.01 | 5.8 × 10⁻¹⁰ |
| Proline | 0.02 ± 0.004 | 2.0 × 10⁻⁷ | 0.03 ± 0.01 | 2.9 × 10⁻⁵ | 0.02 ± 0.01 | 2.5 × 10⁻⁵ |
| Leucine/isoleucine | 0.02 ± 0.005 | 5.0 × 10⁻⁷ | 0.03 ± 0.01 | 1.2 × 10⁻⁸ | 0.02 ± 0.01 | 3.8 × 10⁻³ |
| Sarcosine | 0.02 ± 0.005 | 9.8 × 10⁻⁷ | 0.02 ± 0.01 | 5.8 × 10⁻⁴ | 0.03 ± 0.01 | 4.8 × 10⁻⁶ |
| Valine | 0.02 ± 0.005 | 6.2 × 10⁻⁶ | 0.03 ± 0.01 | 3.3 × 10⁻⁶ | 0.01 ± 0.01 | 0.02 |
| Phenylalanine | 0.02 ± 0.005 | 2.3 × 10⁻⁵ | 0.03 ± 0.01 | 6.7 × 10⁻⁷ | 0.01 ± 0.01 | 9.0 × 10⁻³ |
| Hydroxyproline | 0.02 ± 0.004 | 6.1 × 10⁻⁵ | 0.02 ± 0.01 | 4.7 × 10⁻⁵ | 0.01 ± 0.01 | 9.1 × 10⁻³ |
| Methionine | 0.02 ± 0.005 | 3.8 × 10⁻⁴ | 0.01 ± 0.01 | 0.02 | 0.02 ± 0.01 | 7.0 × 10⁻³ |
| DIRECT | ||||||
| Alanine | 0.05 ± 0.010 | 2.4 × 10⁻⁶ | 0.07 ± 0.01 | 7.2 × 10⁻⁶ | 0.02 ± 0.01 | 0.14 |
| Tyrosine | 0.04 ± 0.008 | 7.8 × 10⁻⁸ | 0.05 ± 0.01 | 5.3 × 10⁻⁶ | 0.03 ± 0.01 | 2.5 × 10⁻³ |
| Leucine/isoleucine | 0.04 ± 0.010 | 1.4 × 10⁻⁴ | 0.04 ± 0.01 | 5.5 × 10⁻³ | 0.03 ± 0.01 | 0.02 |
| Sarcosine | 0.05 ± 0.012 | 7.4 × 10⁻⁵ | 0.05 ± 0.01 | 1.1 × 10⁻³ | 0.04 ± 0.01 | 7.8 × 10⁻⁴ |
| Phenylalanine | 0.03 ± 0.008 | 3.7 × 10⁻⁴ | 0.04 ± 0.01 | 2.0 × 10⁻³ | 0.02 ± 0.01 | 0.03 |
| Hydroxyproline | 0.06 ± 0.014 | 7.1 × 10⁻⁵ | 0.07 ± 0.02 | 2.3 × 10⁻³ | 0.02 ± 0.02 | 0.15 |
| Methionine | 0.05 ± 0.010 | 1.9 × 10⁻³ | 0.05 ± 0.01 | 1.4 × 10⁻⁴ | 0.002 ± 0.01 | 0.85 |
β represents the standardized SD change in the log-transformed amino acid concentration per kilogram change in body weight. By way of interpretation, 1 kg of weight loss (independent variable) was associated with a 0.04-SD decrease in the log tyrosine concentration (an ∼0.6-μmol/L decrease in tyrosine in our study population) in both trials. DIRECT, Dietary Intervention Randomized Controlled Trial; GEE, generalized estimating equation; POUNDS LOST, the Preventing Overweight Using Novel Dietary Strategies Trial.
GEE models handled the data at 6 mo and 2 y as repeated measurements and put both measurements in the model at the same time. Covariates include age, sex, dietary group, follow-up time, baseline BMI, and the respective baseline amino acid concentration.
Changes from baseline in amino acid concentrations per kilogram of weight change at 6 mo and 2 y were tested with the use of general linear regression models adjusted as for the GEE analysis.
In the DIRECT, changes in 7 (alanine, tyrosine, leucine/isoleucine, sarcosine, phenylalanine, hydroxyproline, and methionine) of the 9 previously noted amino acids showed significant associations with weight loss (P < 0.006), and the direction of the associations was consistent between the 2 trials (Table 3).
Secondary analyses showed that the associations between weight loss and changes in amino acids were stronger at 6 mo than at 2 y in both trials (Table 3). The attenuation of the associations from 6 mo to 2 y might have been partly due to the adaptation of amino acid metabolism to weight loss or reduced adherence to the weight-loss diets after 6 mo.
Changes in plasma amino acids and insulin resistance
Finally, we examined whether the changes in the 7 weight-loss–related amino acids were related to changes in insulin resistance beyond weight loss. In both the POUNDS LOST and the DIRECT, we showed directionally consistent and significant associations of decreasing alanine and tyrosine with improving HOMA-IR after adjustment for the concurrent weight change (P < 0.05; Figure 2). For example, per 1-SD decrease in log tyrosine (∼17 μmol/L), there was a 0.04-SD (∼3%) improvement in insulin resistance in the POUNDS LOST and a 0.13-SD (∼8%) improvement in insulin resistance in the DIRECT.
FIGURE 2.

Significant associations between changes in weight-loss–related amino acid concentrations and changes in the HOMA-IR. Generalized estimating equations handled the data at 6 mo and 2 y as repeated measurements and put both measurements in the model at the same time. Covariates include age, sex, race (in the POUNDS LOST only), dietary group, baseline BMI, follow-up time, baseline respective amino acid concentration, baseline HOMA-IR, and concurrent weight change. The P value for the association of changes in insulin resistance with changes in alanine was 0.0004 and, with changes in tyrosine, was 0.048 in the POUNDS LOST (n = 774); corresponding P values were 0.011 and 0.030, respectively, in the DIRECT (n = 318). The changes in amino acids and HOMA-IR were in the same direction (i.e., both decreased); therefore, their associations were positive as shown in the figure. DIRECT, Dietary Intervention Randomized Controlled Trial; POUNDS LOST, Preventing Overweight Using Novel Dietary Strategies Trial.
DISCUSSION
In 2 similar randomized dietary trials, we observed that weight-loss diets decreased plasma concentrations of amino acids including type 2 diabetes–associated BCAAs (leucine/isoleucine and valine) and AAAs (tyrosine and phenylalanine). We showed that weight-loss diets with average protein had a greater effect on decreasing concentrations of the BCAA valine than diets with high protein independent of weight loss. In addition, we showed that weight loss was associated with a decrease in the concentrations of 7 amino acids including a BCAA (leucine/isoleucine), AAAs (tyrosine and phenylalanine), and 4 other amino acids (alanine, sarcosine, hydroxyproline, and methionine) consistently in both trials. Moreover, we showed that the AAA tyrosine and the amino acid alanine were associated with an improvement of insulin resistance in both trials independent of weight loss.
Effects of weight-loss diets on reduction of circulating amino acid concentrations
Dietary interventions have been a mainstream effort to promote weight loss (3, 4). Although it remains inconclusive about which weight-loss diets are more effective for weight loss, most intervention diets have shown beneficial effects on reducing metabolic risk. Several lines of evidence indicated a pivotal role of amino acids in the development of obesity and diabetes. For example, Wang et al. (10) reported that blood concentrations of BCAAs and AAAs predicted diabetes risk in healthy normoglycemic individuals in the Framingham Offspring Study; and the individuals in the top quartile of the composite amino acid score of BCAAs and AAAs had 5- to 7-fold higher risk of developing diabetes than did individuals in the lowest quartile. Dietary factors may affect circulating concentrations of amino acids (13–15); e.g., 80% of dietary BCAAs reach the blood (19). In our study, we observed that the concentrations of BCAAs and AAAs significantly decreased in response to the weight-loss diet interventions, and such reductions may benefit diabetes prevention.
Effects of protein composition of weight-loss diets on reductions in circulating amino acid concentrations
In the POUNDS LOST, high-protein and average-protein dietary interventions led to comparable reduction in body weight (4). We showed that average-protein diets had a stronger effect on the reduction of diabetes-associated BCAAs than did high-protein diets. In addition, decreases in plasma concentrations of the BCAA leucine/isoleucine and the AAA phenylalanine also tended to be more evident in the average-protein intervention arms. These effects on changes in amino acids were independent of weight loss because we adjusted for the concurrent weight change in the analyses. Our results indicate that, compared with high-protein diets, average-protein diets might have additional benefits on improvement of amino acid profiles (i.e., reducing BCAAs and AAAs) and, thus, related diabetes risk.
Associations of weight loss with reductions in circulating amino acid concentrations
In both the POUNDS LOST and the DIRECT, we showed that reduction of plasma concentrations of 7 amino acids, including a diabetes-related BCAA (leucine/isoleucine) and AAAs (tyrosine and phenylalanine) were significantly related to weight loss. Our finding suggests that the effects of weight-loss diets on these amino acids are likely mediated through a weight change. In a previous study, a 1-SD increase in log tyrosine was related to 102% higher risk of type 2 diabetes (10). We showed that per kilogram of weight loss there was a related 0.04-SD decrease in log tyrosine (∼0.6-μmol tyrosine/L decrease in in our study population), which roughly accounted for 4% decreased diabetes risk. Our data are consistent with several previous studies in which weight loss induced by gastric bypass surgery led to a reduction of circulating concentrations of BCAAs and AAAs (20, 21). In previous studies, weight loss by short-term, calorie-restricted dietary interventions did not lower these diabetes-associated amino acids in blood (22, 23). Our results indicate that long-term weight-loss diet interventions may be more effective in improving amino acid profiles (i.e., in reducing diabetes risk–enhancing amino acid concentrations).
Associations of reductions in amino acid concentrations with changes in HOMA-IR
We showed that the reduction in plasma concentrations of the AAA tyrosine was significantly related to a decrease in the HOMA-IR in both the POUNDS LOST and the DIRECT. Circulating concentration of tyrosine has been associated with insulin resistance and diabetes risk (10). A recent study showed that tyrosine acts as a metabolic signal in influencing insulin signaling (24). Taken together, these observations suggest that tyrosine may play a causal role in the development of insulin resistance and diabetes. However, the potential mechanisms that underlie the association between reduced concentrations of alanine and an improvement in insulin sensitivity remain unclear. Alanine is a gluconeogenic precursor. Several previous studies have shown that blood concentrations of alanine either did not change (25, 26) or decreased (27, 28) in response to hyperinsulinemia in humans or animal models. However, data are currently lacking regarding the effects of circulating alanine on changes in insulin resistance. Our findings may motivate additional investigations, such as feeding studies and functional experiments, to clarify potentially causal relations between changes in amino acids and changes in insulin resistance.
Strengths and limitations
To our knowledge, the current study is the first one to explore the effect of weight-loss diets on long-term changes in plasma amino acids and the relation of these changes with weight loss and improvement in insulin resistance in 2 diet-intervention trials. The major strengths of our study included the use of 2 large dietary intervention trials with long-term follow-ups and analyses of dynamic changes of plasma amino acids with the use of repeated measures over 2 y of intervention. The consistency of results from 2 independent populations strongly supported the validity and generalizability of our findings. Furthermore, we analyzed changes in metabolites over time, which are more relevant to translation into clinical strategies than are measurements of metabolites at single time point (29). A recent study showed that analyses of concurrent changes in lifestyle factors and metabolic outcomes are more powerful and statistically robust in inferring biological relations between variables than are prevalent lifestyle analyses or lagged changes analyses (30).
Nevertheless, there were several limitations in the current study. First, we used a metabolomics platform that focuses on amino acids only and did not provide a systematic coverage of the breadth of plasma metabolites. In our panel, leucine and isoleucine were measured as one composite variable; therefore, we could not distinguish which one was the driving metabolite, whereas their effects on risk of diabetes (10) and cardiovascular disease (12) might be different. Our focus on amino acids was motivated by the results of previous experimental (31, 32) and metabolomics (7, 9, 10, 33, 34) studies, which suggest that circulating amino acids are closely related to obesity and diabetes risk. Our data complement ongoing efforts to annotate the comprehensive human metabolome by providing clinical implications for the selected amino acid panel. Second, both study populations were middle aged, mainly white, and obese or overweight; an additional validation of our findings in other populations is warranted. Third, because of the limited number of participants with diabetes in our study population, we were unable to explore the effect of diabetes on our overall findings. Finally, several differences between the 2 trials merit mention. Most of the participants in the POUNDS LOST were American whites, whereas all participants in the DIRECT were Israelis; the POUNDS LOST had more women than men, whereas men were the majority in the DIRECT; the POUNDS LOST included overweight and obese but otherwise generally healthy participants by design (although there were 10 participants with diabetes), whereas participants with diabetes and coronary heart disease met the inclusion criteria in the DIRECT. Such differences may partly explain the failure to replicate some of the associations discovered in the POUNDS LOST in the DIRECT. However, the consistent results between these 2 trials, which differed in proportions of sex and race as well as culture, lend robustness to our findings.
In conclusion, our observations from 2 large dietary intervention trials indicate that 1) weight-loss diets may have long-term effects on reductions in circulating concentrations of diabetes-associated amino acids such as BCAAs and AAAs; 2) weight-loss diets with average protein (15% of daily energy) might be more beneficial than are high-protein weight-loss diets (25% of daily energy) in lowering diabetes-related amino acids and subsequent diabetes risk; and 3) the weight loss that results from these interventions is associated with sustained changes of diabetes-associated amino acids. Even beyond the effects of weight loss, a reduction of diabetes-related amino acids may improve insulin resistance.
Acknowledgments
We thank Adela Hruby (Department of Nutrition, Harvard T.H. Chan School of Public Health) for editing and copyediting the manuscript.
The authors’ responsibilities were as follows—YZ: designed the study, analyzed the data, and wrote the manuscript; UC: contributed to the acquisition of the amino acid data and reviewed the manuscript; TH, LL, JR, DHR, GAB, FMS, DS, JT, and IS: discussed, edited, and reviewed the manuscript; LQ: designed the study, reviewed data, contributed to discussion, edited and reviewed the manuscript, and was the guarantor of the work and, as such, had full access to all data in the study and took responsibility for the integrity of the data and the accuracy of the data analysis. None of the authors reported a conflict of interest related to the study.
Footnotes
Abbreviations used: AAA, aromatic amino acid; BCAA, branched-chain amino acid; DIRECT, Dietary Intervention Randomized Controlled Trial; GEE, generalized estimating equation; POUNDS LOST, Preventing Overweight Using Novel Dietary Strategies Trial.
REFERENCES
- 1.Hu FB. Globalization of diabetes: the role of diet, lifestyle, and genes. Diabetes Care 2011;34:1249–57. [DOI] [PMC free article] [PubMed] [Google Scholar]
- 2.Eckel RH, York DA, Rossner S, Hubbard V, Caterson I, St Jeor ST, Hayman LL, Mullis RM, Blair SN. Prevention Conference VII: obesity, a worldwide epidemic related to heart disease and stroke: executive summary. Circulation . 2004;110:2968–75. [DOI] [PubMed] [Google Scholar]
- 3.Shai I, Schwarzfuchs D, Henkin Y, Shahar DR, Witkow S, Greenberg I, Golan R, Fraser D, Bolotin A, Vardi H, et al. Weight loss with a low-carbohydrate, Mediterranean, or low-fat diet. N Engl J Med 2008;359:229–41. [DOI] [PubMed] [Google Scholar]
- 4.Sacks FM, Bray GA, Carey VJ, Smith SR, Ryan DH, Anton SD, McManus K, Champagne CM, Bishop LM, Laranjo N, et al. Comparison of weight-loss diets with different compositions of fat, protein, and carbohydrates. N Engl J Med 2009;360:859–73. [DOI] [PMC free article] [PubMed] [Google Scholar]
- 5.Yu B, Zheng Y, Nettleton JA, Alexander D, Coresh J, Boerwinkle E. Serum Metabolomic profiling and incident CKD among African Americans. Clin J Am Soc Nephrol 2014;9:1410–7. [DOI] [PMC free article] [PubMed] [Google Scholar]
- 6.Zheng Y, Yu B, Alexander D, Mosley TH, Heiss G, Nettleton JA, Boerwinkle E. Metabolomics and incident hypertension among blacks: the atherosclerosis risk in communities study. Hypertension 2013;62:398–403. [DOI] [PMC free article] [PubMed] [Google Scholar]
- 7.Cheng S, Rhee EP, Larson MG, Lewis GD, McCabe EL, Shen D, Palma MJ, Roberts LD, Dejam A, Souza AL, et al. Metabolite profiling identifies pathways associated with metabolic risk in humans. Circulation 2012;125:2222–31. [DOI] [PMC free article] [PubMed] [Google Scholar]
- 8.Zheng Y, Yu B, Alexander D, Manolio TA, Aguilar D, Coresh J, Heiss G, Boerwinkle E, Nettleton JA. Associations between metabolomic compounds and incident heart failure among African Americans: the ARIC Study. Am J Epidemiol 2013;178:534–42. [DOI] [PMC free article] [PubMed] [Google Scholar]
- 9.Newgard CB, An J, Bain JR, Muehlbauer MJ, Stevens RD, Lien LF, Haqq AM, Shah SH, Arlotto M, Slentz CA, et al. A branched-chain amino acid-related metabolic signature that differentiates obese and lean humans and contributes to insulin resistance. Cell Metab 2009;9:311–26. [DOI] [PMC free article] [PubMed] [Google Scholar]
- 10.Wang TJ, Larson MG, Vasan RS, Cheng S, Rhee EP, McCabe E, Lewis GD, Fox CS, Jacques PF, Fernandez C, et al. Metabolite profiles and the risk of developing diabetes. Nat Med 2011;17:448–53. [DOI] [PMC free article] [PubMed] [Google Scholar]
- 11.Newgard CB. Interplay between lipids and branched-chain amino acids in development of insulin resistance. Cell Metab 2012;15:606–14. [DOI] [PMC free article] [PubMed] [Google Scholar]
- 12.Magnusson M, Lewis GD, Ericson U, Orho-Melander M, Hedblad B, Engstrom G, Ostling G, Clish C, Wang TJ, Gerszten RE, et al. A diabetes-predictive amino acid score and future cardiovascular disease. Eur Heart J 2013;34:1982–9. [DOI] [PMC free article] [PubMed] [Google Scholar]
- 13.Metzler-Zebeli BU, Lang IS, Gors S, Brussow KP, Hennig U, Nurnberg G, Rehfeldt C, Otten W, Metges CC. High-protein-low-carbohydrate diet during pregnancy alters maternal plasma amino acid concentration and placental amino acid extraction but not fetal plasma amino acids in pigs. Br J Nutr 2012;108:2176–89. [DOI] [PubMed] [Google Scholar]
- 14.Burke LM, Winter JA, Cameron-Smith D, Enslen M, Farnfield M, Decombaz J. Effect of intake of different dietary protein sources on plasma amino acid profiles at rest and after exercise. Int J Sport Nutr Exerc Metab 2012;22:452–62. [DOI] [PubMed] [Google Scholar]
- 15.Norton JA, Gorschboth CM, Wesley RA, Burt ME, Brennan MF. Fasting plasma amino acid levels in cancer patients. Cancer 1985;56:1181–6. [DOI] [PubMed] [Google Scholar]
- 16.Matthews DR, Hosker JP, Rudenski AS, Naylor BA, Treacher DF, Turner RC. Homeostasis model assessment: insulin resistance and beta-cell function from fasting plasma glucose and insulin concentrations in man. Diabetologia 1985;28:412–9. [DOI] [PubMed] [Google Scholar]
- 17.Brauer R, Leichtle A, Fiedler G, Thiery J, Ceglarek U. Preanalytical standardization of amino acid and acylcarnitine metabolite profiling in human blood using tandem mass spectrometry. Metabolomics 2011;7:344–52. [Google Scholar]
- 18.Ceglarek U, Müller P, Stach B, Buhrdel P, Thiery J, Kiess W. Validation of the phenylalanine/tyrosine ratio determined by tandem mass spectrometry: sensitive newborn screening for phenylketonuria. Clin Chem Lab Med . 2002;40:693–7. [DOI] [PubMed] [Google Scholar]
- 19.Rietman A, Schwarz J, Tome D, Kok FJ, Mensink M. High dietary protein intake, reducing or eliciting insulin resistance? Eur J Clin Nutr 2014;68:973–9. [DOI] [PubMed] [Google Scholar]
- 20.Lips MA, Van Klinken JB, van Harmelen V, Dharuri HK, t Hoen PA, Laros JF, van Ommen GJ, Janssen IM, Van Ramshorst B, Van Wagensveld BA, et al. Roux-en-Y gastric bypass surgery, but not calorie restriction, reduces plasma branched-chain amino acids in obese women independent of weight loss or the presence of type 2 diabetes mellitus. Diabetes Care . 2014;37:3150–6 [DOI] [PubMed] [Google Scholar]
- 21.Laferrère B, Reilly D, Arias S, Swerdlow N, Gorroochurn P, Bawa B, Bose M, Teixeira J, Stevens RD, Wenner BR, et al. Differential metabolic impact of gastric bypass surgery versus dietary intervention in obese diabetic subjects despite identical weight loss. Sci Transl Med 2011;3:80re2. [DOI] [PMC free article] [PubMed] [Google Scholar]
- 22.Vazquez JA, Morse EL, Adibi SA. Effect of dietary fat, carbohydrate, and protein on branched-chain amino acid catabolism during caloric restriction. J Clin Invest 1985;76:737–43. [DOI] [PMC free article] [PubMed] [Google Scholar]
- 23.Felig P, Owen OE, Wahren J, Cahill GF Jr. Amino acid metabolism during prolonged starvation. J Clin Invest 1969;48:584–94. [DOI] [PMC free article] [PubMed] [Google Scholar]
- 24.Ferguson AA, Roy S, Kormanik KN, Kim Y, Dumas KJ, Ritov VB, Matern D, Hu PJ, Fisher AL. TATN-1 mutations reveal a novel role for tyrosine as a metabolic signal that influences developmental decisions and longevity in Caenorhabditis elegans. PLoS Genet 2013;9:e1004020. [DOI] [PMC free article] [PubMed] [Google Scholar]
- 25.Zuniga-Guajardo S, Zinman B. The metabolic response to the euglycemic insulin clamp in type I diabetes and normal humans. Metabolism 1985;34:926–30. [DOI] [PubMed] [Google Scholar]
- 26.Connolly CC, Papa T, Smith MS, Lacy DB, Williams PE, Moore MC. Hepatic and muscle insulin action during late pregnancy in the dog. Am J Physiol Regul Integr Comp Physiol 2007;292:R447–52. [DOI] [PMC free article] [PubMed] [Google Scholar]
- 27.Ramnanan CJ, Edgerton DS, Rivera N, Irimia-Dominguez J, Farmer B, Neal DW, Lautz M, Donahue EP, Meyer CM, Roach PJ, et al. Molecular characterization of insulin-mediated suppression of hepatic glucose production in vivo. Diabetes 2010;59:1302–11. [DOI] [PMC free article] [PubMed] [Google Scholar]
- 28.Rivera N, Ramnanan CJ, An Z, Farmer T, Smith M, Farmer B, Irimia JM, Snead W, Lautz M, Roach PJ, et al. Insulin-induced hypoglycemia increases hepatic sensitivity to glucagon in dogs. J Clin Invest 2010;120:4425–35. [DOI] [PMC free article] [PubMed] [Google Scholar]
- 29.Mozaffarian D, Hao T, Rimm EB, Willett WC, Hu FB. Changes in diet and lifestyle and long-term weight gain in women and men. N Engl J Med 2011;364:2392–404. [DOI] [PMC free article] [PubMed] [Google Scholar]
- 30.Smith JD, Hou T, Hu FB, Rimm EB, Spiegelman D, Willett WC, Mozaffarian D. A comparison of different methods to evaluate diet, physical activity, and long-term weight gain in three prospective cohort studies. J Nutr 2015;145(11):2527–34. [DOI] [PMC free article] [PubMed] [Google Scholar]
- 31.Felig P, Marliss E, Cahill GF Jr. Plasma amino acid levels and insulin secretion in obesity. N Engl J Med 1969;281:811–6. [DOI] [PubMed] [Google Scholar]
- 32.Floyd JC Jr, Fajans SS, Conn JW, Knopf RF, Rull J. Stimulation of insulin secretion by amino acids. J Clin Invest 1966;45:1487–502. [DOI] [PMC free article] [PubMed] [Google Scholar]
- 33.Suhre K, Meisinger C, Doring A, Altmaier E, Belcredi P, Gieger C, Chang D, Milburn MV, Gall WE, Weinberger KM, et al. Metabolic footprint of diabetes: a multiplatform metabolomics study in an epidemiological setting. PLoS One 2010;5:e13953. [DOI] [PMC free article] [PubMed] [Google Scholar]
- 34.Langenberg C, Savage DB. An amino acid profile to predict diabetes? Nat Med 2011;17:418–20. [DOI] [PubMed] [Google Scholar]