

Abstract
Background: Neural responses to highly energetic food cues are robust and are suppressed by eating. It is not known if neural responsiveness to food cues is an inherited trait and possibly even one that mediates the genetic influences on body weight that have been previously observed.
Objective: We investigated the inherited influence on brain responses to high-calorie visual food cues before and after a meal.
Design: With the use of a monozygotic twin study design, 21 healthy monozygotic twin pairs consumed a standardized breakfast and, 3.5 h later, underwent the first of 2 functional MRI (fMRI) scans with the use of visual food cues. After the first fMRI session, twins consumed a standardized meal, which was followed by the second fMRI. Serial ratings of appetite and food appeal were obtained. An ad libitum buffet was used to measure total caloric and macronutrient intakes. Intraclass correlations (ICCs) were used to test for inherited influences by comparing whether intrapair similarity was greater than interpair similarity.
Results: Body mass index was highly correlated within twin pairs (ICC: 0.96; P < 0.0001). ICCs also showed a strong intrapair similarity for the meal-induced change in hunger (ICC: 0.41; P = 0.03), fullness (ICC: 0.39; P = 0.04), and the appeal of fattening food (ICC: 0.57; P < 0.001). Twins ate a similar number of kilocalories at the buffet (ICC: 0.43; P = 0.02). Before the meal, the global brain activation across regions involved in satiety processing was not more similar in twins than in unrelated individuals. However, significant ICCs were present after the meal (ICC: 0.39; P = 0.04) and for the meal-induced change in activation by high-calorie visual food cues (ICC: 0.52; P < 0.01).
Conclusion: Inherited factors influence both satiety perception and the effect of a meal to alter regional brain responses to images of highly energetic food. This trial was registered at clinicaltrials.gov as NCT02483663.
Keywords: fMRI, food intake, obesity, satiety, visual food cues
See corresponding editorial on page 299.
INTRODUCTION
In the modern food environment, cues for highly energetic foods are abundant. We (1, 2), and other authors (3–8) have used functional MRI (fMRI)11 to show that visual images of food powerfully stimulate brain areas that are active in regulating energy homeostasis and reward processing. Neural responses to visual food cues are accentuated by fasting (8, 9), modified by appetite-regulating hormones (10–12), and reflect the overall state of energy balance (5, 11). In addition, when food is ingested, the strength of the brain response to high-calorie visual food cues provides a robust, neurobiological measure of satiety in humans (2). Previous studies have reported that visual food cues evoked differential brain responses in obese than in lean subjects (6, 13), and such differences have been hypothesized to represent an inherited predisposition toward weight gain. However, whether polygenic inheritance, which is the impact of multiple genes inherited together across the genome and the predominant mode of transmission of obesity risk, influences neural responses to visual food cues has not been established to our knowledge. We used a twin methodology to address this gap.
Twin studies provide compelling evidence for both the inherited influence on body weight (14–16) and the critical role of environmental factors in promoting obesity in people with a propensity to gain weight (17–19). Because the genetic similarities of twins are easily understood, twins are useful for elucidating the contribution of inherited factors to illness and health (20, 21). Monozygotic twins are genetically identical, of the same sex, and exactly matched for age. Although traditional twin studies were used to parse genetic and environmental influences on traits, monozygotic twin pairs can be used to compare the within-pair variance with the between-pair variance. If the between-pair variance is larger, twins are presumed to respond more similarly because of inherited and familial factors (22, 23). In the hands of Bouchard et al. (24, 25), these designs established the genetic basis for physiologic responses to overfeeding (24) and a negative energy balance (25). Since these seminal studies were completed, advances in neuroimaging technology have allowed brain systems that underlie the appetitive behavior in humans to be queried in novel ways. Therefore, we used a study design that was based on that of Bouchard et al. (24, 26) and integrated fMRI to test if inherited factors contribute to individual differences in meal-induced satiety and the brain regulation of appetite. We hypothesized that satiety, particularly meal-induced changes in the brain response to high-calorie visual food cues, would show inherited and familial influences.
METHODS
Participants
Monozygotic twin pairs were recruited from the community-based University of Washington Twin Registry (27). Monozygotic pairs who met the inclusion criteria [age: 18–50 y; BMI (in kg/m2): 18.5–50; and raised together until ≥15 y of age] were selected in a block-randomized manner to achieve equal numbers of male and female pairs. The following exclusion criteria were applied: major medical problems, including diabetes; allergies to study foods; lactose intolerance or inability to taste; consuming a vegetarian or vegan diet; daily smoking or heavy alcohol consumption; use of medications that impact appetite (e.g., atypical antipsychotics); a lifetime history of weight loss surgery or eating disorders; excessive exercise; night work; pregnancy or breastfeeding; current participation in a weight loss program or use of weight-loss medications; and a contraindication to MRI. The University of Washington Human Subjects Committee approved all study procedures. Twins provided written informed consent.
Study invitation letters were sent to 122 pairs of twins who were living in Washington State. Ninety individuals completed phone screenings for eligibility, of whom 20% were ineligible because of health or habits (i.e., smokers, medication use, having food allergies, or having BMI <18.5) and 6% were ineligible because of a contraindication to MRI (e.g., having braces, retainers, or piercings). Twenty-one monozygotic pairs were enrolled. One eligible participant completed the study procedures, but appetite and fMRI data were excluded because of the reporting of substantial nausea during the study. One eligible participant was excluded only from fMRI analyses because of a scanner artifact, and another subject was excluded from fMRI analyses because of spurious fMRI data (i.e., physiologically improbable parameter estimates). The sample size included 20 complete monozygotic twin pairs (41 individuals) for appetite analyses and 18 complete pairs (39 individuals) for fMRI analyses (Supplemental Figure 1).
Study procedures
Study procedures are detailed in Figure 1. Participants began fasting at 2130 h the night before the study visit and arrived at the University of Washington Clinical Research Center the next morning at 0630. All study procedures were completed on the same day for each pair. The twin order was assigned by a statistician who did not interact with the subjects; BMI was counterbalanced to ensure that the heavier twins within the pairs were distributed equally between twin 1 and twin 2 assignments. Height and weight were measured in a hospital gown. At 0800, twin 1 received a standardized breakfast (15% protein, 35% fat, and 50% carbohydrate) of egg and cheese on an English muffin and orange juice. The standardized breakfast was titrated to represent 10% of estimated daily caloric requirements (calculate with the use of the Mifflin-St. Jeor equation and a standard activity factor of 1.3). Twins completed questionnaires and underwent a whole-body dual-energy X-ray absorptiometry scan (General Electric Lunar Prodigy) to assess their body compositions. At 1130, twin 1 underwent the first fMRI scan and, directly after at 1200, completed appetite and food-appeal ratings and a post-MRI memory test that was used to encourage attention to the task (mean ± SD percentage of answers correct: 88% ± 8%). After these measures, twin 1 consumed, within 15 min, a standardized meal of macaroni and cheese that was titrated to meet 20% of his or her estimated daily caloric needs (10% protein, 50% fat, and 40% carbohydrate). After the standardized meal, at 1230, twin 1 underwent a second fMRI, which was followed by repeated appetite and food-appeal ratings and a post-MRI memory test (mean ± percentage of answers correct: 84% ± 8%), and was taken to a private room where he or she had 30 min to select and consume food at an ad libitum buffet. Participants were not informed that the buffet was part of the study procedures or that their food consumption was monitored until the study was concluded. Twin 2 followed the same procedures 30 min after twin 1. Twins were separated during all meals.
FIGURE 1.

Study protocol. Twin pairs completed the study visit on the same day with twin 1 receiving breakfast at 0800, and twin 2 receiving breakfast at 0830. A DXA scan was used to measure body composition. VAS appetite ratings were completed throughout the study day, and appeal ratings were done after each fMRI session. A standardized breakfast and standardized meal were given to each participant and were titrated to represent 10% and 20% of the estimated daily caloric need of participants. After the last fMRI session, participants were presented with an ad libitum buffet. DXA, dual-energy X-ray absorptiometry; fMRI, functional MRI; VAS, visual analog scale.
Measures
Visual analog scale appetite ratings
Visual analog scale appetite ratings were completed every 30 min and included ratings of hunger, fullness, satisfaction, and prospective food intake (28). The change in the visual analog scale score (postmeal minus premeal) was calculated.
Food-appeal ratings
Twins viewed 42 photographs that were a subset of those viewed during the fMRI (2, 29). Twins marked the number that “best describes how appealing the food shown in the photograph appears to you right now” on a 10-point Likert scale that ranged from “not at all” to “extremely” appealing.
Ad libitum buffet meal
Food was presented in an amount that exceeded estimated energy needs (∼5000 kcal total). Food was varied in its caloric and macronutrient contents as well as hedonic appeal and included items such as pizza, bagels, fruit (e.g., grapes and bananas), chips, lunchmeat with bread for sandwiches (e.g., turkey, salami, and cheese), vegetables (e.g., carrots and tomatoes), cookies, and orange juice. All uneaten food was weighed to determine the total kilocalories and macronutrient percentages that were consumed (ProNutra; Viocare Technologies) (2).
Eating behavior
The Revised Restraint Scale, which is a 10-item self-report questionnaire, was used to identify individuals with chronic dieting and weight concerns (30). The Three-Factor Eating Questionnaire Revised 18-item version (31, 32) was used to assess 3 subscales of eating behavior (e.g., cognitive restraint, uncontrolled eating, and emotional eating).
Images
The selection and validation of study images have been described previously (2, 29, 33). Briefly, fattening foods included those that were rated as unacceptable to eat while dieting to lose weight and were characteristically high in calories, fat, and sugar (e.g., candy, desserts, and pizza). Nonfattening foods were rated as acceptable to eat while dieting (e.g., fruit, vegetables, and chicken breast). Nonfood images consisted of easily recognizable objects (e.g., books, furniture, and electronics).
Imaging paradigm
The imaging paradigm used in the current study has been described elsewhere (2). Each fMRI session included a distinct set of 13 blocks of 10 images each (7 nonfood blocks that were alternated with 3 fattening and 3 nonfattening food blocks). The order of blocks was counterbalanced between pairs, but each twin pair viewed the blocks in the same order.
Image acquisition and processing
Scans were acquired with a 32-channel SENSE head coil on a 3-Tesla Philips Achieva MR System (Philips Medical Systems) with Dual Quasar Gradients (80 mT/m at a slew rate of 110 mT · m−1 · s−1 or 40 mT/m at a slew rate of 220 mT · m−1 · s−1). In both sessions, a 133-volume, T2*-weighted single-shot echo-planar imaging (EPI) time series [44 ascending axial slices; 2.75 × 2.75 × 3.00-mm voxels; repetition time (TR): 2400 ms; echo time (TE): 30 ms, SENSE factor: 2] was acquired during passive picture viewing. A B0 field map (TR: 10 ms; minimum TE: 2.8 ms; Δ TE: 1.0 ms; flip angle: 10°) with the same geometry was acquired for the distortion correction of the EPI data. A three-dimensional magnetization-prepared rapid gradient-echo image with 176 sagittal slices (TR: 7.5 ms, TE: 3.5 ms; flip angle: 7° SENSE factor: 2; matrix: 256 × 256; and 1-mm isotropic voxels) was also acquired for anatomic registration.
Time-series data were processed with the use of software packages from the Oxford Centre for Functional MRI of the Brain (FMRIB) Software Library (www.fmrib.ox.ac.uk/fsl), FreeSurfer (http://surfer.nmr.mgh.harvard.edu/), and the Analysis of Functional NeuroImages, http://afni.nimh.nih.gov/afni). The following preprocessing steps were applied: a simultaneous application of fieldmap-based EPI unwarping that was calculated in FUGUE (FMRIB's Utility for Geometrically Unwarping EPIs) (34, 35) and motion correction that was calculated with MCFLIRT (Motion-correction FMRIB's Linear Image Registration Tool) (36); a bias-field correction with FAST (FMRIB’s Automated Segmentation Tool) (37); the removal of spike artifacts with the Analysis of Functional NeuroImages’s 3dDespike; correction for slice timing differences with the use of Fourier space-time shifting implemented in slicetimer; mask-based removal of nonbrain tissue; spatial smoothing with SUSAN (Smallest Univalue Segment Assimilating Nucleus) with and full width half maximum equal to 5 mm; grand-mean intensity normalization with the use of a single multiplicative factor; and high-pass temporal filtering of 90 s. The time-series statistical analysis was performed with FMRIB’s Improved Linear Model with local autocorrelation correction (38). The regression model included covariates for the fattening and nonfattening stimulus conditions as well as mean-centered nuisance covariates (average signal time courses in white matter and lateral ventricles defined by FreeSurfer segmentation, motion variable estimates, and the first derivative of each motion estimate). Each block of fattening and nonfattening visual stimuli was modeled with the use of a boxcar convolved with a γ function and its temporal derivative. Condition effects were estimated from the average response across blocks for our contrast of interest (i.e., fattening compared with nonfattening).
FMRI data for each session were registered to the participant’s high-resolution structural scan with the use of a boundary-based registration procedure (39). The high-resolution structural scans were registered at the Montreal Neurological Institute template space (ICBM152) with FMRIB’s linear image registration tool (36). For each participant, the derived transformations were concatenated and applied to the statistical images to allow for group-level analyses.
A region-of-interest (ROI) approach was applied with the use of masks that were established in an independent study of normal-weight subjects to be markers of satiety or predictors of food choices (2). ROIs included the left and right ventral striatum (nucleus accumbens), the left and right amygdala, the left and right dorsal striatum (caudate and putamen), the left and right insula, and the medial orbital frontal cortex (mOFC). In addition, an ROI for the ventral tegmental area (VTA) was created for use in the current study and was anatomically bounded inferiorly by the decussation of the cerebellar peduncles and medially, laterally, and superiorly by the midpoint of the superior colliculus, the substantia nigra, and the red nucleus (40, 41) (Supplemental Figure 2).
Similar to recent publications (42), we established a global average of brain activation within our a priori satiety-related ROIs for each participant. This method allowed us to determine a genetic influence on the meal-induced change in the brain’s response to visual food cues after a standardized meal. With this information, we explored if the genetic influence was driven by any particular region within our a priori ROIs, which included the following: the mOFC and the bilateral amygdala, ventral striatum, dorsal striatum, and insula.
Statistical analysis
Means ± SDs are reported unless otherwise specified. Intraclass correlations (ICCs) were used to test hypotheses regarding inherited influences on satiety perception. All ICCs were adjusted a priori for sex because both male and female pairs were included in the sample. Significant ICCs indicated that twins were more similar to each other than to unrelated individuals and could be interpreted as supporting inherited or familial influences on the phenotype. ICCs were calculated with the use of a linear mixed-effects model with the use of restricted maximum likelihood estimations to allow for covariates and to account for missing data (43). A generalized estimating equation regression was used to assess differences in eating behavior scores as well as meal-induced changes in subjective satiety. An independent working correlation structure was used with a sandwich variance estimator to account for the nonindependence of the twin sample. Statistics and graphing were completed with the use of STATA program (13.1; StataCorp LP), R statistical programing language (version 3.0.1) (44) [packages lme4 (45) and nlme (46)], and GraphPad Prism software (Version 6.00 for Windows; GraphPad Software).
RESULTS
Twin characteristics
Of 21 monozygotic pairs, 11 pairs were men. Self-reported race was 88% white, 5% Asian, and 7% more than one race. Twin characteristics are shown in Table 1. There were no differences between men and women in mean age, BMI, or restrained or emotional eating scores. Women tended to weigh less than men did (73 ± 21 compared with 85 ± 20 kg, respectively; P = 0.09) and scored higher in measures of cognitive restraint (15 ± 3 compared with 12 ± 4, respectively; P = 0.02) and lower in measures of unrestrained eating (18 ± 4 compared with 21 ± 4, respectively; P = 0.02).
TABLE 1.
Twin characteristics
| Mean ± SD | |
| Age, y | 27 ± 8 |
| Weight, kg | 79 ± 21 |
| BMI, kg/m2 | 27 ± 6 |
| Restraint Scale1 | 12.8 ± 4.3 |
| Cognitive restraint2 | 13.5 ± 4.0 |
| Uncontrolled eating2 | 19.5 ± 4.3 |
| Emotional eating2 | 6.2 ± 2.0 |
Restraint Scale has a theoretical range of 0–35 (30).
Body weight and adiposity
Seventeen pairs had a BMI within the same category. There were 10 normal-weight pairs, one overweight pair, and 6 obese pairs. Twin correlations were extremely similar in BMI and adiposity (Figure 2).
FIGURE 2.
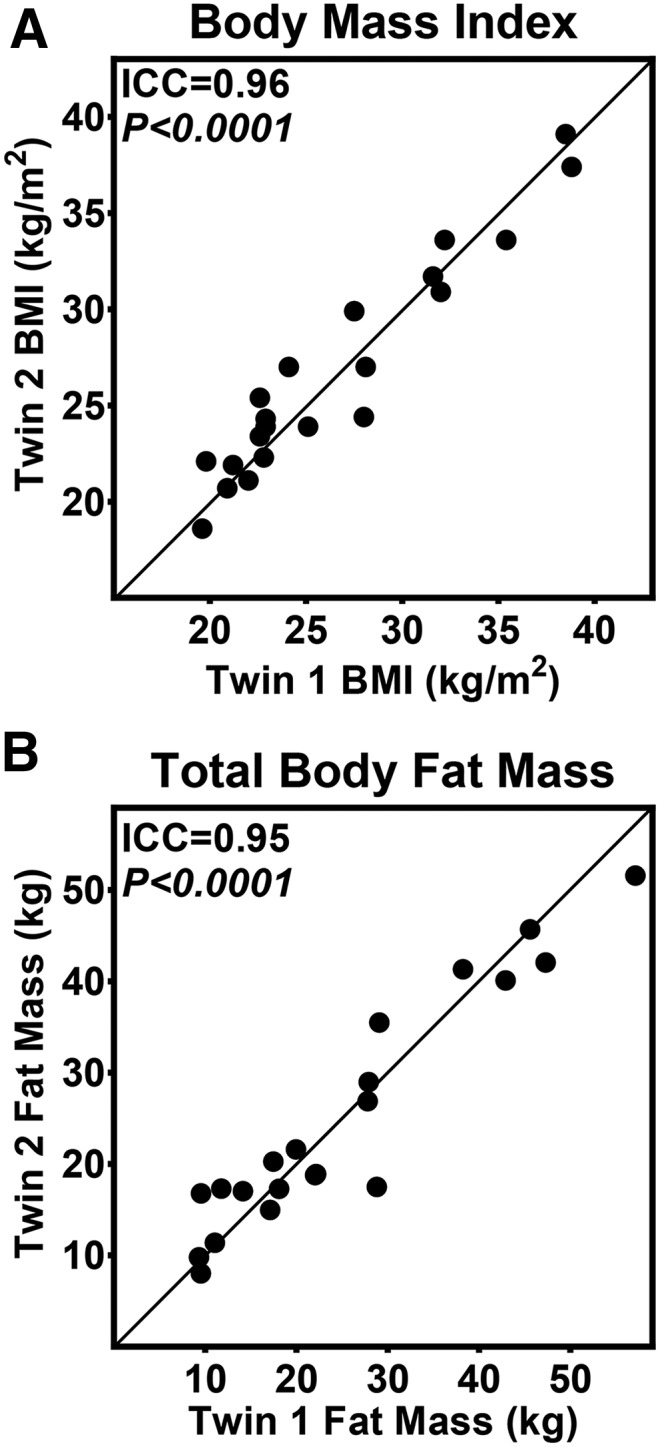
Inherited influences on adiposity. BMI (A) and total body fat mass (B) were highly correlated in twin pairs. Total fat mass was measured with the use of dual-energy X-ray absorptiometry. n = 21 twin pairs. Lines represents 100% within-pair agreement (i.e., the closer the data point is to the line, the more similar the twins were to each other). P values were calculated with the use of linear mixed models, and models were adjusted for sex. ICC, intraclass correlation.
Satiety, food appeal, and caloric intake
As expected, the standardized meals and ad libitum buffet decreased hunger and increased fullness (Figure 3A, B). When fasted, twins were not more similar to each other than to unrelated individuals in their appetite scores [hunger ICC: 0.00 (95% CI: 0.00, 1.00; P = 1.00); fullness ICC: 0.14 (95% CI: 0.00, 0.88; P = 0.28)]. However, the effect of the standardized breakfast to induce fullness was more similar in the twins than in unrelated individuals (ICC: 0.36; 95% CI: 0.10, 0.75; P < 0.05), but the ICC was NS for self-reported reductions in hunger (ICC: 0.01; 95% CI: 0.00, 1.00; P = 0.48). After a 4-h intermeal interval, the standardized meal of macaroni and cheese was provided, and ICCs were again significant for meal-induced changes in subjective appetite (Figure 3C, D). Furthermore, meal-induced changes in the self-reported appeal of fattening and nonfattening food (Figure 3E, F) were also more similar between twins than between unrelated individuals.
FIGURE 3.

Meal-induced changes in subjective satiety and appeal ratings. All study meals (arrows) induced a significant reduction in mean ± SEM hunger ratings (A) and an increase in mean ± SEM fullness ratings (B). The standardized meal (administered at T = 240 min) reduced subjective hunger (C) and increased fullness (D) more similarly between twins than in unrelated individuals. Postprandial changes in the appeal of fattening (E) and nonfattening (F) foods were also more similar in twin pairs than in unrelated individuals. Models were adjusted for sex and included 20 pairs and one individual twin who had missing data for the co-twin (i.e., the unpaired individual only contributed to the between-pair variance). P values for panels A and B (n = 41 individuals) were determined with the use of a generalized estimating equation regression. In panels C–F (n = 20 twin pairs), lines represent 100% within-pair agreement, and P values were calculated with the use of linear mixed models. *P < 0.0001. ICC, intraclass correlation; VAS, visual analog scale.
On average, twins consumed 51% ± 3% of their estimated daily caloric needs at the ad libitum buffet meal. This amount did not differ on the basis of the BMI category or sex (Figure 4A, B). At the ad libitum buffet, total caloric intake as well as the percentage of estimated daily needs consumed showed consistent inherited and familial influences (Figure 4C, D). Food choice at the buffet, in terms of macronutrient composition, did not show significant evidence for inherited influences although trends were present for protein intake (Figure 4E–G). Sensitivity analyses that included total body fat mass in models did not substantively change these ICCs or CIs (data not shown), which provided support that the intrapair similarity in food intake was not solely due to the intrapair resemblance in body composition.
FIGURE 4.

Inherited influences on food intake. Mean ± SEM ad libitum buffet intake did not differ on the basis of BMI (A) or sex (B). Standardized meals are indicated with hash marks in panels A and B. Significant ICCs were shown for total kilocalories consumed (C) and for the proportion of calculated daily needs consumed (D) at the ad libitum buffet. Twins did not consume a similar amount of calories from fat (E) at the buffet but did show trends for consuming a similar percentage of calories from carbohydrates (F) and protein (G). Daily caloric needs were estimated with the use of the Mifflin-St. Jeor equation and an activity factor. Models were adjusted for sex and included 20 pairs and one individual twin who had missing data for the co-twin (i.e., the unpaired individual only contributed to the between-pair variance). P values for panels A and B (n = 41 individuals) were determined with the use of a generalized estimating equation regression. In panels C–G (n = 20 twin pairs), lines represent 100% within-pair agreement, and P values were calculated with the use of linear mixed models. ICC, intraclass correlation.
Inherited influences on the brain response to fattening visual food cues
We first assessed for inherited influences on the brain response to food cues with the use of a global average of activation across regions established to participate in satiety processing (2) (Supplemental Figure 2). Before the standardized meal, the global activation by fattening food cues was not significantly more similar between twins than between unrelated individuals (Figure 5A). However, after the meal, the ICC was significant for the brain response to fattening compared with nonfattening food cues (Figure 5B). The ICC for the global change in brain activation to fattening food cues induced by the meal was highly significant (Figure 5C), which provided support of inherited influences on meal-induced changes in the brain response to food cues.
FIGURE 5.

Inherited influences on satiety as assessed by brain activation to fattening food cues before (A) and after (B) a standardized meal. Global average brain activation within satiety-related regions (Supplemental Figure 2) was not more similar within twin pairs before the standardized meal (A). After the meal, brain activation to fattening food cues was significantly more similar between twins than in unrelated individuals (B). Twins were also significantly more similar in their changes in brain activation (postmeal minus premeal values) elicited by a standardized meal than were unrelated individuals (C). n = 18 twin pairs. Lines represent 100% within-pair agreement. Models were adjusted for sex and included 18 pairs and 3 individual twins missing data for their co-twin (i.e., unpaired individuals only contributed to the between-pair variance). P values were calculated with the use of linear mixed models. ICC, intraclass correlation.
We examined individual ROIs to determine whether inherited influences on brain responses were widespread or limited to particular anatomic regions. ICCs were NS in any brain region premeal (Table 2). Postmeal, significant ICCs were found for the right dorsal striatum and VTA. Moreover, the intrapair similarity was greater than the interpair similarity for the change in activation induced by the meal within the right amygdala, right dorsal striatum, mOFC, and VTA (Figure 6, Table 2).
TABLE 2.
ICC values for brain activation to fattening food cues in a priori regions of interest before and after a meal and for the change in activation because of the meal (postmeal minus premeal)1
| Left ventral striatum | Right ventral striatum | Left amygdala | Right amygdala | Left dorsal striatum | Right dorsal striatum | Left insula | Right insula | mOFC | VTA | |
| Premeal | 0.00 (0.00, 1.00) | 0.00 (0.00, 1.00) | 0.12 (0.01, 0.92) | 0.13 (0.01, 0.87) | 0.00 (0.00, 1.00) | 0.00 (0.00, 1.00) | 0.00 (0.00, 1.00) | 0.00 (0.00, 1.00) | 0.15 (0.01, 0.86) | 0.00 (0.00, 1.00) |
| Postmeal | 0.19 (0.01, 0.81) | 0.01 (0.00, 1.00) | 0.07 (0.00, 0.99) | 0.14 (0.00, 0.88) | 0.13 (0.00, 0.88) | 0.37 (0.10, 0.75)* | 0.23 (0.03, 0.77) | 0.22 (0.02, 0.76) | 0.35 (0.08, 0.77) | 0.61 (0.32, 0.84)* |
| Postmeal minus premeal | 0.00 (0.00, 1.00) | 0.06 (0.00, 0.99) | 0.29 (0.05, 0.77) | 0.52 (0.22, 0.81)* | 0.03 (0.00, 0.99) | 0.45 (0.16, 0.78)* | 0.14 (0.01, 0.88) | 0.16 (0.01, 0.81) | 0.39 (0.11, 0.77)* | 0.49 (0.20, 0.79)* |
All values are ICCs; 95% CIs in parentheses. ICCs were calculated with the use of linear mixed models, and models were adjusted for sex. Parameter estimates used in the calculations were from fattening greater than nonfattening visual food-cue contrasts. n = 18 complete twin pairs; n = 39 individuals included in the statistical calculations. *P < 0.05. ICC, intraclass correlation; mOFC, medial orbital frontal cortex; VTA, ventral tegmental area.
FIGURE 6.

Region-by-region analysis of inherited influences on meal-induced changes in brain activation. Significant ICCs were present for changes in brain activation to fattening compared with nonfattening visual food cues in the right amygdala (A), right dorsal striatum (B), medial orbital frontal cortex (C), and ventral tegmental area (D). n = 18 twin pairs. Lines represent 100% within-pair agreement. Models were adjusted for sex and included 18 pairs and 3 individual twins who were missing data for their co-twins (i.e., unpaired individuals only contributed to the between-pair variance). P values were calculated with the use of linear mixed models. ICC, intraclass correlation.
DISCUSSION
As shown by Bouchard et al. (22, 24) and other authors (47, 48), body weight is a strongly inherited trait even within a changing environment. The current findings reinforce these classic studies and, to our knowledge, provide new evidence that the degree of satiety induced by a meal might be an inherited influence on appetite regulation. Our findings also support inherited influences on the change in food appeal induced by a meal and on caloric intake at an ad libitum buffet meal. Results from these behavioral measures were reinforced by findings from the fMRI examinations. With the use of fMRI, we showed that the change in activation by fattening food cues induced by a meal in regions associated with satiety was more similar between the genetically identical twins than in unrelated individuals. Particular regions implicated most strongly were the right amygdala, right dorsal striatum, mOFC, and VTA. These findings describe inherited influences on satiety perception including within neuroregulatory systems that control appetite, which perhaps underlie the robust inheritance of body weight.
Our monozygotic twin design allowed us to test for inherited and familial influences on satiety perception. The design used in this study and by Bouchard et al. (23) subjected both members of monozygotic twin pairs to the same experimental stimulus and compared intrapair (within family and genotype) and interpair (between genotypes and families) variances in response to the experimental manipulation. The design aimed to elucidate whether a genetic background influences the response to a stimulus such as the visual images during fMRI or the standardized meals provided in the current study. The interpretation assumes that, when the intrapair similarity in responses is greater than the interpair similarity is, a genetic or family background acts to influence the response to the stimulus.
In the current study, there was a significantly greater intrapair similarity than interpair similarity for self-reported changes in appetite and food appeal induced by a standardized meal. Furthermore, twins ate a similar number of calories and a similar percentage of their daily needs at an ad libitum buffet meal. Neither BMI nor sex was related to the percentage of daily needs consumed at the buffet. Taken together, these findings support hypotheses that the degree of subjective satiety experienced when eating may be an inherited component of human eating behavior (49), and we expand the literature by documenting the relevance of inherited factors to actual food intake.
Inherited influences on satiety perception were also present at the level of the brain, which was a finding that may underlie the similarity of twins in the subjective perception of satiety (2). In normal-weight adults and children, consumption of a meal generally induces the suppression of the BOLD signal in brain regions associated with satiety (2, 50). However, there is considerable individual variability. Our findings of a significantly greater intrapair similarity in brain responses to visual food cues after the meal and, notably, a robust intrapair similarity in the degree to which eating altered the response to fattening food cues suggest that genetic factors underlie a portion of this individual variability. Individual anatomic regions that typify the inherited satiety response are the amygdala, dorsal striatum, mOFC, and VTA. The amygdala is a critical region that encodes the reward and emotional values of stimuli, which, together with the mOFC, directs attention to the most-relevant reward on the basis of physiologic or other needs (51, 52). Opioid pathways within the amygdala (along with the nucleus accumbens and lateral hypothalamus) are thought to specifically stimulate the preference and consumption of highly palatable food (53, 54). Another region that showed potential inherited influence was the VTA, which houses a portion of the neuronal cell bodies of the mesolimbic dopamine pathways that enhance the motivation to obtain rewards (55, 56). Similarly, dorsal striatal reward responses have previously been implicated in obesity (57) and as inherited traits with the potential to influence future weight gain (58, 59). Our sensitivity analyses did not reveal that twin similarity was solely explained by body fat mass, and additional work is needed to contextualize the current findings relation to inherited risk of obesity. In sum, the current study supports inherited influences on satiety responsiveness within brain regions that potently direct appetitive behavior via our experience of motivation for food, food reward, and attention to food cues in our environment.
However, we showed no evidence to suggest an inherited basis for the premeal neural responses to fattening food cues in our a priori ROIs. This finding was somewhat surprising, because of the twins’ similarity in many other arenas and in previous studies that showed heritability in the brain structure (60) and function in tasks such as working memory (61) and arithmetic (62). However, studies in individuals with the at-risk fat mass- and obesity-associated genotype also report dysregulation in the brain response to visual food cues only after a meal or an oral glucose load (63, 64). We interpret these findings as supporting a model in which inherited influences shape the meal-induced suppression of motivation for highly energetic foods as opposed to setting a basal level of responsiveness to environmental food cues.
There were limitations to the current study. The monozygotic twin design could not distinguish between genetic and familial factors. A classic twin study that includes both monozygotic and dizygotic pairs is required to parse genetic and family environmental influences or to estimate the heritability of a phenotype. Thus, the monozygotic twin design used in the current study was a powerful approach that allowed us to evaluate evidence for inherited influences on meal-induced satiety and neural responses to visual food cues but could not rule out that familial influences were present. Moreover, we focused on regions that have been determined to be biomarkers of satiety (2); therefore, it is possible that we excluded other brain regions that may have inherited or familial responses to visual food cues, such as the hypothalamus. It is also possible that a larger sample size would have detected smaller effects or provided more precise estimates of ICCs. In regards to the fMRI analyses, a strength of this study was that we applied anatomic masks to all individuals that were based on a prior study. This approach avoided the introduction of bias that is solely based on twin similarities in neuroanatomy (60) or the accuracy of warping into the determination of ICCs for our fMRI outcomes.
In conclusion, the current research extends previous work and, to our knowledge, provides new data that the inherited influence on the perception of satiety may be partially orchestrated by the brain’s response to high-calorie visual food cues. These results imply that inherited differences in the degree to which attention to and motivation for high-calorie food is altered by a meal could contribute to risk of obesity in an environment of abundant energy-rich food. Future research should focus on this implication and on identifying genotypes or single nucleotide polymorphisms that may be associated with impaired satiety perception (65), thereby promoting obesity.
Acknowledgments
We thank Mary K Askren, Mary Rosalynn B De Leon, Holly Callahan, and Danielle Yancey for their assistance.
The authors’ responsibilities were as follows—SJM, SM, CJN, and EAS: analyzed the data and performed the statistical analyses; SJM, VT, MFW, and EAS: conducted the research; SJM and EAS: wrote the manuscript; MK, DSB, JG, KRM, TJG, and EAS: designed the research; EAS: had primary responsibility for the final content of the manuscript; and all authors: read and approved the final manuscript. None of the authors reported a conflict of interest related to the study.
Footnotes
Abbreviations used: EPI, echo-planar imaging; fMRI, functional MRI; FMRIB, Oxford Centre for Functional MRI of the Brain; ICC, intraclass correlation; mOFC, medial orbital frontal cortex; ROI, region of interest; TE, echo time; TR, repetition time; VTA, ventral tegmental area.
REFERENCES
- 1.Schur EA, Kleinhans NM, Goldberg J, Buchwald D, Schwartz MW, Maravilla K. Activation in brain energy regulation and reward centers by food cues varies with choice of visual stimulus. Int J Obes (Lond) 2009;33:653–61. [DOI] [PMC free article] [PubMed] [Google Scholar]
- 2.Mehta S, Melhorn SJ, Smeraglio A, Tyagi V, Grabowski T, Schwartz MW, Schur EA. Regional brain response to visual food cues is a marker of satiety that predicts food choice. Am J Clin Nutr 2012;96:989–99. [DOI] [PMC free article] [PubMed] [Google Scholar]
- 3.Uher R, Treasure J, Heining M, Brammer MJ, Campbell IC. Cerebral processing of food-related stimuli: effects of fasting and gender. Behav Brain Res 2006;169:111–9. [DOI] [PubMed] [Google Scholar]
- 4.Killgore WD, Young AD, Femia LA, Bogorodzki P, Rogowska J, Yurgelun-Todd DA. Cortical and limbic activation during viewing of high- versus low-calorie foods. Neuroimage 2003;19:1381–94. [DOI] [PubMed] [Google Scholar]
- 5.Cornier MA, Von Kaenel SS, Bessesen DH, Tregellas JR. Effects of overfeeding on the neuronal response to visual food cues. Am J Clin Nutr 2007;86:965–71. [DOI] [PubMed] [Google Scholar]
- 6.Rothemund Y, Preuschhof C, Bohner G, Bauknecht HC, Klingebiel R, Flor H, Klapp BF. Differential activation of the dorsal striatum by high-calorie visual food stimuli in obese individuals. Neuroimage 2007;37:410–21. [DOI] [PubMed] [Google Scholar]
- 7.Toepel U, Knebel JF, Hudry J, le Coutre J, Murray MM. The brain tracks the energetic value in food images. Neuroimage 2009;44:967–74. [DOI] [PubMed] [Google Scholar]
- 8.Goldstone AP, Prechtl de Hernandez CG, Beaver JD, Muhammed K, Croese C, Bell G, Durighel G, Hughes E, Waldman AD, Frost G, et al. Fasting biases brain reward systems towards high-calorie foods. Eur J Neurosci 2009;30:1625–35. [DOI] [PubMed] [Google Scholar]
- 9.van der Laan LN, de Ridder DT, Viergever MA, Smeets PA. The first taste is always with the eyes: a meta-analysis on the neural correlates of processing visual food cues. Neuroimage 2011;55:296–303. [DOI] [PubMed] [Google Scholar]
- 10.Farooqi IS, Bullmore E, Keogh J, Gillard J, O’Rahilly S, Fletcher PC. Leptin regulates striatal regions and human eating behavior. Science 2007;317:1355. [DOI] [PMC free article] [PubMed] [Google Scholar]
- 11.Rosenbaum M, Sy M, Pavlovich K, Leibel RL, Hirsch J. Leptin reverses weight loss-induced changes in regional neural activity responses to visual food stimuli. J Clin Invest 2008;118:2583–91. [DOI] [PMC free article] [PubMed] [Google Scholar]
- 12.Malik S, McGlone F, Bedrossian D, Dagher A. Ghrelin modulates brain activity in areas that control appetitive behavior. Cell Metab 2008;7:400–9. [DOI] [PubMed] [Google Scholar]
- 13.Stoeckel LE, Kim J, Weller RE, Cox JE, Cook EW 3rd, Horwitz B. Effective connectivity of a reward network in obese women. Brain Res Bull 2009;79:388–95. [DOI] [PMC free article] [PubMed] [Google Scholar]
- 14.Stunkard AJ, Foch TT, Hrubec Z. A twin study of human obesity. JAMA 1986;256:51–4. [PubMed] [Google Scholar]
- 15.Stunkard AJ, Harris JR, Pedersen NL, McClearn GE. The body-mass index of twins who have been reared apart. N Engl J Med 1990;322:1483–7. [DOI] [PubMed] [Google Scholar]
- 16.Hewitt JK, Stunkard AJ, Carroll D, Sims J, Turner JR. A twin study approach towards understanding genetic contributions to body size and metabolic rate. Acta Genet Med Gemellol (Roma) 1991;40:133–46. [DOI] [PubMed] [Google Scholar]
- 17.Newman B, Selby JV, Quesenberry CP Jr, King MC, Friedman GD, Fabsitz RR. Nongenetic influences of obesity on other cardiovascular disease risk factors: an analysis of identical twins. Am J Public Health 1990;80:675–8. [DOI] [PMC free article] [PubMed] [Google Scholar]
- 18.Price RA, Stunkard AJ. Commingling analysis of obesity in twins. Hum Hered 1989;39:121–35. [DOI] [PubMed] [Google Scholar]
- 19.VanItallie TB, Stunkard AJ. Using nature to understand nurture. Am J Public Health 1990;80:657–8. [DOI] [PMC free article] [PubMed] [Google Scholar]
- 20.Hrubec Z, Robinette CD. The study of human twins in medical research. N Engl J Med 1984;310:435–41. [DOI] [PubMed] [Google Scholar]
- 21.Boomsma D, Busjahn A, Peltonen L. Classical twin studies and beyond. Nat Rev Genet 2002;3:872–82. [DOI] [PubMed] [Google Scholar]
- 22.Bouchard C, Tremblay A. Genetic influences on the response of body fat and fat distribution to positive and negative energy balances in human identical twins. J Nutr 1997;127(5 Suppl):943S–7S. [DOI] [PubMed] [Google Scholar]
- 23.Bouchard C. Heredity and the path to overweight and obesity. Med Sci Sports Exerc 1991;23:285–91. [PubMed] [Google Scholar]
- 24.Bouchard C, Tremblay A, Despres JP, Nadeau A, Lupien PJ, Theriault G, Dussault J, Moorjani S, Pinault S, Fournier G. The response to long-term overfeeding in identical twins. N Engl J Med 1990;322:1477–82. [DOI] [PubMed] [Google Scholar]
- 25.Bouchard C, Tremblay A, Despres JP, Theriault G, Nadeau A, Lupien PJ, Moorjani S, Prudhomme D, Fournier G. The response to exercise with constant energy intake in identical twins. Obes Res 1994;2:400–10. [DOI] [PubMed] [Google Scholar]
- 26.Bouchard C, Tremblay A, Despres JP, Poehlman ET, Theriault G, Nadeau A, Lupien P, Moorjani S, Dussault J. Sensitivity to overfeeding: the Quebec experiment with identical twins. Prog Food Nutr Sci 1988;12:45–72. [PubMed] [Google Scholar]
- 27.Strachan E, Hunt C, Afari N, Duncan G, Noonan C, Schur E, Watson N, Goldberg J, Buchwald D. University of Washington Twin Registry: poised for the next generation of twin research. Twin Res Hum Genet 2013;16:455–62. [DOI] [PMC free article] [PubMed] [Google Scholar]
- 28.Flint A, Raben A, Blundell JE, Astrup A. Reproducibility, power and validity of visual analogue scales in assessment of appetite sensations in single test meal studies. Int J Obes Relat Metab Disord 2000;24:38–48. [DOI] [PubMed] [Google Scholar]
- 29.Schur EA, Kleinhans NM, Goldberg J, Buchwald DS, Polivy J, Del Parigi A, Maravilla KR. Acquired differences in brain responses among monozygotic twins discordant for restrained eating. Physiol Behav 2012;105:560–7. [DOI] [PMC free article] [PubMed] [Google Scholar]
- 30.Herman CP, Polivy J. Restrained eating In: Stunkard AJ, editor. Obesity. Philadelphia: WB Saunders; 1980. p. 208–25. [Google Scholar]
- 31.Stunkard AJ, Messick S. The three-factor eating questionnaire to measure dietary restraint, disinhibition and hunger. J Psychosom Res 1985;29:71–83. [DOI] [PubMed] [Google Scholar]
- 32.de Lauzon B, Romon M, Deschamps V, Lafay L, Borys JM, Karlsson J, Ducimetière P, Charles MA; Fleurbaix Laventie Ville Sante Study Group. The Three-Factor Eating Questionnaire-R18 is able to distinguish among different eating patterns in a general population. J Nutr 2004;134:2372–80. [DOI] [PubMed] [Google Scholar]
- 33.Schur E, Noonan C, Polivy J, Goldberg J, Buchwald D. Genetic and environmental influences on restrained eating behavior. Int J Eat Disord 2009;42:765–72. [DOI] [PMC free article] [PubMed] [Google Scholar]
- 34.Jenkinson M. Fast, automated, N-dimensional phase-unwrapping algorithm. Magn Reson Med 2003;49:193–7. [DOI] [PubMed] [Google Scholar]
- 35.Jenkinson M, Wilson JL, Jezzard P. Perturbation method for magnetic field calculations of nonconductive objects. Magn Reson Med 2004;52:471–7. [DOI] [PubMed] [Google Scholar]
- 36.Jenkinson M, Bannister P, Brady M, Smith S. Improved optimization for the robust and accurate linear registration and motion correction of brain images. Neuroimage 2002;17:825–41. [DOI] [PubMed] [Google Scholar]
- 37.Zhang Y, Brady M, Smith S. Segmentation of brain MR images through a hidden Markov random field model and the expectation-maximization algorithm. IEEE Trans Med Imaging 2001;20:45–57. [DOI] [PubMed] [Google Scholar]
- 38.Woolrich MW, Ripley BD, Brady M, Smith SM. Temporal autocorrelation in univariate linear modeling of FMRI data. Neuroimage 2001;14:1370–86. [DOI] [PubMed] [Google Scholar]
- 39.Greve DN, Fischl B. Accurate and robust brain image alignment using boundary-based registration. Neuroimage 2009;48:63–72. [DOI] [PMC free article] [PubMed] [Google Scholar]
- 40.Ballard IC, Murty VP, Carter RM, MacInnes JJ, Huettel SA, Adcock RA. Dorsolateral prefrontal cortex drives mesolimbic dopaminergic regions to initiate motivated behavior. J Neurosci 2011;31:10340–6. [DOI] [PMC free article] [PubMed] [Google Scholar]
- 41.Eapen M, Zald DH, Gatenby JC, Ding Z, Gore JC. Using high-resolution MR imaging at 7T to evaluate the anatomy of the midbrain dopaminergic system. AJNR Am J Neuroradiol 2011;32:688–94. [DOI] [PMC free article] [PubMed] [Google Scholar]
- 42.Scholtz S, Miras AD, Chhina N, Prechtl CG, Sleeth ML, Daud NM, Ismail NA, Durighel G, Ahmed AR, Olbers T, et al. Obese patients after gastric bypass surgery have lower brain-hedonic responses to food than after gastric banding. Gut 2014;63:891–902. [DOI] [PMC free article] [PubMed] [Google Scholar]
- 43.Chen G, Saad ZS, Britton JC, Pine DS, Cox RW. Linear mixed-effects modeling approach to FMRI group analysis. Neuroimage 2013;73:176–90. [DOI] [PMC free article] [PubMed] [Google Scholar]
- 44.R Development Core Team. R: a language and envrionement for statistical computing. Vienna, Austria: R Foundation for Statistical Computing; 2013. [Google Scholar]
- 45.Bates D, Maechler M, Bolker B, Walker S., Lme4: linear mixed-effects models using Eigen and S4. R package version 1.0-4. 2013. Available from: https://cran.r-project.org/web/packages/lme4/index.html. [Google Scholar]
- 46.Pinheiro J, Bates D, DebRoy S, Sarker D, R Development Core Team. Nlme: linear and nonlinear mixed effects models. R package version 3.1.111. 2013. Available from: https://cran.r-project.org/web/packages/nlme/index.html. [Google Scholar]
- 47.Hainer V, Stunkard AJ, Kunesova M, Parizkova J, Stich V, Allison DB. Intrapair resemblance in very low calorie diet-induced weight loss in female obese identical twins. Int J Obes Relat Metab Disord 2000;24:1051–7. [DOI] [PubMed] [Google Scholar]
- 48.Maes HH, Neale MC, Eaves LJ. Genetic and environmental factors in relative body weight and human adiposity. Behav Genet 1997;27:325–51. [DOI] [PubMed] [Google Scholar]
- 49.Wardle J, Carnell S. Appetite is a heritable phenotype associated with adiposity. Ann Behav Med 2009;38(Suppl 1):S25–30. [DOI] [PubMed] [Google Scholar]
- 50.Bruce AS, Holsen LM, Chambers RJ, Martin LE, Brooks WM, Zarcone JR, Butler MG, Savage CR. Obese children show hyperactivation to food pictures in brain networks linked to motivation, reward and cognitive control. Int J Obes (Lond) 2010;34:1494–500. [DOI] [PMC free article] [PubMed] [Google Scholar]
- 51.Gottfried JA, O’Doherty J, Dolan RJ. Encoding predictive reward value in human amygdala and orbitofrontal cortex. Science 2003;301:1104–7. [DOI] [PubMed] [Google Scholar]
- 52.Rolls ET. The orbitofrontal cortex and reward. Cereb Cortex 2000;10:284–94. [DOI] [PubMed] [Google Scholar]
- 53.Kelley AE, Baldo BA, Pratt WE, Will MJ. Corticostriatal-hypothalamic circuitry and food motivation: integration of energy, action and reward. Physiol Behav 2005;86:773–95. [DOI] [PubMed] [Google Scholar]
- 54.Berridge KC, Ho CY, Richard JM, DiFeliceantonio AG. The tempted brain eats: pleasure and desire circuits in obesity and eating disorders. Brain Res 2010;1350:43–64. [DOI] [PMC free article] [PubMed] [Google Scholar]
- 55.Liu S, Borgland SL. Regulation of the mesolimbic dopamine circuit by feeding peptides. Neuroscience 2015;289:19–42. [DOI] [PubMed] [Google Scholar]
- 56.Schultz W. Predictive reward signal of dopamine neurons. J Neurophysiol 1998;80:1–27. [DOI] [PubMed] [Google Scholar]
- 57.Stoeckel LE, Weller RE, Cook EW, Twieg DB, Knowlton RC, Cox JE. Widespread reward-system activation in obese women in response to pictures of high-calorie foods. Neuroimage 2008;41:636–47. [DOI] [PubMed] [Google Scholar]
- 58.Stice E, Spoor S, Bohon C, Small DM. Relation between obesity and blunted striatal response to food is moderated by TaqIA A1 allele. Science 2008;322:449–52. [DOI] [PMC free article] [PubMed] [Google Scholar]
- 59.Stice E, Burger KS, Yokum S. Reward region responsivity predicts future weight gain and moderating effects of the TaqIA allele. J Neurosci 2015;35:10316–24. [DOI] [PMC free article] [PubMed] [Google Scholar]
- 60.Blokland GA, de Zubicaray GI, McMahon KL, Wright MJ. Genetic and environmental influences on neuroimaging phenotypes: a meta-analytical perspective on twin imaging studies. Twin Res Hum Genet 2012;15:351–71. [DOI] [PMC free article] [PubMed] [Google Scholar]
- 61.Blokland GA, McMahon KL, Thompson PM, Martin NG, de Zubicaray GI, Wright MJ. Heritability of working memory brain activation. J Neurosci 2011;31:10882–90. [DOI] [PMC free article] [PubMed] [Google Scholar]
- 62.Pinel P, Dehaene S. Genetic and environmental contributions to brain activation during calculation. Neuroimage 2013;81:306–16. [DOI] [PubMed] [Google Scholar]
- 63.Karra E, O’Daly OG, Choudhury AI, Yousseif A, Millership S, Neary MT, Scott WR, Chandarana K, Manning S, Hess ME, et al. A link between FTO, ghrelin, and impaired brain food-cue responsivity. J Clin Invest 2013;123:3539–51. [DOI] [PMC free article] [PubMed] [Google Scholar]
- 64.Heni M, Kullmann S, Veit R, Ketterer C, Frank S, Machicao F, Staiger H, Haring HU, Preissl H, Fritsche A. Variation in the obesity risk gene FTO determines the postprandial cerebral processing of food stimuli in the prefrontal cortex. Mol Metab 2014;3:109–13. [DOI] [PMC free article] [PubMed] [Google Scholar]
- 65.Wardle J, Carnell S, Haworth CM, Farooqi IS, O’Rahilly S, Plomin R. Obesity associated genetic variation in FTO is associated with diminished satiety. J Clin Endocrinol Metab 2008;93:3640–3. [DOI] [PubMed] [Google Scholar]