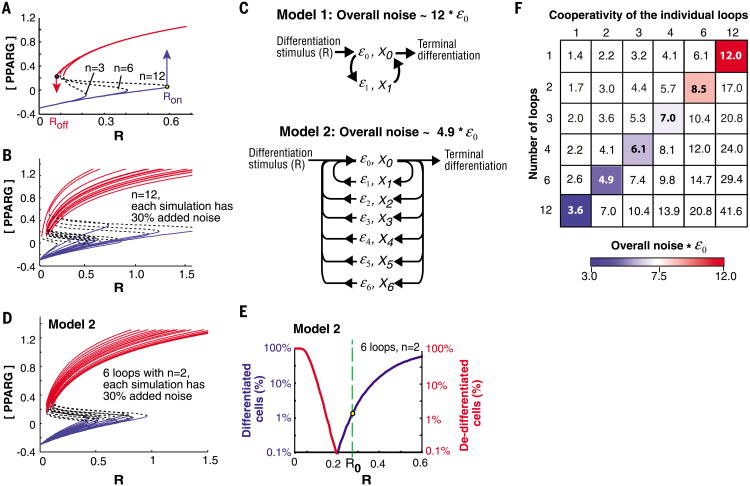
Fig. 2. A protein architecture that can regulate a 10% annual renewal rate.
(A) Steady-state plots when the cooperativity, n, is increased. (B) Sample steady-state plots for a system with a single high cooperative feedback loop (n = 12) and 30% log-normal noise added to each simulation. (C) Schematic of two system architectures that have the same overall cooperativity but different overall noise. Model 1 has one feedback loop with a cooperativity of 12. Model 2 has six positive feedback loops, each with a cooperativity of 2. (D and E) Simulation results for model 2. An average of 30% log-normal noise was randomly added to each simulation. (D) Sample steady-state curves. Plotting the curves with R on a log-scale shows that the variability in Ron and Roff is similar (fig. S1C). (E) Results of 20,000 simulations showing that such a system can maintain tissue size. At the low differentiation rate needed to renew adipose tissue (1.65%, yellow dot), less than 0.1% of differentiated cells would lose the differentiated state. (F) The matrix shows the overall system noise as a function of number of feedback loops versus cooperativity of the individual loops. The colored boxes mark systems with the same total cooperativity (n = 12), but with decreasing system noise as the number of feedback loops increases.

