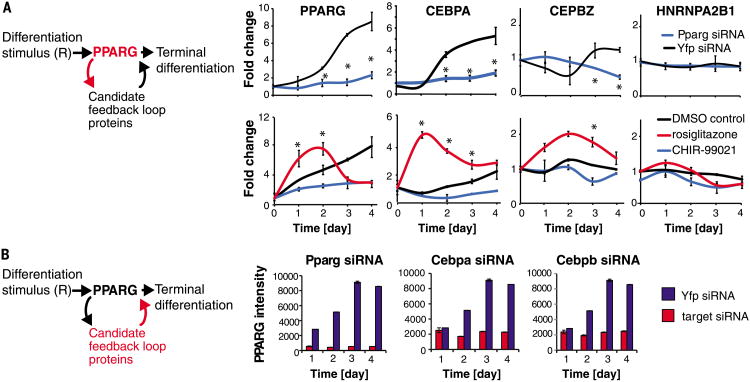
Fig. 3. A method to systematically uncover feedback loops in a protein network.
(A) SRM-MS was used to measure changes in nuclear protein concentrations over the timecourse of adipogenesis in response to siRNA or chemical perturbations to PPARG (see also figs. S10 to S12). OP9 preadipocytes were induced to differentiate into mature adipocytes in 4 days by addition of the adipogenic cocktail (dexamethasone, isobutylmethylxanthine, and insulin). (Top) Cells were transfected with siRNA targeting PPARG (blue) or yellow fluorescent protein (YFP) as a control (black) 24 hours before addition of the adipogenic factors. (Bottom) A PPARG agonist (rosiglitazone) or PPARG inhibitor (CHIR-99021) was added together with the adipogenic mix. All values were normalized to the control value at day 0. Each data point is the average of three biological replicates (error bars show standard deviation). A protein was classified as regulated by PPARG activity if its abundance in the perturbed versus control (YFP) samples varied significantly at one or more time points, P < 0.05 (*) calculated using the student's t test, two-tailed, two-sample equal variance. (B) siRNA-mediated depletion of the candidate feedback loop partners was used to determine which ones regulate PPARG. The knockdown effect in OP9 cells was measured by immunocytochemistry staining for PPARG. Each bar in the plots represents ∼10,000 cells. Error bars show standard error. See also fig. S13.

