SUMMARY
Background
Vascular calcification (VC) is a strong prognostic marker of mortality from cardiovascular disease. Extracellular inorganic pyrophosphate (PPi) is a critical inhibitor of vascular calcification and it has been reported that hemodialysis patients have reduced plasma PPi levels, suggesting that altered PPi metabolism could contribute to VC in hemodialysis patients. Platelets are rich in PPi and release of PPi from platelets during storage or processing of plasma can lead to falsely elevated plasma PPi levels. To prepare plasma samples that are suitable for measuring PPi levels, ultracentrifugation has been used to remove platelets. Consequently, plasma PPi measurements have been limited to research laboratories since the majority of clinical laboratories do not have access to an ultracentrifuge. The purpose of the present study was to test the validity of an improved method of preparing platelet free plasma that uses filtration with a 300,000 Dalton molecular weight cut-off filter to exclude platelets, while minimizing their release of PPi.
Methods
In 20 maintenance hemodialysis patients, PPi levels were measured in plasma samples prepared by the conventional technique of low-speed centrifugation to remove red and white blood cells versus a novel filtration technique.
Results
Plasma prepared by filtration had significantly lower platelet counts (0 vs. 3 – 7 103/μL) and PPi levels (1.39 ± 0.30 μM vs. 2.74 ± 1.19 μM; mean ± SD, p < 0.01).
Conclusions
The filtration method appears effective in excluding platelets without causing trauma to platelets and can be used by clinical laboratories to prepare platelet-depleted plasma for PPi measurement.
Keywords: Pyrophosphate, filtration method, hemodialysis, platelet free plasma, vascular calcification
INTRODUCTION
Vascular calcification (VC) is a strong prognostic marker of mortality due to cardiovascular disease in CKD patients [1,2]. Although the mechanism of calcification is not completely understood, it is clear from in vitro, animal, and human studies that extracellular inorganic pyrophosphate plays a key role [1,3–10]. Pyrophosphate (PPi) is a critical inhibitor of vascular calcification that is present in human plasma at levels that inhibit vascular calcification in vitro. Additionally, plasma PPi levels are reduced in hemodialysis patients and correlate with vascular calcification and in some patients PPi levels were below those that have previously been shown to prevent calcification of vessels in culture [11–13]. Fleisch et al. have reported that PPi inhibits calcification in aortas and kidneys of rats treated with a large amount of vitamin D3 [14,15].
Platelets are a rich source of PPi and release of intracellular pyrophosphate occurs in serum samples due to lysis of platelets leading to falsely elevated levels. Therefore, in order to accurately estimate circulating PPi levels, it is necessary to measure PPi in platelet-depleted plasma [16]. At the present time, standard methods for measuring plasma PPi require removal of platelets by use of ultracentrifugation [17]. Consequently, plasma PPi measurements have been limited to research laboratories since the majority of clinical laboratories do not have access to an ultracentrifuge.
There is an unmet need for a simple method to prepare platelet-depleted plasma using equipment readily available in clinical laboratories. Gupta et al. have previously described a simple method to prepare platelet-free plasma using a serum fractionating centrifuge tube and a tabletop centrifuge, and compared this novel method versus the currently used ultracentrifugation method to estimate plasma PPi levels in normal volunteers [18]. The purpose of the present study is to validate this simple filtration method for the preparation of platelet-free plasma and to measure plasma PPi.
MATERIALS AND METHODS
Subjects
Measurements were made in platelet-rich residue samples and platelet-free plasma samples from 20 patients undergoing hemodialysis at the dialysis unit in El Paso, TX, USA. The research was carried out according to the principles of the Declaration of Helsinki. Informed consent was obtained after a description of the procedures and purpose of the study. Results reported here are part of a larger study, which was approved by our institutional review board.
Plasma Samples
A 6 mL blood sample was drawn from the venous side of the hemodialysis access, before beginning routine hemodialysis, and saved in an ice-cold plastic vacutainer tube treated with sodium heparin. Heparin was used as anticoagulant since EDTA has been shown to interfere with the PPi assay [11]. Ryan et al. have shown that physical trauma from venipuncture can cause artificially high PPi concentrations because of the release of PPi from platelets; consequently samples were drawn directly from dialysis access to minimize this effect [17]. Samples were kept on ice until they were centrifuged at 2000g for 20 minutes using a refrigerated centrifuge at 4°C (Beckman GS-6R) to isolate plasma from whole blood.
Preparation of platelet-free plasma
About 2 – 2.5 mL of plasma, collected as described above, was placed into the outer tube of a pre-cooled Centrisart I® tube (13279-E, Sartorius AG, Germany) and prepared according to manufacturer’s instructions. Average time interval between collection of the blood samples and beginning of filtration was about 1.5 hours. The Centrisart I filtration tube contains a polyethersulfone (PES) filter with a 300,000 molecular weight cutoff. The Centrisart tubes were centrifuged at 2000g for 20 minutes at 4°C. Filtration of plasma in the outer tube, across the PES filter led to collection of platelet-free plasma into the inner tube. Platelet free plasma was stored at −70°C for further testing. Platelet-enriched residual plasma samples were retained in the outer tube of the Centrisart I tube and stored at −70°C for further testing. Samples were shipped in dry ice to Emory University, Atlanta, GA, USA for assay of PPi.
Measurement of plasma PPi levels
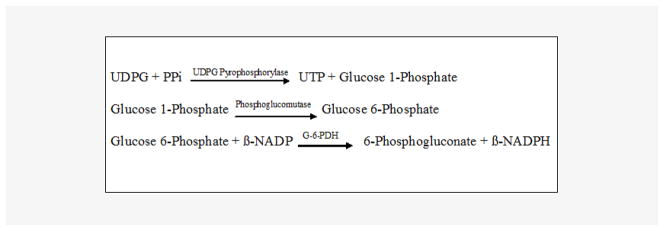
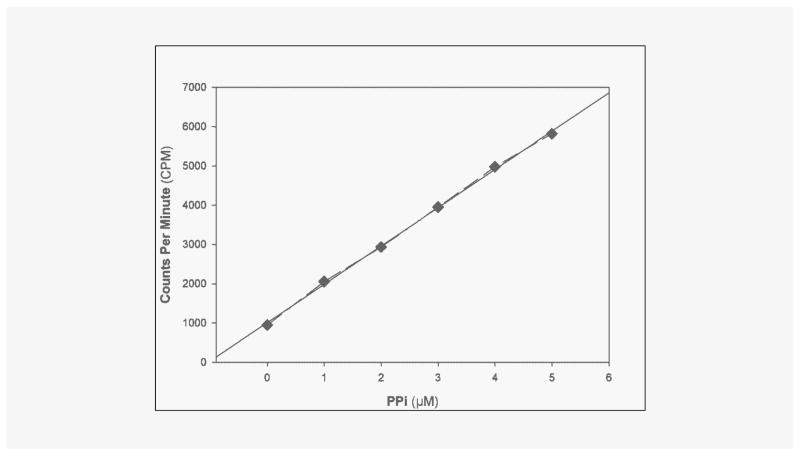
PPi was measured by an enzymatic assay using uridine-disphosphoglucose (UDPG) pyrophosphate as described by Cheung et al. [19] and O’Neill et al. [12] with modifications. Excess uridine 5′-diphospho [14C] glucose reacts with PPi to yield [14C] glucose-1-phosphate, catalyzed by uridine 5′-diphosphoglucose (UDPG) pyro-phosphorylase. Phosphoglucose mutase and glucose 6-phosphate dehydrogenase are used to drive the reaction to completion. The final reaction product, 6-phospho [14C] gluconic acid, is separated from uridine dispospho [14C] glucose by the addition of activated charcoal, which absorbs uridine disphospho [14C] glucose. (Figure 1) AMP, ADP, and ATP are added to the assay to minimize hydrolysis of the substrate by nucleotidases. Paired samples are assayed with and without UDPG pyrophosphorylase to determine the signal specific for PPi. All reagents were made with water eluted through a column of hydroxyapatite to remove contaminating PPi. Reagent [14C] UDPG was obtained from Perkin-Elmer (Boston, MA, USA). All other reagents were obtained from Sigma-Aldrich Chemicals (St. Louis, MO, USA). A sample (20 μL) was added to 100 μL of reaction buffer that contained 90 mM KCl, 5 mM MgCl2, 70 mM Tris-HCl (pH 7.60), 3.7 μM UDPG, 0.15 μCi/mL [14C] UDPG, 10 μM NADPH, 100 μM AMP, 50 μM ADP, and 50 μM ATP, 0.25 U/mL UDPG pyrophosphorylase (Type X from baker’s yeast), 2.5 U/mL phosphoglucomutase (from rabbit muscle), and 0.5 U/mL glucose-6-phosphate dehydrogenase (Type XV from baker’s yeast). After 30 minutes at 37°C, 200 μL of 3% activated charcoal was added on ice with occasional stirring to bind residual UDPG. After centrifugation, the radioactivity in 200 μL of supernatant was counted. Standards of PPi were run in parallel (0.3–5.0 μM). The standard curve for PPi is presented in Figure 2, showing sensitivity below 1 μM.
Figure 1.
Key chemical reactions in radiometric enzymatic assay for measurement of pyrophosphate (PPi).
Abbreviations: UDPG = Uridine 5′-Diphosphoglucose, PPi = Inorganic Pyrophosphate, UTP = Uridine 5′-Triphosphate, β-NADP = β-Nicotinamide Adenine Dinucleotide Phosphate, Oxidized Form, β-NADPH = β-Nicotinamide Adenine Dinucleotide Phosphate, Reduced Form, G-6-PDH = Glucose-6-Phosphate Dehydrogenase
Figure 2.
Standard Curve for PPi assay. Linear Regression: y = 974.72x +1011 r2 = 0.9989.
RESULTS
Initial studies were performed to identify and mitigate potential sources of error in this complex enzyme assay, including contamination of enzyme preparations with PPi, metabolism of the substrate by other enzymes present in plasma, and lack of specificity by UDPG pyrophosphorylase. This was investigated by performing the assays with or without UDPG pyrophosphorylase. Blank samples containing only water gave a signal that was reduced when the enzyme was omitted, suggesting contamination with PPi. This was substantially reduced by using PPi-free water for all reagents. However, there was still a small signal that is probably due to PPi contamination of the enzyme preparations.
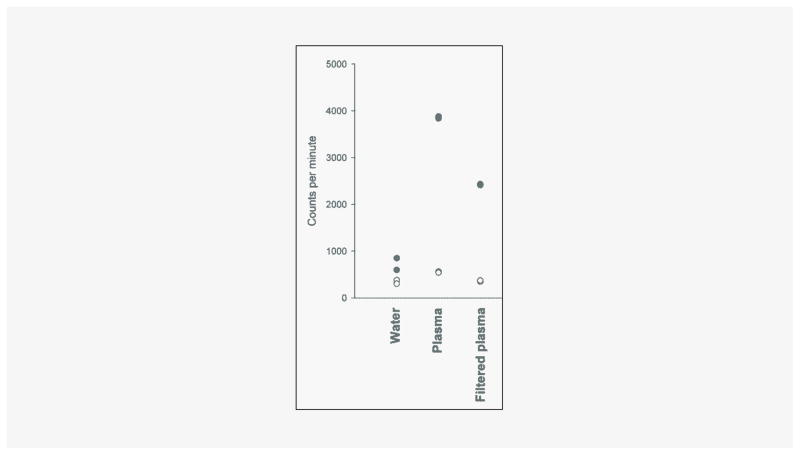
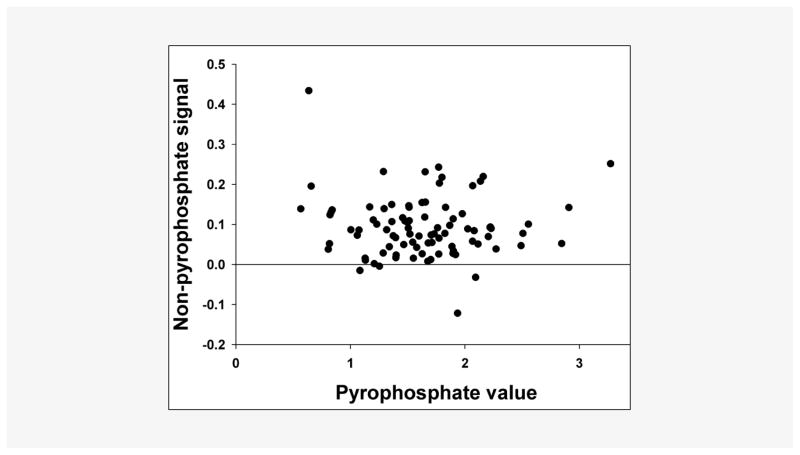
Platelets were quantified in four samples by fluorescent flow cytometry (Sysmex XE 5000), which revealed approximately 3 – 7 103/μL platelets in platelet-rich residual samples and no platelets in the platelet-free samples. As shown in Figure 3, filtration of plasma substantially reduced the PPi signal in the assay. There was also some reduction of the PPi-independent signal. This PPi-independent signal varied between samples but there was no correlation with the PPi signal (Figure 4). Reproducibility of the measurement of platelet-free PPi was tested by repeating the assay 5 times in a single sample, which yielded a coefficient of variation of 10.5%. To ensure that filtration was not lowering PPi levels due to binding of PPi to the filter, assays were performed on samples with or without 5 μM PPi added to plasma prior to filtration. In plasma samples from 4 normal subjects, there was 98 ± 2% recovery of PPi in the filtered plasma.
Figure 3.
PPi assay performed in duplicate with (solid symbols) and without (open symbols) UDPG pyrophosphorylase. A single sample of normal human plasma was assayed before and after filtration as described in the methods.
Figure 4.
Non-PPi signal in the PPi assay. Filtered human plasma samples were assayed with and without UDPG pyrophosphorylase and values in the absence of enzyme (non-PPi signal; ordinate) are compared with the difference between the values obtained with and without enzyme (PPi signal; abscissa). (n = 86).
PPi was measured in plasma from 20 subjects with end-stage renal disease requiring maintenance hemodialysis. Subjects were 59 ± 7.3 years of age (mean ± SEM) range 48–75 yrs, 75% male, 70% diabetic, and 90% Hispanic. PPi was significantly lower in filtered plasma than in residual plasma samples: 1.39 ± 0.30 μM vs. 2.74 ± 1.19 μM (mean ± SD), p < 0.01 by Wilcoxon Signed Rank test (Table 1). There was a poor correlation between platelet-rich residual plasma and platelet-free plasma measurements (r = 0.32).
Table 1.
PPi levels in plasma samples from 20 hemodialysis patients.
| Samples | Platelet enriched residual plasma PPi [μM] | Platelet free plasma PPi [μM] |
|---|---|---|
| 1 | 2.27 | 1.34 |
| 2 | 2.66 | 1.36 |
| 3 | 4.78 | 1.65 |
| 4 | 2.11 | 1.44 |
| 5 | 1.72 | 0.78 |
| 6 | 6.12 | 1.41 |
| 7 | 4.32 | 1.89 |
| 8 | 1.50 | 1.03 |
| 9 | 2.23 | 1.16 |
| 10 | 3.98 | 1.16 |
| 11 | 3.37 | 1.30 |
| 12 | 2.19 | 1.09 |
| 13 | 1.68 | 1.01 |
| 14 | 2.20 | 1.84 |
| 15 | 2.50 | 1.31 |
| 16 | 2.45 | 1.70 |
| 17 | 1.85 | 1.33 |
| 18 | 2.12 | 1.53 |
| 19 | 2.53 | 1.53 |
| 20 | 2.20 | 1.87 |
| Mean ± SD | 2.74 ± 1.19 | 1.39 ± 0.30 |
p < 0.01, Wilcoxon Signed Rank test for paired data
DISCUSSION
Since pyrophosphate plays an important role in preventing vascular calcification, there is a need for accurate measurements in plasma. Over the past forty years, several techniques for measuring PPi have been reported and the major obstacles are the low levels in plasma, the high levels in platelets, and the need for enzyme-based assays. We have developed a plasma assay that minimizes PPi contamination and non-PPi interference, permitting accurate measurements of plasma PPi. In particular, filtration to remove platelets resulted in significantly lower and less variable PPi levels. Since there was no appreciable binding of PPi to the filters, this can only be explained by removal of platelets. This confirms previous reports that plasma samples may overestimate the true levels of extracellular PPi in the circulation due to its release from platelets during analysis. Platelet-rich residual plasma PPi levels were comparable to those reported elsewhere in similar subjects requiring hemodialysis: 2.26 ± 0.19 μM (mean ± SE) and 3.0 ± 1.1 μM (mean ± SD) [11,12]. These lower values are consistent with the report by Caines et al. who directly quantified [PPi] in both platelets and plasma [20]. The simplified method of removing residual platelets demonstrated here, together with improvements in the assay to eliminate PPi contamination and non-PPi signals, can provide results that are more representative of the true circulating values of PPi in vivo.
Acknowledgments
The investigators would like to thank Stephanie Paico and Hani Atallah for data entry and Faten Hassounah for technical assistance with the assay.
Funding:
Paul L. Foster School of Medicine Seed Grant and Lizanell & Colbert Coldwell Foundation Grant to R.T.
NIH Grant DK069681 to W.C.O.
NIH/NIDDK 5-R01-DK066361-01 to AG.
Footnotes
Declaration of Interest:
None
References
- 1.Jono S, Shioi A, Ikari Y, Nishizawa Y. Vascular calcification in chronic kidney disease. J Bone Miner Metab. 2006;24(2):176–81. doi: 10.1007/s00774-005-0668-6. [DOI] [PubMed] [Google Scholar]
- 2.Merjanian R, Budoff M, Adler S, Berman N, Mehrotra R. Coronary artery, aortic wall, and valvular calcification in nondialyzed individuals with type 2 diabetes and renal disease. Kidney Int. 2003;64(1):263–71. doi: 10.1046/j.1523-1755.2003.00068.x. [DOI] [PubMed] [Google Scholar]
- 3.Fleisch H, Russell RG, Straumann F. Effect of pyrophosphate on hydroxyapatite and its implications in calcium homeostasis. Nature. 1966;212(5065):901–3. doi: 10.1038/212901a0. [DOI] [PubMed] [Google Scholar]
- 4.Russell RG, Fleisch H. Inorganic pyrophosphate and pyrophosphatases in calcification and calcium homeostasis. Clin Orthop Relat Res. 1970;69:101–17. [PubMed] [Google Scholar]
- 5.Fleisch H, Russell RG. A review of the physiological and pharmacological effects of pyrophosphate and diphosphonates on bones and teeth. J Dent Res. 1972;51(2):324–32. doi: 10.1177/00220345720510021701. [DOI] [PubMed] [Google Scholar]
- 6.Wuthier RE, Bisaz S, Russell RG, Fleisch H. Relationship between pyrophosphate, amorphous calcium phosphate and other factors in the sequence of calcification in vivo. Calcif Tissue Res. 1972;10(3):198–206. doi: 10.1007/BF02012549. [DOI] [PubMed] [Google Scholar]
- 7.Derici U, El Nahas AM. Vascular calcifications in uremia: old concepts and new insights. Semin Dial. 2006;19(1):60–8. doi: 10.1111/j.1525-139X.2006.00120.x. [DOI] [PubMed] [Google Scholar]
- 8.Alfrey AC, Solomons CC, Ciricillo J, Miller NL. Extraosseous calcification. Evidence for abnormal pyrophosphate metabolism in uremia. J Clin Invest. 1976;57(3):692–9. doi: 10.1172/JCI108326. [DOI] [PMC free article] [PubMed] [Google Scholar]
- 9.Rüfenacht HS, Fleisch H. Measurement of inhibitors of calcium phosphate precipitation in plasma ultrafiltrate. Am J Physiol. 1984;246(5 Pt 2):F648–55. doi: 10.1152/ajprenal.1984.246.5.F648. [DOI] [PubMed] [Google Scholar]
- 10.Harmey D, Hessle L, Narisawa S, Johnson KA, Terkeltaub R, Millán JL. Concerted regulation of inorganic pyrophosphate and osteopontin by akp2, enpp1, and ank: an integrated model of the pathogenesis of mineralization disorders. Am J Pathol. 2004;164(4):1199–209. doi: 10.1016/S0002-9440(10)63208-7. [DOI] [PMC free article] [PubMed] [Google Scholar]
- 11.Lomashvili KA, Khawandi W, O’Neill WC. Reduced plasma pyrophosphate levels in hemodialysis patients. J Am Soc Nephrol. 2005;16(8):2495–500. doi: 10.1681/ASN.2004080694. [DOI] [PubMed] [Google Scholar]
- 12.O’Neill WC, Sigrist MK, McIntyre CW. Plasma pyrophosphate and vascular calcification in chronic kidney disease. Nephrol Dial Transplant. 2010;25(1):187–91. doi: 10.1093/ndt/gfp362. [DOI] [PMC free article] [PubMed] [Google Scholar]
- 13.Lomashvili KA, Cobbs S, Hennigar RA, Hardcastle KI, O’Neill WC. Phosphate-induced vascular calcification: role of pyrophosphate and osteopontin. J Am Soc Nephrol. 2004;15(6):1392–401. doi: 10.1097/01.asn.0000128955.83129.9c. [DOI] [PubMed] [Google Scholar]
- 14.Schibler D, Russell RG, Fleisch H. Inhibition by pyrophosphate and polyphosphate of aortic calcification induced by vitamin D3 in rats. Clin Sci. 1968;35(2):363–72. [PubMed] [Google Scholar]
- 15.Hausmann E, Bisaz S, Russel RG, Fleisch H. The concentration of inorganic pyrophosphate in human saliva and dental calculus. Arch Oral Biol. 1970;15(12):1389–92. doi: 10.1016/0003-9969(70)90029-4. [DOI] [PubMed] [Google Scholar]
- 16.Silcox DC, Jacobelli S, McCarty DJ. Identification of inorganic pyrophosphate in human platelets and its release on stimulation with thrombin. J Clin Invest. 1973;52(7):1595–600. doi: 10.1172/JCI107336. [DOI] [PMC free article] [PubMed] [Google Scholar]
- 17.Ryan LM, Kozin F, McCarty DJ. Quantification of human plasma inorganic pyrophosphate. II. Biologic variables. Arthritis Rheum. 1979;22(8):892–5. doi: 10.1002/art.1780220813. [DOI] [PubMed] [Google Scholar]
- 18.Patent application publication. USA: 2009. [Google Scholar]
- 19.Cheung CP, Suhadolnik RJ. Analysis of inorganic pyrophosphate at the picomole level. Anal Biochem. 1977;83(1):61–3. doi: 10.1016/0003-2697(77)90510-3. [DOI] [PubMed] [Google Scholar]
- 20.Caines PSM, Thibert RJ, Draisey TF. An improved fluorometric coupled enzymatic method for the determination of pyrophosphate in plasma and platelets. Microchemical Journal. 1984;29(2):168–81. [Google Scholar]


