

Summary
Neurexins are considered central organizers of synapse architecture that are implicated in neuropsychiatric disorders. Expression of neurexins in hundreds of alternatively spliced isoforms suggested that individual neurons might exhibit a cell type-specific neurexin expression pattern (a neurexin code). To test this hypothesis, we quantified the single-cell levels of neurexin isoforms and other trans-synaptic cell-adhesion molecules by microfluidics-based RT-PCR. We show that the neurexin repertoire displays pronounced cell-type specificity that is remarkably consistent within each type of neuron. Furthermore, we uncovered region-specific regulation of neurexin transcription and splice-site usage. Finally, we demonstrate that the transcriptional profiles of neurexins can be altered in an experience-dependent fashion by exposure to a drug of abuse. Our data provide evidence of cell type-specific expression patterns of multiple neurexins at the single-cell level, and suggest that expression of synaptic cell-adhesion molecules overlaps with other key features of cellular identity and diversity.
Keywords: neurexin, single-cell, transcriptional profiling, splicing, synaptic adhesion molecule, cell-type
Introduction
Normal brain function relies on the precise development of neuronal circuits – specific cellular ensembles that exhibit stereotyped patterns of connectivity and synaptic functionality (Klausberger and Somogyi, 2008). This organization requires exquisitely orchestrated developmental programs linking neuronal cell-type specification to the targeting and formation of synapses with unique functional characteristics (Duan et al., 2014). The neurexin family of synaptic adhesion molecules, which are extensively linked to neuropsychiatric disease, have been proposed to organize synaptic function throughout the nervous system (Missler et al., 2003; Südhof, 2008). The large genomic footprint of the three neurexin molecules exhibits astounding complexity, including alternative promoter usage, extensive splice-site regulation, and large intronic segments (Tabuchi and Südhof, 2002). The extensive transcriptional diversity generated from these genes makes it possible that neurexin proteins serve as molecular backbones supporting multiple trans-synaptic interactions in individual synapses, which have unique properties throughout the brain. A central implication of this hypothesis is that neurexin mRNA expression should be tightly regulated and unique to each cell type in the circuit – a premise that we directly test here by employing single-cell analysis of neurexin transcriptional and splice-site isoforms as well as those of other families of synaptic cell-adhesion molecule.
Neurexin protein diversity is achieved through transcriptional and post-transcriptional regulation (Ushkaryov et al., 1992; Ullrich et al., 1995). All neurexin genes (Nrxn1-Nrxn3 in mice, NRXN1-NRXN3 in humans) employ two promoters that generate long (α) and short (β) transcripts (Tabuchi and Südhof, 2002; Ushkaryov et al., 1992; Ushkaryov and Südhof, 1993). In addition, six canonical sites of alternative splicing in α-neurexins and two such sites in β-neurexins, if utilized independently, potentially generate thousands of distinct isoforms (Ullrich et al., 1995), a hypothesis that was confirmed by recent studies employing long single molecule sequencing (Treutlein et al., 2014; Schreiner et al., 2014). Crystal structures of Nrxn1α and Nrxn1β have revealed that alignment of their domains creates multiple binding pockets capable of interacting with several proteins, thereby mediating neurexin function as a synaptic “hub” molecule (Araç et al., 2007; Chen et al., 2010; Colometti et al., 2010; Chen et al., 2011). The alternatively spliced sequences often line these binding pockets, thus modulating neurexin binding activities. These data suggest that through regulation of neurexin mRNA expression and alternative splicing, neurons modulate binding to a series of trans-synaptic partners to sculpt synaptic connectivity and function (Aoto et al., 2013; Boucard et al., 2005; Siddiqui et al., 2010; Soler-Llavina et al., 2013; Soler-Llavina et al., 2011; Treutlein et al., 2014). To date, the diversity of neurexin mRNA expression has been explored by in-situ hybridization as well as by global analysis of mRNA isolated from dissected tissue, using both direct sequencing and quantitative RT-PCR (Ullrich et al., 1995; Aoto et al., 2013; Treutlein et al., 2014; Schreiner et al., 2014). However, while current single-molecule deep sequencing approaches have identified predominant neurexin mRNA species, they lacked cellular resolution, and do not reveal the expression of specific neurexin isoforms in particular types of neurons.
The role for neurexins in regulating synaptic diversity of microcircuits likely takes place on a cell-by-cell basis, therefore requiring techniques that assess mRNA expression of individual neurons to fully understand the role of neurexins in circuit formation and function. At single-cell resolution, the unanswered questions are numerous – does neurexin diversity manifest at the single cell level and if so, what are the relative contributions of transcriptional regulation and alternative splicing? Are neurexin transcription profiles common within specific circuits, or does each functional unit have unique transcript patterns? How is neurexin expression related to that of other pre- and postsynaptic adhesion modules? Finally, are cellular neurexin transcription profiles static or can they be remodeled by behavioral experience? The present study leverages current advances in single-cell transcription profiling with genetic tools for circuit dissection to examine the diversity of synaptic cell-adhesion molecule expression, and to assess how such diversity relates to specific cell types and patterns of connectivity. We find that neurexin transcriptional repertoires are cell-type specific but are not related to particular synaptic connections. Furthermore, neurexins display a brain-region specific coordination of alternative splicing at the single-cell level. Finally, we demonstrate that neurexin expression profiles are plastic in that they can be altered by exposure to drugs of abuse.
Results
Single-cell neurexin expression profiles are distinct from those observed in tissue samples
Our characterization of neurexin expression profiles of select neuronal circuits relied upon two methodologies – firstly, BAC transgenic mice or rabies-virus mediated retrograde tracing to select neurons that are constituents of a particular circuit by cell type or patterns of connectivity; secondly, the design and characterization of a library of quantitative PCR (qPCR) assays that could specifically detect splice isoforms of neurexin transcripts. Employing a Fluidigm microfluidics platform, we tested over 150 probes on cytosol of single neurons aspirated via a patch pipette from acute slices (Figure 1A). Probe-based qPCR assays were constructed to interrogate a substantial fraction of the numerous neurexin splice sites (Figure 1B). Splice-site specific primers were designed to detect omission of an intervening exon, designated as splice site out (ss-OUT), or inclusion of an intervening exon, splice site in (ss-IN) (Figure 1C). The amplification efficiency (Figure 1D) and specificity (Figure 1E) of all probes was tested on tissue mRNA from multiple brain regions as well as plasmids containing specific splice isoforms. Employing this strategy, we were able to generate a primer library encompassing the majority of potential neurexin mRNA variants, including specific splice isoforms and the two major transcriptional species for each neurexin gene (see Supplemental Table 1 for primer info).
Figure 1. Single-cell Neurexin transcriptional profiles are distinct from those observed in tissue samples.
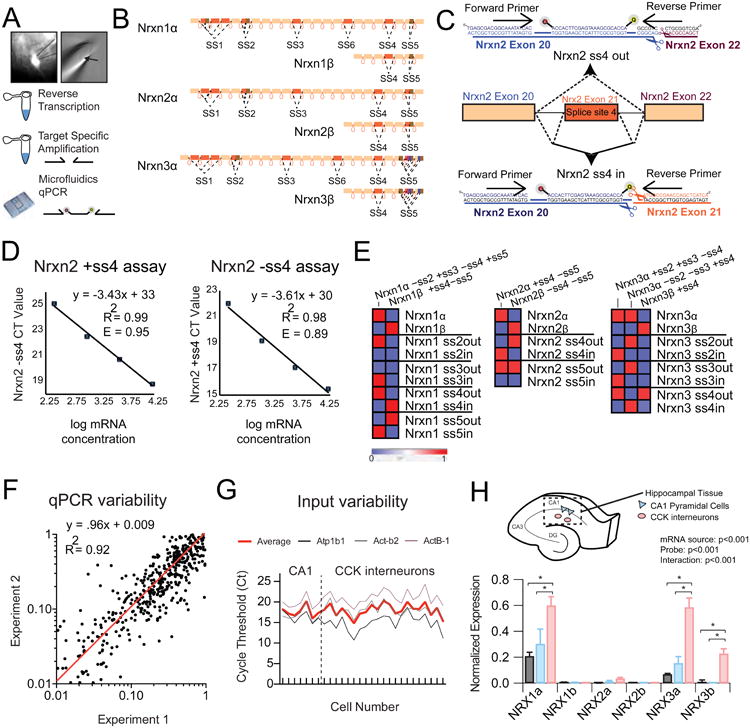
(A) Left: Image of 40x fluorescent field showing pipette extraction (solid outline) of GFP+ positive cell (dotted outline) from adult striatum. Right: Cellular contents and nucleus (arrow) within the extraction pipette. Bottom: General workflow from single cell extraction to target specific amplification of reverse-transcribed cDNA.
(B) Schematic depicting the genomic architecture of Nrxn1-3.
(C) An example strategy for the design of Nrxn2 ss4-specific primers is shown, which employs common forward primer and internal probe with unique reverse primer to differentiate inclusion or skipping of exon 21.
(D) Primer efficiency determination through plotting of cycle threshold (Ct) versus mRNA concentration in serial dilution.
(E) Heat map representation of cycle threshold for plasmid DNA with known splice-site content.
(F) Measurement of trial-to-trial qPCR variability (experiment 1 versus experiment 2) for all probes across single cell cDNAs (n=24) demonstrates a near linear fit (red line).
(G) Assessment of input variability for CA1 pyramidal cells and CCK+ interneurons by plotting of cycle threshold for 3 normalization probes across all collected single cells (3 probe average=red).
(H) Top: Schematic depicting mRNA isolation from hippocampal CA1 field for transcriptional analysis of hippocampal tissue (n=6) and individual CA1 pyramidal cells (n=7) or stratum radiatum CCK interneurons (n=22). (Bottom) Averaged normalized expression for the long and short neurexin transcriptional isoforms for hippocampal tissue and single cell populations.
Data are means + SEM; *significant difference between groups (ANOVA) with Tukey's multiple comparison post-hoc test.
To date, analysis of neurexin expression diversity has been performed exclusively on mRNA extracted from neuronal tissue and cultured neurons, potentially masking cell type- and circuit-specific differences (Ullrich et al., 1995; Aoto et al., 2013; Treutlein et al., 2014; Schreiner et al., 2014;). To reliably uncover patterns of neurexin mRNA expression at the single neuron level, it is essential to minimize the experimental variability introduced by inconsistencies in qPCR detection or cytosolic input material. Replication experiments on a subset of single cell cDNA samples demonstrated a nearly linear fit between qPCR runs, suggesting microfluidics-based transcript detection is reliable from trial to trial (Figure 1F). Furthermore, initial cytosolic mRNA input was largely consistent across single cells, as judged by average cycle threshold values for three housekeeping probes used in subsequent normalization steps (Figure 1G). To test whether our approach can differentiate neurexin expression at the single-cell level from that of the surrounding tissue, we compared the transcriptional profiles of the α- and β-variants of Nrxn1, Nrxn2, and Nrxn3 from micro-dissected hippocampal CA1 tissue with single cells from the CA1 pyramidal layer or isolated putative cholecystokinin-positive (CCK+) interneurons within the stratum radiatum (Figure 1H). Single-cell mRNA extraction by somatic patch-pipette aspiration consistently reduced the level of detected glial transcripts, which are expectedly present in tissue samples (Supplementary Figure 1). Consistent with the preponderance of pyramidal cells in the CA1 field, tissue expression values of neurexins were similar to averaged single CA1 pyramidal cell expression levels (Figure 1H). In contrast, tissue expression levels clearly diverged from averaged putative CCK cells, a subclass of interneuron far less numerous than hippocampal pyramidal cells (Figure 1H). Perhaps due to its GC-rich sequence content, we were unable to reliably detect Nrxn2 isoforms both from tissue samples and single cells, prompting us to omit Nrxn2 from the remaining analyses (Figure 1H). Overall, these data suggest that single-neuron neurexin transcriptional analysis is feasible and robust, and can provide novel insights into the cellular regulation of synaptic cell-adhesion networks.
Neurexin expression repertoires exhibit pronounced cell-type specificity across multiple microcircuits
Our initial data suggest that CCK interneurons display neurexin transcriptional profiles that are distinct from surrounding CA1 pyramidal cells. To see if this transcriptional diversity is shared by other local circuit GABA'ergic interneurons in the stratum radiatum, we targeted another well-defined cell population for mRNA profiling: parvalbumin-positive (PV+) interneurons, which share postsynaptic targets with CCK cells but display highly divergent synaptic properties (Freund and Katona, 2007). PV-Cre mice were crossed with AI9 reporter mice to label the PV+ subclass, and the cytosol of fluorescent cells in close proximity to the CA1 hippocampal pyramidal cell layer was aspirated from acute hippocampal slices (Figure 2A) (Hippenmeyer et al., 2007; Madisen et al., 2010). We identified CCK+ cells based on their soma location— similar to PV+ cells—their larger soma sizes and absence of red fluorescence. While none of these characteristics are alone sufficient to identify these cell types, our single cell results demonstrated unique expression of markers previously associated with PV+ and CCK+ cells in this region (Figure 2B) (Földy et al., 2007; Freund, 2003). Despite having common pyramidal neuron targets, the neurexin transcriptional profiles of PV+ and CCK+ interneurons were highly distinct, with both Nrxn1α and Nrxn3α/β more abundantly expressed in CCK+ interneurons than in PV+ interneurons (Figure 2C,D).
Figure 2. Hippocampal interneurons exhibit cell-type specific neurexin expression patterns.
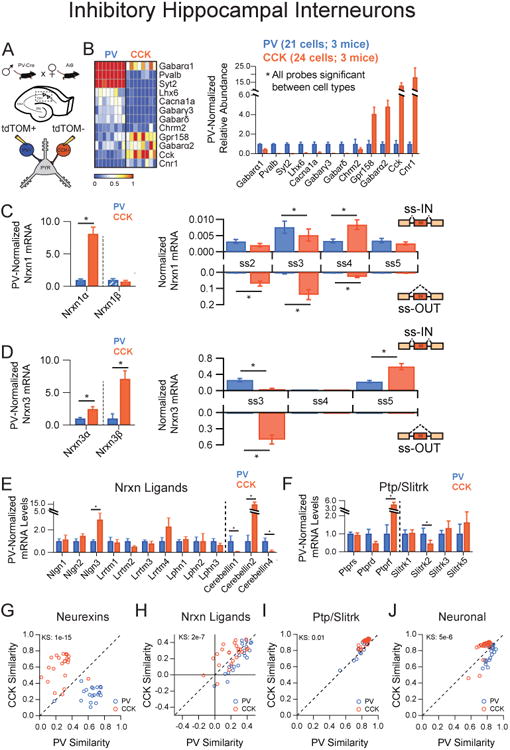
(A) Illustration of the genetic cross employed to label hippocampal interneurons for pipette extraction.
(B) Left: Heat map representation of normalized expression of PV+ and CCK+ interneurons for genes known to mark these subtypes. Right: Averaged single cell normalized expression for PV+ (n=21) and CCK+ (n=24).
(C,D) Left: Nrxn α/β isoform expression, normalized to the average level in PV+ cells (hatched PV bars designate expression value <1%). Right: Splice site graph showing averaged single cell splice isoform expression values for ss-IN (upward bars) and ss-OUT (downward bars).
(E,F) Averaged single cell normalized expression values for neurexin ligands (E, dotted line separates putative postsynaptic and secreted protein products) and the Ptp/Slitrk family (F, dotted line separates receptors from putative postsynaptic ligands).
(G-J) Pearson coefficient correlation plots demonstrating the similarity of individual neurons to the two cell classes being compared for neurexin (G), neurexin ligands (H), Ptp/Slitrk family (I) and general neuronal transcripts (J). Cells are color coded according to their known genetic identity. The dashed unity line represents cells that are equally similar to both cell types.
Data are means + SEM; *significant difference between groups (Mann Whitney U-test). Kolmogorav-Smirnov (KS) values are given for comparison of single cell groups in G-J.
Beyond the cell-type specific regulation of neurexin expression, further analysis revealed several instances of inverse splicing patterns between the two cell types – particularly for the third splice site (SS#3) of Nrxn1 and Nrxn3 (Figure 2C,D, right panels). To explore how other synaptic adhesion molecules were regulated compared with neurexin mRNAs, we analyzed the single cell expression of known neurexin ligands, of the protein tyrosine phosphatase receptors, and of Slitrk family proteins - all of which are proposed to participate in synaptic organizing complexes (Figure 2E,F) (Boucard et al., 2014; de Wit et al., 2009; Linhoff et al., 2009; Takahashi and Craig, 2013; Uemura et al., 2010). Similar to neurexin expression profiles, these synaptic adhesion molecules were differentially regulated between interneuron populations, as evidenced by differences in expression of Nlgn3, Cerebellins, Ptprs, and Slitrks.
To assess whether the expression profiles of neurexins were predictive of specific circuit constituents, we employed Pearson coefficient measurements of neurexin expression covariance between all single cells. Applying this metric to our data sets clearly demonstrated that neurexin expression profiles could reliably separate interneuron populations (Figure 2G). To assess whether this was a unique property of neurexin molecules, we again applied correlation analysis to the same single cell data, instead using probe sets representing neurexin ligands, the Ptpr and Slitrk families, or more general neuronal transcripts (Figure 2H-J; see Supplementary Figure 4A for probe definitions). Probe sets for each class could sort single cells into two distinct populations (Figure 2H-J), highlighting the extreme transcriptional diversity between interneuron populations with distinct properties (Tricoire et al., 2011).
We next tested whether cell-type specific regulation of synaptic cell-adhesion molecules was a general principle. To do so, we sought another brain structure with similar overall neurexin expression levels. Whole tissue analysis of prefrontal cortex (PFC), primary motor cortex (M1), ventral striatum, thalamus and cerebellum were compared to hippocampus across our entire synaptic cell-adhesion probe set (Supplementary Figure 2). We then chose to further explore the ventral striatum (also known as the nucleus accumbens (NAc)), as it displayed overall neurexin levels most similar to the hippocampus and comprises two major neuron subclasses whose mRNA expression profiles have been extensively characterized by FACs analysis and BAC-trap methodologies (Heiman et al., 2008; Lobo, 2009). Specifically, the major principal neurons of the ventral striatum are D1-receptor positive (D1R+) medium spiny neurons (MSNs) that send their axons to the ventral tegmental area, and D2-receptor positive (D2R+) MSNs that project to the ventral pallidum (Grueter et al., 2012).
To interrogate the neurexin profile of individual MSNs, we extracted cells from D1-Tomato BAC transgenic mice, which express td-Tomato exclusively in D1R+ MSNs (Figure 3A) (Shuen et al., 2008). Fluorescently labeled cells were positive for D1R transcripts while non-labeled cells strongly expressed D2R mRNAs (Figure 3B). Our single-cell data confirmed previous tissue-based expression analyses and assured us that visually guided pipette aspiration affords the precision to isolate single cells from a densely packed matrix of intermingling D1R+ and D2R+ MSNs (Figure 3B). Comparison of averaged single-cell neurexin expression levels between NAc D1R+ and D2R+ MSNs revealed significant cell-type specific differences for Nrxn1α and Nrxn3β (Figure 3C,D). In contrast to the large splice-site diversity of hippocampal interneuron cell types, MSN cell types were similar with the exception of Nrxn1 ss4 probes. Furthermore, expression of neurexin ligands and Ptpr and Slitrk molecules was similar between MSN cell types (Figure 3E,F), precluding accurate clustering by all transcriptional profiles except neurexins (Figure 3G-J). Taken together, these data indicate that cell-type specific components of two distinct neural circuits display unique neurexin transcriptional repertoires.
Figure 3. Nucleus accumbens medium spiny neurons exhibit cell-type specific neurexin expression patterns.
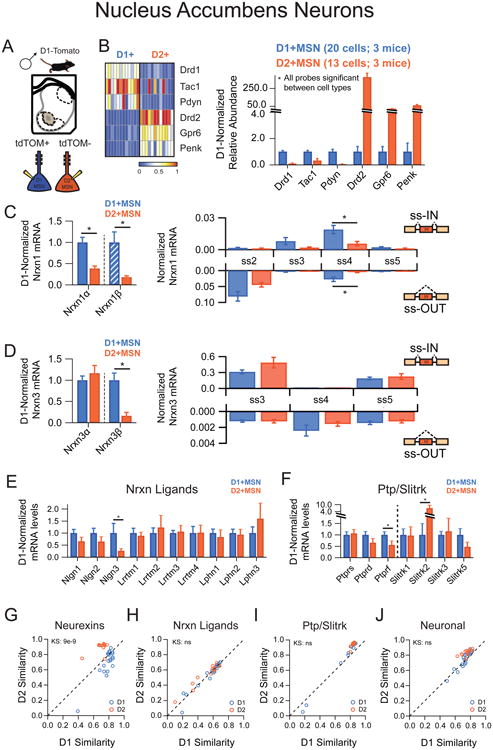
(A) Illustration of picking strategy to isolate D1R+ and D2R+ MSN subtypes
(B) Left: Heat map representation of normalized expression of D1R+ and D2R+ MSNs for genes known to mark these subtypes. Right: Averaged single cell normalized expression for D1R+ (n=20) and D2R+ (n=13).
(C,D) Left: Nrxnα/β isoform expression, normalized to the average level in D1R+ cells (hatched D1+MSN bars designate expression value <1%). Right: Splice site graph showing averaged single cell splice isoform expression values for ss-IN (upward bars) and ss-OUT (downward bars).
(E,F) Averaged single cell normalized expression values for neurexin ligands (E) and the Ptp/Slitrk family (F).
(G-J) Pearson coefficient correlation plots demonstrating the similarity of individual neurons to the two cell classes being compared for neurexins (G), neurexin ligands (H), Ptp/Slitrk family (I) and general neuronal transcripts (J). Cells are color coded according to D1R+ and D2R+ identity.
Data are means + SEM; *significant difference between groups (Mann Whitney U-test). Kolmogorav-Smirnov (KS) values are given for comparison of single cell groups in G-J.
Distinct neurexin splicing in neurons projecting to the same target
An alternative definition of cell type within neuronal circuits is the axonal target region (Kepecs and Fishell, 2014). Long-range projection neurons often have to navigate complex trajectories to reach specific areas where they eventually form synapses, and it is likely that they employ extensive molecular instructions to achieve this (Zipursky and Sanes, 2010). To see whether specific patterns of neurexin expression could be supporting long-range target specificity, we identified individual projection neurons with a defined target destination by retrograde viral labeling techniques. First, we addressed convergent projections that target a common post-synaptic area by employing rabies virus (RV)-mediated retrograde tracing of NAc inputs from the prefrontal cortex and midline thalamic nuclei, two major projection inputs to the ventral striatum (Groenewegen and Berendse, 1994; Groenewegen et al., 1997). Retrograde uptake of a mutated RV, in which the rabies glycoprotein was replaced by an EYFP cassette (RV(ΔG)-EYFP), labeled PFC and thalamic neurons with restricted vGlut1 and Slitrk6 expression, respectively (Figure 4A,B). Single-cell profiling demonstrated that despite their common synaptic target area, Nrxn3 transcriptional regulation was unique to each projection population (Figure 4D). While overall levels of Nrxn1α were similar in both populations, ss2 and ss4 inclusion appeared to be regulated in a projection-specific manner (Figure 4C). Overall, strong clustering of both populations was observed for multiple probe sets (Figure 4G-J), These data suggest that neurexin transcriptional profiles are not similar for neuronal populations with common projection targets.
Figure 4. Two NAc-targeting neuronal populations do not share neurexin expression Patterns.
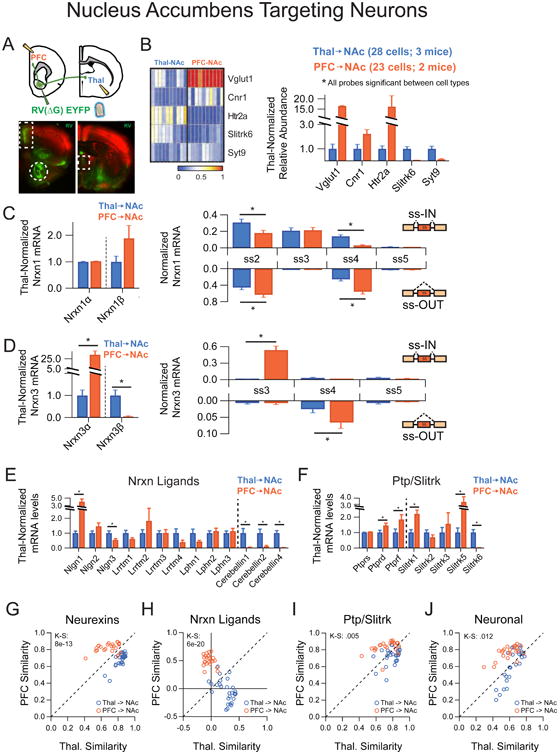
(A) Top: Strategy for single-cell isolation of NAc inputs by injection of RV(AG)-EYFP into the NAc core. Bottom: Retrograde synaptic uptake of RV by neurons in the PFC (boxed, left picture) and midline thalamic nuclei (boxed, right picture) following injection into NAc core (circle, left picture).
(B)Left: Heat map representation of normalized expression of Thal→NAc and PFC→NAc for genes known to mark these subtypes. Right: Averaged single cell expression for Thal→NAc (n=28) and PFC→NAc (n=23), normalized to Thal→NAc values.
(C,D) Left: Nrxn α/β isoform expression, normalized to the average level in Thal→NAc cells. Right: Splice site graph showing averaged single cell splice isoform expression values for ss-IN (upward bars) and ss-OUT (downward bars).
(E,F) Averaged single cell normalized expression values for neurexin ligands (E) and the Ptp/Slitrk family (F).
(G-J) Pearson coefficient correlation plots demonstrating the similarity of individual neurons to the two cell classes being compared for neurexins (G), neurexin ligands (H), Ptp/Slitrk family (I) and general neuronal transcripts (J). Cells are color coded according to Thal→NAc and Thal→NAc identity.
Data are means + SEM; *significant difference between groups (Mann Whitney U-test). Kolmogorav-Smirnov (KS) values are given for comparison of single cell groups in G-J.
To extend these findings and explore their generalizability, we profiled a functionally distinct neural circuit with an overall architecture similar to the NAc. We chose the dorsolateral striatum, as it is similarly composed of dopamine receptor-expressing MSNs that receive long-distance excitatory input from cortical regions and thalamic nuclei. Retrograde labeling via a RV expressing tdTomato (RV(ΔG)-tdTom) strongly labeled motor cortex and midline thalamus (Figure 5D). Isolated single neurons exhibited strikingly similar patterns of expression for regional markers that previously differentiated thalamic and cortical cells projecting to the NAc (compare Supplementary Figure 3B,F). To simplify our comparison across experiments, we distilled neurexin expression profiles to the major transcriptional isoforms of Nrxn1 and Nrxn3, as well as splice site 3, which previously demonstrated quantitative input-specific differences. While the overall transcriptional regulation of neurexins demonstrated similar input-specific patterns (compare Figure 5B,C with E,F), differences were observed in splice-site 3 regulation, particularly for Nrxn1 (Figure 5B,E, right panels). Taken together with the NAc data, it seems that cortical and thalamic domains have mRNA profiles that supersede specific circuit connectivity and that Nrxn1 and Nrxn3 transcriptional variants are part of this identity. However, specific splice isoforms of neurexins can be imposed on top of this regional code to create circuit-specific adhesion diversity.
Figure 5. Comparison of neurexin expression profiles across diverse striatal circuits.
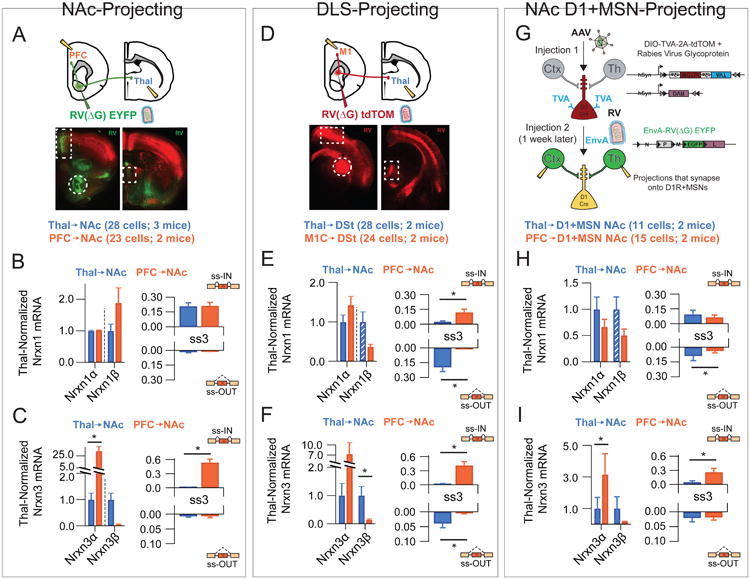
(A-C) Data for NAc RV injection have been reproduced from Figure 4 for comparison purposes. (D) Top: Strategy for single-cell isolation of DLS inputs by injection of RV(ΔG)-tdTOM into the DLS. Bottom: Retrograde synaptic uptake of RV by neurons in M1 (boxed, left picture) and midline thalamic nuclei (boxed, right picture) following injection into DLS (circle, left picture). Thalamus normalized expression of Nrxn1a/p (E, left) and Nrxn3a/p (F, left) in thalamo-(n=28) and cortico-(n=24) accumbal projection neurons and normalized expression of Nrx1α, splice-site 3 (E, right) and Nrxn3 a, splice-site 3 (F, right). (G) Top: Strategy for single-cell isolation of NAc D1R+MSN synaptic inputs by sequential injection procedure. Thalamus-normalized expression of Nrxn1α/β (H, left) and Nrxn3α/β (I, left) in thalamo-(n=11) and cortico-(n=15) accumbal projection neurons and normalized expression of Nrx1α, splice-site 3 (H, right) and Nrxn3 α, splice-site 3 (I, right).
Data are means + SEM; *significant difference between groups (Mann Whitney U-test).
Another possibility is that cortical and thalamic afferents display substantial bias in their connectivity within the striatum and differences in neurexin profiles simply reflect cell-type specific projections. To directly address this possibility, we employed a pseudotyped-RV system previously used to transynaptically trace inputs to genetically defined cell types (Whickersham, Neuron 2007; Wall, Neuron 2013). Stereotaxic injection into D1R-Cre mice of an adeno-associated virus (AAV) expressing a Crerecombinase sensitive TVA receptor allowed for D1R+MSN-specific uptake of EnvA-pseudotyped RV and subsequent retrograde synaptic transport (Figure 5G). Both mPFC and midline thalamus were synaptically connected to NAc D1R+MSNs (data not shown) and these neurons exhibited similar marker profiles to their region-specific counterparts (compare Supplemental Figure 3B,J). Despite restricting our analysis to a single postsynaptic cell type, we continued to observe a highly divergent pattern of neurexin transcriptional regulation (compare Figure 5B,C with H,I), strongly implying that postsynaptic targeting is not encoded by neurexin adhesion molecules.
To complement the above analysis, we explored divergent projections from a common origin. Specifically, we choose to examine neighboring PFC neurons with distinct synaptic target regions, by simultaneously injecting the NAc with RV(ΔG)-EYFP and the lateral hypothalamus (l. Hyp) with RV(ΔG)-tdTOM (Figure 6A). Double RV injections labeled two adjacent populations of PFC cells with no discernable overlap (Figure 6A). In this set of experiments, neurexin transcriptional repertoires were identical between these two populations of divergently projecting neurons, although other transcriptional differences were readily observed (compare Figure 6C,D with Figure 6B,E; also Figure 6G,I with 6H). Taken together, the aforementioned approaches suggest that neurexin transcriptional profiles show characteristic, reproducible cell type-specific differences across multiple brain regions and are not coordinated across connected circuit constituents (Supplementary Figure 4B-E). Predictive sorting analysis (see supplementary methods) further supported this conclusion as neurexin transcriptional profiles were of high predictive value in distinguishing hippocampal interneurons and ventral striatal cell types (Supplementary Figure 4F). They predicted these cell types much more effectively than other synaptic adhesion molecules or general neuronal transcripts, although somewhat less effectively than markers previously identified to have cell-type bias.
Figure 6. Neurexins do not display target-region specificity in two prefrontal circuits.
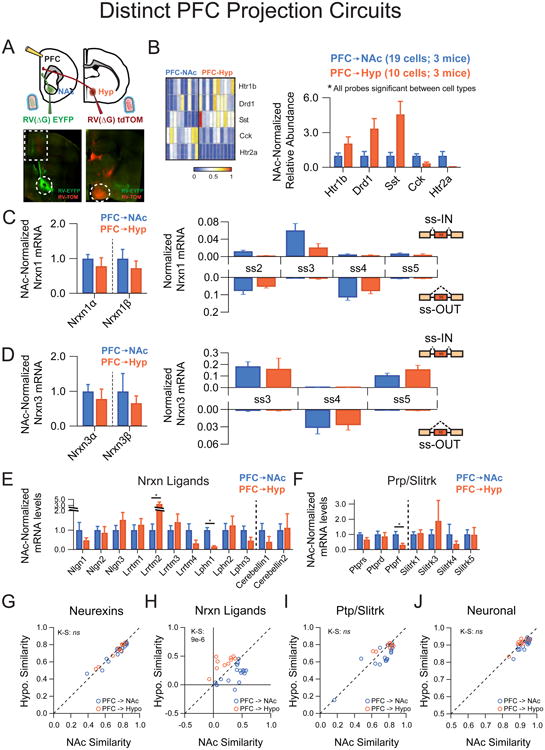
(A) Top: Strategy for single-cell isolation of PFC neurons that project to nucleus accumbens (NAc) and hypothalamus (Hyp) by coinjection of RV(ΔG)-EYFP into the NAc core and RV(ΔG)-tdTOM into the Hyp. Bottom: Retrograde synaptic uptake of RVs injected into NAc (left, circle) and hypothalamus (right, circle) by neurons in adjacent portions of the PFC (left, boxed region).
(B) Left: Heat map representation of normalized expression of PFC→NAc and PFC→Hyp for genes significantly different between these populations. Right: Averaged single cell expression for PFC→NAc (n=19) and PFC→Hyp (n=10), normalized to PFC→NAc values for each probe.
(C,D) Left: Nrxn α/β isoform expression, normalized by probe to the average level in PFC→NAc cells. Right: Splice site graph showing averaged single cell splice isoform expression values for ss-IN (upward bars) and ss-OUT (downward bars).
(E,F) Averaged single cell expression values for neurexin ligands (E) and the Ptp/Slitrk family (F), normalized to PFC→NAc values for each probe.
(G-J) Pearson coefficient correlation plots demonstrating the similarity of individual neurons to the two cell classes being compared for neurexins (G), neurexin ligands (H), Ptp/Slitrk family (I) and general neuronal transcripts (J). Cells are color coded according to PFC→NAc and PFC→Hyp identity.
Data are means + SEM; *significant difference between groups (Mann Whitney U-test). Kolmogorav-Smirnov (KS) values are given for comparison of single cell groups in G-J.
Single-cell regulation of the neurexin family
Numerous molecules are hypothesized to function cell-autonomously to shape the splicing patterns of neurexins (Resnick et al., 2008; Rozic et al., 2011; Iijima et al., 2011; Rozic et al., 2013; Iijima et al., 2014). It is presently unclear, however, whether such splicing machinery directs individual neurons towards exclusive expression of single splice isoforms. To address this question, we analyzed the status of ss4 within Nrxn1 transcripts across multiple brain regions, as this locus has a relatively simple single splice-site insertion or absence (Figure 7A). Importantly, we found individual neurons were indeed capable of expressing both “IN” and “OUT” versions of ss4, although this configuration was highly dependent on the region analyzed (Figure 7B-E). Cortical projection neurons largely excluded ss4 inserts, irrespective of their target region (Figure 7D,E), whereas thalamic neurons projecting to the NAc and D1R+MSNs found within this structure exhibited either ss4 in, ss4 out or coexpression of both species (Figure 7C,D). We also performed an alternative analysis to determine whether there was spice-site correlation across neurexin isoforms (i.e. between Nrxn1 and Nrxn3; Supplementary Figure 5A). Again we found that cortical projection neurons were nearly uniform in transcriptional repertoire, with a robust exclusion of ss4 in both Nrxn1 and Nrxn3 (Supplementary Figure 5D,E), while both CCK+ interneurons and thalamic projection neurons displayed coordinated ss4 exclusion as well as Nrxn1ss4- OUT/Nrxn3ss4-IN combinations (Supplementary Figure 5B,D,E).
Figure 7. Single-cell regulation of Nrxn1 ss4 selection is dependent on brain region.
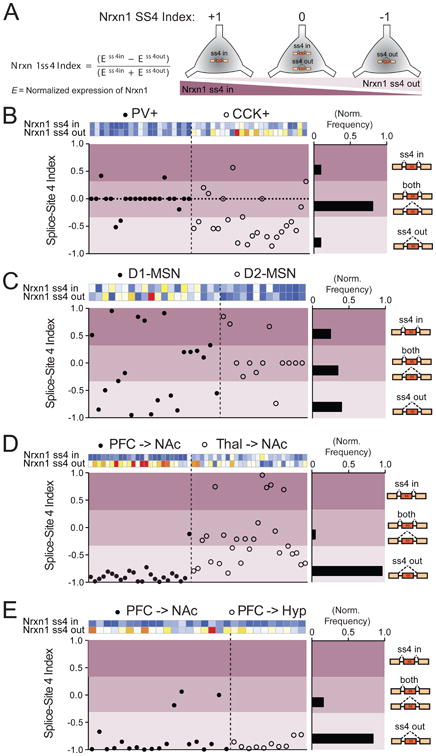
(A) Description of Nrxn1 splice-site 4 index, which assesses exclusive presence of single splice isoforms or coexpression of Nrxn1ss4-IN and Nrxn1ss4-OUT transcripts. An index=0 represents roughly equal normalized expression values for both Nrx1ss4-IN and Nrxn1ss4-OUT probes.
(B-E) Plot of splice-site 4 index for all single neurons collected in hippocampal interneuron (B, n=45 cells), NAc MSN (C, n=33 cells), NAc-projecting (D, n=51 cells), and divergent PFC projection (E, n=29 cells) experiments. Each plot shows the heat maps of both Nrx1ss4 probes for each cell, with the ss4 index plotted below. Splice-site territories were arbitrarily subdivided into ss4 in (index=0.33-1.00), both (index=-0.33– 0.33) and ss4 out (index=-1.0– -0.33) and normalized frequencies were calculated for each region (right histograms).
Neurexin transcriptional signatures are altered in response to drug exposure
Thus far, neurexin transcriptional profiles have been viewed as static characteristics with cell-type and circuit-specific expression. Previous work suggests activity-dependent processes can both alter the transcriptional diversity of neurexins (Rozic-Kotliroff and Zisapel, 2007; Resnick et al., 2008; Iijima et al., 2011; Rozic et al., 2011; Rozic et al., 2013) and shape their function at developing synapses (Chubykin et al., 2007). To explore the potential for plasticity of neurexin transcriptional repertoires, we exposed animals to chronic non-contingent cocaine administration, an experience known to cause major synaptic alterations within NAc circuitry (Bowers et al., 2010; Grueter et al., 2012). Mice exposed to 5 consecutive days of cocaine developed robust behavioral sensitization, manifest by a dramatic increase in locomotor activity as compared to saline-injected controls (Figure 8A,B). D1R+ MSNs extracted 3 hours after the last cocaine treatment displayed modest transcriptional changes, including an increase in the Gria4 subunit of AMPARs and a decrease in Lrrtm4 (Figure 8C,F). Despite this, no change in the neurexin transcription or splice code was observed (Figure 8D,E) in these cells. In contrast, D2R+ MSNs from cocaine-injected mice displayed both modest changes in AMPAR transcripts as well as large (>50%) reductions in total Nrxn1 transcriptional activity (Figure 8G,H). In addition, these changes were accompanied by differential expression of specific isoforms of both Nrxn1 and Nrxn3 (Figure 8H,I). Together these data uncover a cell-type specific remodeling of neurexin codes at the single cell level following chronic exposure to a drug of abuse.
Figure 8. Neurexin transcriptional profiles undergo cell type-specific changes during the development of cocaine-evoked behavioral sensitization.
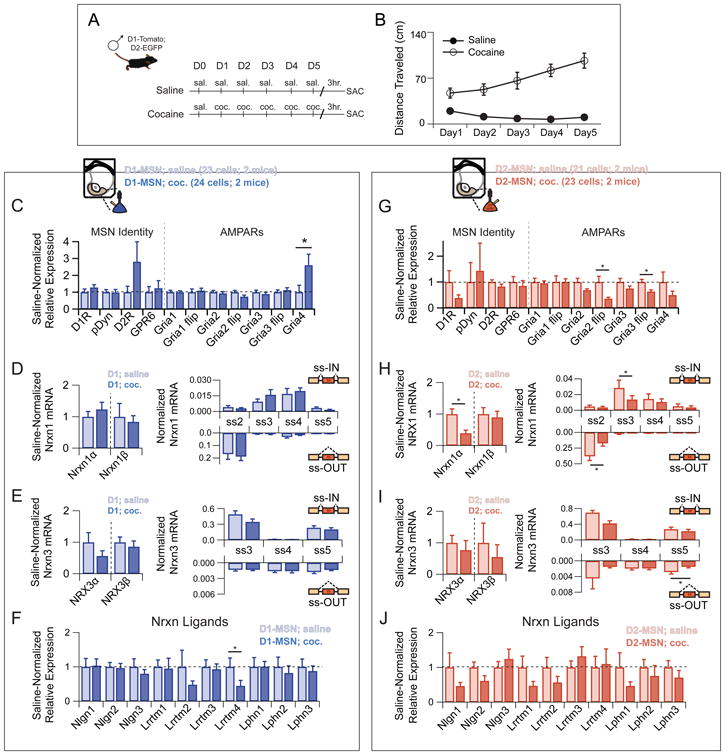
(A) Behavioral paradigm for 5-day non-contingent cocaine administration. D1-Tom/D2-EGFP transgenic mice were sacrificed 3 hours after final cocaine injection.
(B) Behavioral sensitization as manifest by steady increase in locomotor activity in the cocaine group as compared with saline controls over sequential days of cocaine administration.
(C,G) Averaged single cell expression of markers of MSN identity and AMPA subtype glutamate receptors for saline versus cocaine treated mice of D1R+ (C) and D2R+ (G) MSN subtype, with expression values normalized to the saline controls for each probe.
(D,H) Left: Averaged single cell expression of Nrxn1 isoforms for saline versus cocaine treated mice of D1R+ (D) and D2R+ (H) MSN subtype, with expression values normalized to the saline controls for each probe. Right: Splice site graph showing averaged single cell splice isoform expression values for ss-IN (upward bars) and ss-OUT (downward bars) for saline versus cocaine treated mice of D1R+ (D) and D2R+ (H) MSN subtype.
(E,I) Left: Averaged single cell expression of Nrxn3 isoforms for saline versus cocaine treated mice of D1R+ (E) and D2R+ (I) MSN subtype, with expression values normalized to saline controls for each probe. Right: Splice site graph showing averaged single cell splice isoform expression values for ss-IN (upward bars) and ss-OUT (downward bars) for saline versus cocaine treated mice of D1R+ (E) and D2R+ (I) MSN subtype.
(F,J) Averaged single cell expression of neurexin ligands for saline versus cocaine treated mice of D1R+ (C) and D2R+ (G) subtype, with expression values normalized to the saline controls for each probe.
Data are means + SEM; *significant difference between groups (Mann Whitney U-test).
Discussion
Understanding the molecular machinery that defines circuit and synapse specificity is a daunting challenge with enormous clinical and therapeutic implications. Synaptic adhesion molecules in general, and neurexins in particular, have been proposed to contribute to circuit formation within the nervous system (Aoto et al., 2013; Futai et al., 2013; Ullrich et al., 1995; Ushkaryov et al., 1992). Here, we employed single-cell quantitative RT-PCR to illuminate the expression profiles and differential splicing of neurexin mRNAs from individual neurons embedded in mature neural circuits. These experiments are the first to address at the single neuron level the existence of a “synaptic adhesion code” – a regulated, combinatorial expression of synaptic adhesion molecules which could contain molecular instructions for the hierarchical organization of synapses, including the connectivity of specific neuronal populations, the precise sub-cellular localization of synaptic contacts, the specific strength and molecular composition of these connections and their ability to be modified by the environment (see Supplemental Figure 6). By combining genetic and viral circuit mapping techniques, microfluidics technology and a novel qPCR probe design, we assessed the contributions of neurexin transcriptional diversity to such codes. First, we found that single-neuron analysis of hippocampal CA1 transcriptional profiles had several advantages over tissue mRNA sampling, including lower detection levels of genes commonly associated with glial populations, unparalleled access to sparse neuronal populations, and invaluable estimates of the variance of transcript expression within neuronal populations. Second, by using this technique, we reached several conclusions regarding neurexins which could not have been demonstrated otherwise: (1) Neurexins exhibit cell type-specific expression patterns that are reproducible across neurons, (2) neurons with common long-range projection targets or cell type-specific connectivity do not necessarily employ similar neurexin transcriptional codes, (3) coordination of neurexin alternative splicing is specific to brain regions, and (4) neurexin expression profiles can be altered in a cell type-specific manner in response to chronic cocaine treatment.
Recent deep sequencing technologies have provided in depth and comprehensive cataloging of potential neurexin transcriptional repertoires from whole brain, prefrontal cortex and cerebellar granule cell cultures (Treutlein et al., 2014; Schreiner et al., 2014). While these molecule-centered sequencing approaches nearly mapped the full extent of neurexin diversity, technical limitations required large sample input, making it impossible to assess whether individual neurons regulate neurexin diversity to encode synaptic connectivity within neural circuits. Our data directly address this problem by demonstrating reproducible cell type- and circuit-specific expression of different families of Nrxns as well as other synaptic adhesion molecules. Exploration of the neurexin transcriptional repertoire of hippocampal GABAergic interneurons and striatal MSNs suggested that neurexin expression is tightly and reproducibly regulated at the single-cell level. How this transcriptional diversity is achieved depends on the brain region -MSNs may exclusively utilize promoter selection to control transcriptional output, while basket cell populations additionally employ post-transcriptional splicing to enhance differences in their neurexin profiles. Further work will be needed to see whether the enhanced neurexin transcriptional divergence of interneurons as compared to MSNs is related to the unique developmental origins of the PV+ and CCK+ cells, their different activity levels, or their particular splicing machinery (Rozic-Kotliroff et al. 2007; Resnick et al. 2008; Tricoire et al., 2011; Ehrmann et al. 2013; Iijima et al., 2014; See et al. 2014), as well as whether these differences have a functional role in specifying the distinct synaptic properties of these diverse subclasses.
A series of experiments performed to probe the correlation between synaptic target area and neurexin expression profile suggest that neurexins alone do not encode target specificity. Cortical and thalamic afferent projection neurons were examined for functionally and anatomically distinct striatal circuits and revealed highly divergent input-specific neurexin profiles. However, despite comprising non-overlapping cortico-striato-thalamic circuits, comparisons between individual cortical or thalamic populations demonstrated conserved regulation of neurexin transcription, with differences restricted to splice-site utilization. These results raise the intriguing possibility that splice-site control provides an alternative evolutionary mechanism for diversification of neurexin expression patterns from regionally conserved templates. Further analysis of a corticostriato-thalamic circuit synaptically connected to D1R+MSNs demonstrated that input-specific neurexin profiles are also not a result of biased cell type connectivity. In contrast to these data, PFC neurons projecting to the hypothalamus and NAc inhabited distinct cortical layers but still exhibited identical neurexin expression patterns. Together, these data make a strong argument that target region is not encoded by neurexin diversity, consistent with previous reports that α-neurexin knockout mice do not display deficits in axonal projections of olfactory circuits (Dudanova et al., 2007). Furthermore, we demonstrate that neurexin profiles do not encode cell type-specific connectivity, suggesting it is unlikely that neurexins function as a map on which patterns of neuronal connectivity are established.
Our analyses exploring single-cell relationships between individual neurexin splice isoforms could have substantial implications for understanding the genetics of neuropsychiatric illness, as this gene family is extensively linked to human neuropsychiatric disease (Elia et al., 2010; Pinto et al., 2010; Tam et al., 2009). Understanding how mutations in neurexins eventually lead to behavioral abnormalities requires the discovery of “molecularly vulnerable circuits,” specific neuronal populations that cannot functionally compensate for gene mutations because they lack genetic redundancy or are inherently vulnerable to small changes in synapse properties (Rothwell et al., 2014; Soler-Llavina et al., 2011). Coordinated cellular splicing of Nrxns could be an important source of such molecular redundancy as evidenced by the interchangeability of neurexin isoforms lacking ss4 for the maintenance of AMPA receptor function (Aoto et al., 2013). Following this logic, cortical projection neurons, which exclusively coordinate, via alternative splicing, Nrxn1 and Nrxn3 ss4 exclusion, are unlikely to be as vulnerable to single gene loss as NAc-projecting thalamic neurons, which could not use Nrxn3 expression to replace Nrxn1 deficiencies because of conflicting splice-site usage. Unfortunately, transcriptional patterns read out at the soma provide little information about the targeting of mRNA populations to specific dendritic or axonal compartments. If synaptic adhesion molecules are recruited in a synapse-specific manner, mutations may uniquely perturb select set of inputs. Nontheless, single neuron transcriptional analyses of this sort clearly provide a powerful new tool for prediction of molecularly vulnerable disease-relevant circuits in the future.
If neurexins do encode cell type-specific information about synaptic function, understanding their potential for plasticity could provide essential mechanistic information about how neural circuits modify themselves in response to environmental experience. To explore this, we chronically administered cocaine to mice and detailed how their synaptic adhesion profiles changed during behavioral sensitization. Surprisingly, five days of cocaine administration demonstrated remarkably subtle effects on the overall transcriptional profiles of NAc MSNs, which are known to undergo significant synaptic remodeling 2 weeks following cocaine exposure (Huang et al., 2009; Kim et al., 2011; Russo et al., 2010). However, we observed a ∼50% down-regulation of Nrxn1α transcripts exclusively in D2-MSNs, along with decreases in the abundance of ss2-out and ss3-in isoforms. Previous work has demonstrated activity-dependent changes in neurexin alternative splicing (Patzke et al. 2000; Rozic-Kotliroff et al., 2007; Rozic et al. 2013; Iijima et al., 2014). Together with our data, it is clear that the pattern of neurexin splicing in the nervous system is sensitive to a range of physiological stimuli. While more work is required to understand the significance of both baseline adhesion profiles and behaviorally-induced alterations, we believe our single cell analysis of synaptic adhesion molecule transcription provides a broad foundation for understanding how molecules encode synaptic function and how this is altered by the environment and disease.
Experimental Procedures
Single Cell Transcriptional Profiling
Acute brain slices were cut and patch pipettes were used for cytosol extraction. Samples then underwent reverse transcription and target-specific amplification, followed by quantitative PCR. Further details are found in supplementary procedures.
Primetime Assay Design
All Primetime assays were ordered from Integrated DNA Technologies (IDT, Coralville, Iowa). Assays were designed to generate amplicons of 70-100bp length that bridged exon-intron junctions. Wherever possible, splice-site in (ssIN) and splice-site out (ssOUT) specific assays differed by only a single primer. The complexity of neurexin splicing is such that “ss-in” can include many similar exons differentiated by only a few amino acids. In these instances, effort was taken to design primers that would recognize the largest number of potential ss-in products. Probes passing efficiency criterion (>90%) as described by
were subjected to qPCR with plasmid templates of known neurexin splicing combinations to test for probe specificity. The final probe set included 170 probes, 146 of which were unique (see Supplementary Table 1 for sequences).
Data Analysis
All cycle threshold (Ct) data were calculated by Biomark acquisition software, exported as .csv files and analyzed in Mathematica version 9.0 (Wolfram Research) with custom written protocols. Each chip run included 8 tissue cDNA dilutions to monitor the efficiencies of probes across experiments. Ct values were converted to normalized expression levels by the following formula
where “Ct norm. probes” is the average Ct of two Actb probes and Atp1b1. Using these normalizer probes, nearly all expression values fell between 0 and 1. Single cells whose normalizer value was +/- 2 cycles from overall normalizer average were omitted from further analysis. In nucleus accumbens experiments, Lhx8+ cells were removed from the dataset as they likely represented cholinergic interneurons (Zhao et al., 2003); all other cells were analyzed. Heat maps were generated with the “ArrayPlot” function in Mathematica and scaled to the highest and lowest global normalized expression values in a given dataset. For data sorting, cell type was always defined by transgenic mouse line or viral labeling. Expression values were compared between two defined cell populations using Mann-Whitney U test with significance set at p<0.05. Tissue vs single cell comparisons were analyzed using one-way ANOVA followed by LSD-corrected post-hoc tests. All summary expression data are displayed as mean +/- standard error of the mean (SEM). With the exception of ss-specific probes, expression was normalized to the first cell type in each respective figure (B-F in Figures 2-5). All comparisons were made between cell types for each probe to avoid confounding cross-probe differences in sensitivity.
Clustering
Clustering was used to group cells by similarity of transcriptional profile. For each chip, probes were rank-ordered by overall population variance and the top 50% of high variance probes were used for clustering. Probe groups included: Neurexins (Nrxn1α, Nrxn1β, Nrxn3α, Nrx3β, and all Nrxn1 and Nrxn3 splice sites); neurexin ligands (Nlgn1-3, Lrrtm1-4, Lphn1-3, Crbln1,2,4); Ptp/Slitrk (Ptprs, Ptprd, Ptprf, Slitrk1-6); neuronal (NeuN, Nefl, Mapt, Gad65, Syt1, Vamp3, Grm1, Grm5). Pearson's correlation coefficient (“Correlation” function in Mathematica) was calculated between all cells and single cell matrices were created describing the correlation of each cell to the two experimental populations. Cluster plots were assayed for significance by Kolmogarov-Smirnov test.
Predictive sorting
Predictive sorting was used to test the efficacy of transcriptional profiles in distinguishing cell type identity. In brief, single cell data was analyzed by the “ClusteringComponents” function in Mathematica (Euclidean distance function – 500 sequential iterations) to create two cell populations (group A and group B). The following formula was used to create a weighted predictive sorting measure
where N = the total number of single cells, NA = cells in group A and NB = cells in group B.
Supplementary Material
Acknowledgments
We would like to thank Atiyeh Afjei for technical assistance, as well as Ami Citri and all members of the Malenka/Südhof laboratories for helpful discussions. We also thank Byungkook Lim and Kevin Beier for their kind gifts of rabies virus aliquots. This work was supported by grants from the NIMH (P50 MH086403 to R.C.M., R37MH52804 to T.C.S., K99 MH099243 to M.V.F.,) and NIDA (K99DA034029 to C.F., P01 DA008227 to R.C.M., K99DA038112 to O.G., K99DA037279 to P.E.R.).
Footnotes
Author Contributions: MVF, CF, OG, RCM and TCS designed the study. MVF and CF analyzed Fluidigm datasets. MVF, CF and PER picked cells for transcriptional analysis. OG isolated tissue mRNA. OG designed all Neurexin-specific assays and CF designed AMPAR-specific probe sets. MVF and OG determined assay efficiencies and specificities. PER performed behavioral sensitization experiments. MVF, CF, RCM and TCS wrote and edited the manuscript.
Publisher's Disclaimer: This is a PDF file of an unedited manuscript that has been accepted for publication. As a service to our customers we are providing this early version of the manuscript. The manuscript will undergo copyediting, typesetting, and review of the resulting proof before it is published in its final citable form. Please note that during the production process errors may be discovered which could affect the content, and all legal disclaimers that apply to the journal pertain.
References
- Aoto J, Martinelli DC, Malenka RC, Tabuchi K, Südhof TC. Presynaptic neurexin-3 alternative splicing trans-synaptically controls postsynaptic AMPA receptor trafficking. Cell. 2013;154:75–88. doi: 10.1016/j.cell.2013.05.060. [DOI] [PMC free article] [PubMed] [Google Scholar]
- Araç D, Boucard AA, Ozkan E, Strop P, Newell E, Südhof TC, Brunger AT. Structures of neuroligin-1 and the neuroligin-1/neurexin-1 beta complex reveal specific protein-protein and protein-Ca2+ interactions. Neuron. 2007;56:992–1003. doi: 10.1016/j.neuron.2007.12.002. [DOI] [PubMed] [Google Scholar]
- Boucard AA, Chubykin AA, Comoletti D, Taylor P, Südhof TC. A splice code for trans-synaptic cell adhesion mediated by binding of neuroligin 1 to alpha- and beta-neurexins. Neuron. 2005;48:229–236. doi: 10.1016/j.neuron.2005.08.026. [DOI] [PubMed] [Google Scholar]
- Boucard AA, Maxeiner S, Südhof TC. Latrophilins function as heterophilic cell-adhesion molecules by binding to teneurins: regulation by alternative splicing. The Journal of Biological Chemistry. 2014;289:387–402. doi: 10.1074/jbc.M113.504779. [DOI] [PMC free article] [PubMed] [Google Scholar]
- Bowers MS, Chen BT, Bonci A. AMPA Receptor Synaptic Plasticity Induced by Psychostimulants: The Past, Present, and Therapeutic Future. Neuron. 2010;67:11–24. doi: 10.1016/j.neuron.2010.06.004. [DOI] [PMC free article] [PubMed] [Google Scholar]
- Chen SX, Tari PK, She K, Haas K. Neurexin-neuroligin cell adhesion complexes contribute to synaptotropic dendritogenesis via growth stabilization mechanisms in vivo. Neuron. 2010;67:967–983. doi: 10.1016/j.neuron.2010.08.016. [DOI] [PubMed] [Google Scholar]
- Chen F, Venugopal V, Murray B, Rudenko G. The Structure of Neurexin 1alpha; Reveals Features Promoting a Role as Synaptic Organizer. Structure. 2011;19:779–789. doi: 10.1016/j.str.2011.03.012. [DOI] [PMC free article] [PubMed] [Google Scholar]
- Chubykin AA, Atasoy D, Etherton MR, Brose N, Kavalali ET, Gibson JR, Südhof TC. Activity-dependent validation of excitatory versus inhibitory synapses by neuroligin-1 versus neuroligin-2. Neuron. 2007;54:919–931. doi: 10.1016/j.neuron.2007.05.029. [DOI] [PMC free article] [PubMed] [Google Scholar]
- Comoletti D, Miller MT, Jeffries CM, Wilson J, Demeler B, Taylor P, Trewhella J, Nakagawa T. The macromolecular architecture of extracellular domain of alphaNRXN1: domain organization, flexibility, and insights into trans-synaptic disposition. Structure. 18:1044–1053. doi: 10.1016/j.str.2010.06.005. [DOI] [PMC free article] [PubMed] [Google Scholar]
- de Wit J, Sylwestrak E, O'Sullivan ML, Otto S, Tiglio K, Savas JN, Yates JR, Comoletti D, Taylor P, Ghosh A. LRRTM2 interacts with Neurexin1 and regulates excitatory synapse formation. Neuron. 2009;64:799–806. doi: 10.1016/j.neuron.2009.12.019. [DOI] [PMC free article] [PubMed] [Google Scholar]
- Duan X, Krishnaswamy A, De la Huerta I, Sanes JR. Type II cadherins guide assembly of a direction-selective retinal circuit. Cell. 2014;158:793–807. doi: 10.1016/j.cell.2014.06.047. [DOI] [PubMed] [Google Scholar]
- Dudanova I, Tabuchi K, Rohlmann A, Südhof TC, Missler M. Deletion of alpha-neurexins does not cause a major impairment of axonal pathfinding or synapse formation. The Journal of Comparative Neurology. 2007;502:261–274. doi: 10.1002/cne.21305. [DOI] [PubMed] [Google Scholar]
- Ehrmann I, Dalgliesh C, Liu Y, Danilenko M, Crosier M, Overman L, Arthur HM, Lindsay S, Clowry GJ, Venables JP, Fort P, Elliott DJ. The tissue-specific RNA binding protein T-STAR controls regional splicing patterns of neurexin pre-mRNAs in the brain. PLoS Genetics. 2013;9:e1003474. doi: 10.1371/journal.pgen.1003474. [DOI] [PMC free article] [PubMed] [Google Scholar]
- Elia J, Gai X, Xie HM, Perin JC, Geiger E, Glessner JT, D'Arcy M, deBerardinis R, Frackelton E, Kim C, et al. Rare structural variants found in attention-deficit hyperactivity disorder are preferentially associated with neurodevelopmental genes. Molecular Psychiatry. 2010;15:637–646. doi: 10.1038/mp.2009.57. [DOI] [PMC free article] [PubMed] [Google Scholar]
- Földy C, Lee SY, Szabadics J, Neu A, Soltesz I. Cell type-specific gating of perisomatic inhibition by cholecystokinin. Nature Neuroscience. 2007;10:1128–1130. doi: 10.1038/nn1952. [DOI] [PubMed] [Google Scholar]
- Freund TF. Interneuron Diversity series: Rhythm and mood in perisomatic inhibition. Trends in Neurosciences. 2003;26:489–495. doi: 10.1016/S0166-2236(03)00227-3. [DOI] [PubMed] [Google Scholar]
- Freund TF, Katona I. Perisomatic inhibition. Neuron. 2007;56:33–42. doi: 10.1016/j.neuron.2007.09.012. [DOI] [PubMed] [Google Scholar]
- Futai K, Doty CD, Baek B, Ryu J, Sheng M. Specific trans-synaptic interaction with inhibitory interneuronal neurexin underlies differential ability of neuroligins to induce functional inhibitory synapses. Journal of Neuroscience. 2013;33:3612–3623. doi: 10.1523/JNEUROSCI.1811-12.2013. [DOI] [PMC free article] [PubMed] [Google Scholar]
- Gong S, Zheng C, Doughty ML, Losos K, Didkovsky N, Schambra UB, Nowak NJ, Joyner A, Leblanc G, Hatten ME, Heintz N. A gene expression atlas of the central nervous system based on bacterial artificial chromosomes. Nature. 2003;425:917–925. doi: 10.1038/nature02033. [DOI] [PubMed] [Google Scholar]
- Gong S, Doughty M, Harbaugh CR, Cummins A, Hatten ME, Heintz N, Gerfen CR. Targeting Cre recombinase to specific neuron populations with bacterial artificial chromosome constructs. Journal of Neuroscience. 2007;27(37):9817–9823. doi: 10.1523/JNEUROSCI.2707-07.2007. [DOI] [PMC free article] [PubMed] [Google Scholar]
- Groenewegen HJ, Berendse HW. The specificity of the ‘nonspecific’ midline and intralaminar thalamic nuclei. Trends in Neurosciences. 1994;17:52–57. doi: 10.1016/0166-2236(94)90074-4. [DOI] [PubMed] [Google Scholar]
- Groenewegen HJ, Wright CI, Uylings HB. The anatomical relationships of the prefrontal cortex with limbic structures and the basal ganglia. Journal of Psychopharmacology. 1997;11:99–106. doi: 10.1177/026988119701100202. [DOI] [PubMed] [Google Scholar]
- Grueter BA, Rothwell PE, Malenka RC. Integrating synaptic plasticity and striatal circuit function in addiction. Current Opinions in Neurobiology. 2012;22:545–551. doi: 10.1016/j.conb.2011.09.009. [DOI] [PMC free article] [PubMed] [Google Scholar]
- Heiman M, Schaefer A, Gong S, Peterson JD, Day M, Ramsey KE, Suarez-Farinas M, Schwarz C, Stephan DA, Surmeier DJ, et al. A translational profiling approach for the molecular characterization of CNS cell types. Cell. 2008;135:738–748. doi: 10.1016/j.cell.2008.10.028. [DOI] [PMC free article] [PubMed] [Google Scholar]
- Hippenmeyer S, Huber RM, Ladle DR, Murphy K, Arber S. ETS transcription factor Erm controls subsynaptic gene expression in skeletal muscles. Neuron. 2007;55:726–740. doi: 10.1016/j.neuron.2007.07.028. [DOI] [PubMed] [Google Scholar]
- Huang YH, Lin Y, Mu P, Lee BR, Brown TE, Wayman G, Marie H, Liu W, Yan Z, Sorg BA, et al. In vivo cocaine experience generates silent synapses. Neuron. 2009;63:40–47. doi: 10.1016/j.neuron.2009.06.007. [DOI] [PMC free article] [PubMed] [Google Scholar]
- Iijima T, Iijima Y, Witte H, Scheiffele P. Neuronal cell type-specific alternative splicing is regulated by the KH domain protein SLM1. J Cell Biology. 2014;204:331–342. doi: 10.1083/jcb.201310136. [DOI] [PMC free article] [PubMed] [Google Scholar]
- Iijima T, Wu K, Witte H, Hanno-Iijima Y, Glatter T, Richard S, Scheiffele P. SAM68 regulates neuronal activity-dependent alternative splicing of neurexin-1. Cell. 2011;147:1601–1614. doi: 10.1016/j.cell.2011.11.028. [DOI] [PMC free article] [PubMed] [Google Scholar]
- Kepecs A, Fishell G. Interneuron cell types are fit to function. Nature. 2014;505:318–326. doi: 10.1038/nature12983. [DOI] [PMC free article] [PubMed] [Google Scholar]
- Kim J, Park BH, Lee JH, Park SK, Kim JH. Cell type-specific alterations in the nucleus accumbens by repeated exposures to cocaine. Biological Psychiatry. 2011;69:1026–1034. doi: 10.1016/j.biopsych.2011.01.013. [DOI] [PubMed] [Google Scholar]
- Klausberger T, Somogyi P. Neuronal diversity and temporal dynamics: the unity of hippocampal circuit operations. Science. 2008;321:53–57. doi: 10.1126/science.1149381. [DOI] [PMC free article] [PubMed] [Google Scholar]
- Lim BK, Huang KW, Grueter BA, Rothwell PE, Malenka RC. Anhedonia requires MC4R-mediated synaptic adaptations in nucleus accumbens. Nature. 2012;487:183–189. doi: 10.1038/nature11160. [DOI] [PMC free article] [PubMed] [Google Scholar]
- Linhoff MW, Laurén J, Cassidy RM, Dobie FA, Takahashi H, Nygaard HB, Airaksinen MS, Strittmatter SM, Craig AM. An unbiased expression screen for synaptogenic proteins identifies the LRRTM protein family as synaptic organizers. Neuron. 2009;61:734–749. doi: 10.1016/j.neuron.2009.01.017. [DOI] [PMC free article] [PubMed] [Google Scholar]
- Lobo MK. Molecular profiling of striatonigral and striatopallidal medium spiny neurons past, present, and future. International Review of Neurobiology. 2009;89:1–35. doi: 10.1016/S0074-7742(09)89001-6. [DOI] [PubMed] [Google Scholar]
- Madisen L, Zwingman TA, Sunkin SM, Oh SW, Zariwala HA, Gu H, Ng LL, Palmiter RD, Hawrylycz MJ, Jones AR, et al. A robust and high-throughput Cre reporting and characterization system for the whole mouse brain. Nature Neuroscience. 2010;13:133–140. doi: 10.1038/nn.2467. [DOI] [PMC free article] [PubMed] [Google Scholar]
- Missler M, Zhang W, Rohlmann A, Kattenstroth G, Hammer R, Gottmann K, Südhof T. alpha-Neurexins couple Ca 2 channels to synaptic vesicle exocytosis. Nature. 2003;423:939–948. doi: 10.1038/nature01755. [DOI] [PubMed] [Google Scholar]
- Patzke H, Ernsberger U. Expression of neurexin I alpha splice variants in sympathetic neurons: selective changes during differentiation and in response to neurotrophins. Molecular Cellular Neuroscience. 2000;15:561–72. doi: 10.1006/mcne.2000.0853. [DOI] [PubMed] [Google Scholar]
- Pinto D, Pagnamenta AT, Klei L, Anney R, Merico D, Regan R, Conroy J, Magalhaes TR, Correia C, Abrahams BS, et al. Functional impact of global rare copy number variation in autism spectrum disorders. Nature. 2010;466:368–372. doi: 10.1038/nature09146. [DOI] [PMC free article] [PubMed] [Google Scholar]
- Resnick M, Segall A, GRK G, Lupowitz Z, Zisapel N. Alternative splicing of neurexins: a role for neuronal polypyrimidine tract binding protein. Neuroscience letters. 2008;439:235–240. doi: 10.1016/j.neulet.2008.05.034. [DOI] [PubMed] [Google Scholar]
- Rothwell PE, Fuccillo MV, Maxeiner S, Hayton SJ, Gokce O, Lim BK, Fowler SC, Malenka RC, Südhof TC. Autism-associated neuroligin-3 mutations commonly impair striatal circuits to boost repetitive behaviors. Cell. 2014;158:198–212. doi: 10.1016/j.cell.2014.04.045. [DOI] [PMC free article] [PubMed] [Google Scholar]
- Rozic G, Lupowitz Z, Piontkewitz Y, Zisapel N. Dynamic changes in neurexins' alternative splicing: role of Rho-associated protein kinases and relevance to memory formation. PloS One. 2011;6:e18579. doi: 10.1371/journal.pone.0018579. [DOI] [PMC free article] [PubMed] [Google Scholar]
- Rozic G, Lupowitz Z, Zisapel N. Exonal elements and factors involved in the depolarization-induced alternative splicing of neurexin 2. Journal of Molecular Neuroscience. 2013;50:221–233. doi: 10.1007/s12031-012-9919-x. [DOI] [PMC free article] [PubMed] [Google Scholar]
- Rozic-Kotliroff G, Zisapel N. Ca2+ -dependent splicing of neurexin IIalpha. Biochemical and Biophysical Research Communications. 2007;352:226–230. doi: 10.1016/j.bbrc.2006.11.008. [DOI] [PubMed] [Google Scholar]
- Russo SJ, Dietz DM, Dumitriu D, Morrison JH, Malenka RC, Nestler EJ. The addicted synapse: mechanisms of synaptic and structural plasticity in nucleus accumbens. Trends in Neurosciences. 2010;33:267–276. doi: 10.1016/j.tins.2010.02.002. [DOI] [PMC free article] [PubMed] [Google Scholar]
- Schreiner D, Nguyen TM, Russo G, Heber S, Patrignani A, Ahrné E, Scheiffele P. Targeted Combinatorial Alternative Splicing Generates Brain Region-Specific Repertoires of Neurexins. Neuron. 2014;84:386–398. doi: 10.1016/j.neuron.2014.09.011. [DOI] [PubMed] [Google Scholar]
- See K, Yadav P, Giegerich M, Cheong PS, Graf M, Vyas H, Lee SG, Mathavan S, Fischer U, Sendtner M, Winkler C. SMN deficiency alters Nrxn2 expression and splicing in zebrafish and mouse models of spinal muscular atrophy. Human molecular genetics. 2014;23:1754–70. doi: 10.1093/hmg/ddt567. [DOI] [PubMed] [Google Scholar]
- Shuen JA, Chen M, Gloss B, Calakos N. Drd1a-tdTomato BAC transgenic mice for simultaneous visualization of medium spiny neurons in the direct and indirect pathways of the basal ganglia. Journal of Neuroscience. 2008;28:2681–2685. doi: 10.1523/JNEUROSCI.5492-07.2008. [DOI] [PMC free article] [PubMed] [Google Scholar]
- Siddiqui TJ, Pancaroglu R, Kang Y, Rooyakkers A, Craig AM. LRRTMs and neuroligins bind neurexins with a differential code to cooperate in glutamate synapse development. Journal of Neuroscience. 2010;30:7495–7506. doi: 10.1523/JNEUROSCI.0470-10.2010. [DOI] [PMC free article] [PubMed] [Google Scholar]
- Soler-Llavina GJ, Arstikaitis P, Morishita W, Ahmad M, Südhof TC, Malenka RC. Leucine-rich repeat transmembrane proteins are essential for maintenance of long-term potentiation. Neuron. 2013;79:439–446. doi: 10.1016/j.neuron.2013.06.007. [DOI] [PMC free article] [PubMed] [Google Scholar]
- Soler-Llavina GJ, Fuccillo MV, Ko J, Südhof TC, Malenka RC. The neurexin ligands, neuroligins and leucine-rich repeat transmembrane proteins, perform convergent and divergent synaptic functions in vivo. Proceedings of the National Academy of Sciences of the United States of America. 2011;108:16502–16509. doi: 10.1073/pnas.1114028108. [DOI] [PMC free article] [PubMed] [Google Scholar]
- Südhof TC. Neuroligins and neurexins link synaptic function to cognitive disease. Nature. 2008;455:903–911. doi: 10.1038/nature07456. [DOI] [PMC free article] [PubMed] [Google Scholar]
- Tabuchi K, Südhof TC. Structure and Evolution of Neurexin Genes: Insight into the Mechanism of Alternative Splicing. Genomics. 2002;79:849–859. doi: 10.1006/geno.2002.6780. [DOI] [PubMed] [Google Scholar]
- Takahashi H, Craig AM. Protein tyrosine phosphatases PTPδ, PTPσ, and LAR: presynaptic hubs for synapse organization. Trends in Neurosciences. 2013;36:522–534. doi: 10.1016/j.tins.2013.06.002. [DOI] [PMC free article] [PubMed] [Google Scholar]
- Tam GW, Redon R, Carter NP, Grant SG. The role of DNA copy number variation in schizophrenia. Biological Psychiatry. 2009;66:1005–1012. doi: 10.1016/j.biopsych.2009.07.027. [DOI] [PubMed] [Google Scholar]
- Treutlein B, Gökce Ö, Quake SR, Südhof TC. Cartography of neurexin alternative splicing mapped by single-molecule long-read mRNA sequencing. Proceedings of the National Academy of Sciences. 2014;111:E1291–E1299. doi: 10.1073/pnas.1403244111. [DOI] [PMC free article] [PubMed] [Google Scholar]
- Tricoire L, Pelkey KA, Erkkila BE, Jeffries BW, Yuan X, McBain CJ. A blueprint for the spatiotemporal origins of mouse hippocampal interneuron diversity. Journal of Neuroscience. 2011;31:10948–10970. doi: 10.1523/JNEUROSCI.0323-11.2011. [DOI] [PMC free article] [PubMed] [Google Scholar]
- Uemura T, Lee SJ, Yasumura M, Takeuchi T, Yoshida T, Ra M, Taguchi R, Sakimura K, Mishina M. Trans-synaptic interaction of GluRdelta2 and Neurexin through Cbln1 mediates synapse formation in the cerebellum. Cell. 2010;141:1068–1079. doi: 10.1016/j.cell.2010.04.035. [DOI] [PubMed] [Google Scholar]
- Ullrich B, Ushkaryov YA, Südhof TC. Cartography of neurexins: more than 1000 isoforms generated by alternative splicing and expressed in distinct subsets of neurons. Neuron. 1995;14:497–507. doi: 10.1016/0896-6273(95)90306-2. [DOI] [PubMed] [Google Scholar]
- Ushkaryov YA, Petrenko AG, Geppert M, Südhof TC. Neurexins: synaptic cell surface proteins related to the alpha-latrotoxin receptor and laminin. Science. 1992;257:50–56. doi: 10.1126/science.1621094. [DOI] [PubMed] [Google Scholar]
- Ushkaryov YA, Südhof TC. Neurexin III alpha: extensive alternative splicing generates membrane-bound and soluble forms. Proceedings of the National Academy of Sciences of the United States of America. 1993;90:6410–6414. doi: 10.1073/pnas.90.14.6410. [DOI] [PMC free article] [PubMed] [Google Scholar]
- Yim YS, Kwon Y, Nam J, Yoon HI, Lee K, Kim DG, Kim E, Kim CH, Ko J. Slitrks control excitatory and inhibitory synapse formation with LAR receptor protein tyrosine phosphatases. Proceedings of the National Academy of Sciences of the United States of America. 2013;110:4057–4062. doi: 10.1073/pnas.1209881110. [DOI] [PMC free article] [PubMed] [Google Scholar]
- Zhao Y, Marin O, Hermesz E, Powell A, Flames N, Palkovits M, Rubenstein JL, Westphal H. The LIM-homeobox gene Lhx8 is required for the development of many cholinergic neurons in the mouse forebrain. Proceedings of the National Academy of Sciences of the United States of America. 2003;100:9005–9010. doi: 10.1073/pnas.1537759100. [DOI] [PMC free article] [PubMed] [Google Scholar]
- Zipursky SL, Sanes JR. Chemoaffinity revisited: dscams, protocadherins, and neural circuit assembly. Cell. 2010;143:343–353. doi: 10.1016/j.cell.2010.10.009. [DOI] [PubMed] [Google Scholar]
Associated Data
This section collects any data citations, data availability statements, or supplementary materials included in this article.