

Abstract
INTRODUCTON
Atrial fibrillation (AF) ablation patients often manifest atrial tachycardias (AT) with atypical ECG morphologies that preclude accurate localization and mechanism. Diagnostic maneuvers used to define ATs during electrophysiology studies can be limited by tachycardia termination or transformation. Additional methods of characterizing post-AF ablation ATs are required.
METHODS AND RESULTS
We evaluated the utility of noninvasive ECG signal analytics in post-ablation AF patients for the following features: 1) Localization of ATs (i.e., right versus left atrium), and 2) Identification of common left AT mechanisms (i.e., focal vs. macroreentrant). Atrial waveforms from the surface ECG were used to analyze: 1) Spectral organization, including dominant amplitude (DA) and mean spectral profile (MP), and 2) Temporospatial variability, using temporospatial correlation coefficients.
We studied 94 ATs in 71 patients who had undergone prior pulmonary vein isolation for AF and returned for a second ablation: 1) right atrial cavotricuspid-isthmus dependent (CTI) ATs (n=21); 2) left atrial macroreentrant ATs (n=41) and focal ATs (n=32). Right CTI ATs manifested higher DAs and lower MPs than left ATs, indicative of greater stability and less complexity in the frequency spectrum. Left macroreentrant ATs possessed higher temporospatial organization than left focal ATs.
CONCLUSIONS
Noninvasively recorded atrial waveform signal analyses show that right ATs possess more stable activation properties than left ATs, and left macroreentrant ATs manifest higher temporospatial organization than left focal ATs. Further prospective analyses evaluating the role these novel ECG-derived tools can play to help localize and identify mechanisms of common ATs in AF ablation patients are warranted.
Keywords: atrial fibrillation, atrial tachycardia, electrocardiography, spectral analysis, catheter ablation, atrial flutter
INTRODUCTION
Atrial tachycardias (AT) are among the most common and clinically significant complications for patients with atrial fibrillation (AF) who undergo catheter ablation.1 Recurrent sustained AT can lead to significant symptoms such as palpitations, fatigue, and even syncope, as well as tachycardia-induced cardiomyopathy, resulting in continued requirement for treatment, including additional ablation procedures.1, 2 Diagnoses of post-AF ablation ATs are difficult to perform for two main reasons: 1) visual inspection of electrocardiograms (ECGs) is limited by high incidence of atypical ECG morphologies, even for right atrial cavotricuspid isthmus (CTI)-dependent “typical” ATs, 2) activation mapping during electrophysiology (EP) studies can be limited by low amplitude, fractionated electrograms that preclude accurate analysis, and 3) entrainment mapping during EP studies can result in AT termination or transformation, therefore compromising the diagnostic ability of these maneuvers.3–7
There is therefore a need for improvement in diagnostic strategies that can help to characterize the differences among common AT subtypes in post-ablation AF patients more effectively. Past studies have utilized noninvasive, temporospatial methods of signal analyses to differentiate various types of right ATs from other supraventricular tachycardias such as atrioventricular nodal reentrant tachycardia in patients with no prior ablation treatment.8 We hypothesized that it is also possible to differentiate various types of post-AF ablation atrial tachycardias using noninvasive, surface ECG-derived analyses that incorporate spectral and temporospatial aspects of the atrial activation pattern. The primary goal of this study was to evaluate atrial waveform analyses derived from standard surface ECGs to assist with differentiating the locations and the mechanisms of common ATs in post-AF ablation patients.
METHODS
Study Population
We performed a retrospective study of 94 atrial tachyarrhythmias in 71 adult patients at Columbia University Medical Center, with paroxysmal or persistent atrial fibrillation who underwent prior pulmonary vein isolation for AF between 6/2010 and 12/2013 and returned for a repeat EP study and catheter ablation for recurrent AF and/or AT. All patients included in the study had atrial tachycardia or atrial fibrillation either as their baseline cardiac rhythm or when inducted by programmed cardiac stimulation during EP study. Data analysis was approved by the Institutional Review Board.
AF Radiofrequency Ablation and Electrophysiology Study
Patients included in this study had undergone an initial evaluation, which included past medical history, physical examination, and recent transthoracic and/or transesophageal echocardiogram. All had undergone a previous pulmonary vein isolation procedure with radiofrequency energy using wide area antrum isolation technique for treatment of AF. All had documented post-ablation atrial tachyarrhythmia. Exclusion criteria included patients with noninducible AT, or with an AT for whom confirmation of mechanism was not possible during EPS. Radiofrequency ablation during the procedures was performed during general anesthesia. Ablation during the second procedure consisted of pulmonary vein re-isolation if the previously noted lines of block had developed gaps of conduction, focal ablations for focal ATs, and/or linear atrial ablations for macroreentrant ATs, as was deemed necessary for each individual case. Linear radiofrequency ablations were performed from a site within the reentrant circuit to either an anatomical barrier or an area of observed conduction block. Linear ablations in the right atrium included ablation of the CTI, while linear ablations in the left atrium included the creation of left atrial roof and/or mitral isthmus lines of conduction block. For right-sided CTI-dependent AT, ablation was applied in a linear fashion, from the inferoseptal tricuspid annulus to the inferior vena cava. For peri-mitral annular AT, ablation was applied linearly from the mitral annulus to the left inferior pulmonary vein. For roof-dependent AT, ablation was applied linearly from left superior pulmonary vein to the right superior pulmonary vein. For focal AT, ablation was performed at the site of earliest activation. Confirmation of bidirectional conduction block was assessed whenever possible during these aforementioned procedures. At the conclusion of each case, data from the associated electrograms (EGMs) and electrocardiograms (ECGs) were collected for subsequent analysis.
Validation of Arrhythmia Location, Mechanism, and Classification
To validate AT location, entrainment mapping for all ATs was performed at a cycle length that was 20–30 msec shorter than the patient’s baseline tachycardia cycle length. Candidate sites were deemed to be located within a reentrant circuit if they had a post-pacing interval no more than 20 msec longer than the cycle length of the tachycardia. Accuracy of AT localization was demonstrated by the previously validated technique of examining for termination or transformation of the atrial tachycardia during radiofrequency ablation from a candidate site.9
To validate AT mechanism, each AT was analyzed by creating an intracardiac activation map using standard electroanatomical mapping (CARTO electroanatomical mapping system, Biosense Webster, Diamond Bar, CA). Macroreentrant tachycardia mechanisms were differentiated from focal tachycardia mechanisms (including true focal source or microreentry) by the following previously validated criterion: if activation mapping showed ≥ 90% of the total local electrogram spread to fall within a circuit diameter ≥ 3 cm, the tachycardia was deemed to be macroreentrant.10 In contrast, the atrial tachycardia was deemed to be focal (true focal or microreentry) in mechanism if the total length of the tachycardia cycle length fell into a circuit diameter < 3 centimeters and activation mapping showed a centrifugal spread of activation from a single point source. No attempt was made to distinguish between a true point source versus microreentry in a small location.
ATs were classified into one of the following common categories (Figure S1):
Right atrial cavotricuspid-isthmus (CTI) dependent, counterclockwise AT.
- Left atrial AT, including:
- Left Macroreentrant AT, composed of the following subtypes:
- Left peri-mitral (or mitral) annular AT
- Left roof-dependent AT
- Left Focal AT
Other types of right or left ATs were not included in analysis due to low representation. We performed standard 12-lead ECG data collection simultaneous with intracardiac electroanatomic mapping. Digitized signals of ECG data were collected in 8.4-second recording windows and stored on a recording system (CardioLab, GE, WI, USA). Waveform analysis was blinded to knowledge of the patients’ clinical background.
Spectral Analysis Using ECG-Derived Atrial Waveforms
ECGs were also analyzed by adapting previously validated spectral analysis techniques (Figure 1CD).11 First, an atrial tachycardia template without evident ventricular component was selected that encompassed between 60–100% of the atrial waveform being studied (Figure 1A). This template was then correlated to overlapping windows of the ECG of equal time duration over successive time points. In effect, this atrial template could generate a “correlation time series” of successive time-points for the ECG lead being studied using the Pearson correlation coefficient.8 The equation used for calculation is:
where for M pairs of data (Ak, Bm), between the template (Ak) and the ECG window (Bm). Over the duration of the ECG, this correlation time series varies periodically (from r = +1 to r = −1), where points of high correlation (i.e., where r is approximately equal to 1) identify recurrences of the prototypical template F-wave (Figure 1B). Furthermore, alternate correlation peaks are of lower magnitude because of the lack of wave correlation. This correlation series for each lead was defined as the r-wave for that lead.
Figure 1.
The ensemble average frequency spectra of the r-waves of atrial waveforms were then computed for each of the orthogonal leads I, aVF, V1 and V5.12 For this purpose, the r-waves were normalized to mean zero and unity variance. The atrial spectral characteristics measured during this study were the dominant amplitude and mean spectral profile (Table 1). The dominant amplitude (DA) is the measured amplitude of the dominant frequency, the latter of which is the largest fundamental periodic component in the frequency range of interest (i.e. 3–12 Hz).13 The mean spectral profile (MP) is the average power spectral level after adjusting the magnitude axis so the values ranged from 0 to 1. Notably, lower values of DA and higher values of MP indicate less stability/greater complexity of the arrhythmia being studied.12, 14 In addition, these values were also computed in a cohort of patients with right CTI ATs and no history of AF or ablation and then compared to those patients with right CTI AT after ablation in order to assess for a possible effect of pulmonary vein isolation on AT spectral profile characteristics.
Table 1.
List of Measured Parameters
| Parameter | Abbreviation | Description |
|---|---|---|
| Dominant Frequency | DF | Highest peak in frequency spectrum. Correlates to most commonly occurring frequency in spectrum. |
| Dominant Amplitude | DA | Magnitude of dominant frequency peak. Measures the extent to which that frequency is occurring. Higher DA implies more stable activation of a tachycardia. |
| Mean Spectral Profile | MP | Average level of the measured spectral profile. Measures stability/complexity of activation. Higher MP implies less stable activation of dominant frequencies/more complexity of activation, since less area under the total frequency spectrum is concentrated under the DA peak. |
| Temporospatial Correlation Coefficient | – | Comparison of atrial waveform template over time for ECG leads in the XY (I/aVF), YZ (aVF/V1), and XZ (I/V1) Cartesian planes. Can distinguish tachycardia types (e.g., left macroreentrant vs. focal) due to differences in waveform variability along different vector axes. |
Temporospatial Analysis Using ECG-Derived Atrial Waveforms
We adapted previously described techniques to calculate temporospatial correlation characteristics of atrial waveforms derived from ECGs.8, 15, 16 After computing r-wave correlation series for each lead (Figure 1B, as described above), we then compared these simultaneous correlation series in the XY, YZ, and XZ Cartesian planes using the following orthogonal ECG leads: X=lead I, Y=lead aVF, and Z=lead V1. The correlation r-wave values for each lead were plotted against those for the corresponding orthogonal lead at each time point (e.g., X=lead I vs. Y=lead aVF, so plane XY= leads I/aVF). This process was repeated for planes XZ (I/V1) and YZ (aVF/V1). These plots resulted in atrial loops for successive cycles characterizing the temporospatial properties of the atrial waveforms (Figure 1D). Then, in order to quantify the extent to which the atrial waveforms maintained their spatial vectors over time, maximum values of the correlations in each axis were used to define temporospatial correlation coefficients for each two-dimensional plane: = √(X2 + Y2). Temporospatial correlation coefficient values for XY, YZ, and XZ planes were compared for each type of AT (Table 1).
Statistical Analysis
Demographics were reported as a mean ± standard deviation. Comparisons of ECG measurements of ATs were analyzed by Student t-test for continuous variables. A p value of <0.05 was considered to be statistically significant. Scatterplots were made of calculated DAs and MPs, which were plotted versus one another, and then discriminant functions were used to determine the best classification of the data points to discern patient type. The sensitivity of the classification method (true positives divided by true positives plus false negatives) was computed and shown as a percent. Receiver operating characteristic (ROC) analysis was performed to express the diagnostic accuracy of the spectral analysis to diagnose right versus left ATs.
RESULTS
Patient Characteristics
Patient characteristics and demographic information are outlined in Table 2. There were 71 patients (53 male/18 female) with a mean age of 62 ± 12 years who had undergone a prior pulmonary vein isolation using radiofrequency energy for AF and developed documented recurrent ATs. The total number of atrial arrhythmias (baseline + induced) is listed by atrial location and mechanism: right CTI AT (n=21); left mitral AT (n=26); left roof AT (n=15); left focal AT (n=32). The total number of analyzed arrhythmias (94) exceeds total number of patients (71) because some patients manifested more than one type of AT during the EP study. In addition, 8 right-sided CTI-dependent ATs in patients without AF ablation were compared to the 21 right-sided ATs noted above.
Table 2.
Patient Characteristics
| Characteristic | Number (%) |
|---|---|
| Number of Patients | 71 |
| Male/Female Gender | 53 (75) / 18 (25) |
| Age (years) | 62 ± 12 (Range 27 – 81) |
| Left Atrial Size (cm) | |
| - Normal (≤ 4.1) | 7 (19) |
| - Mild-Moderately Enlarged (4.1–4.9) | 25 (69) |
| - Severely Enlarged (≥ 5.0) | 4 (11) |
| Left Ventricular Ejection Fraction (%) | |
| - Normal (≥ 55) | 28 (60) |
| - Mildly Decreased (45–54) | 13 (28) |
| - Moderately Decreased (35–44) | 2 (4) |
| - Severely Decreased (< 35) | 4 (9) |
Data are presented as mean ± SD, ranges and percentages. Left atrial size not available for 35 patients. Left ventricular ejection fraction not available for 24 patients.
ECG-Derived Spectral Analyses
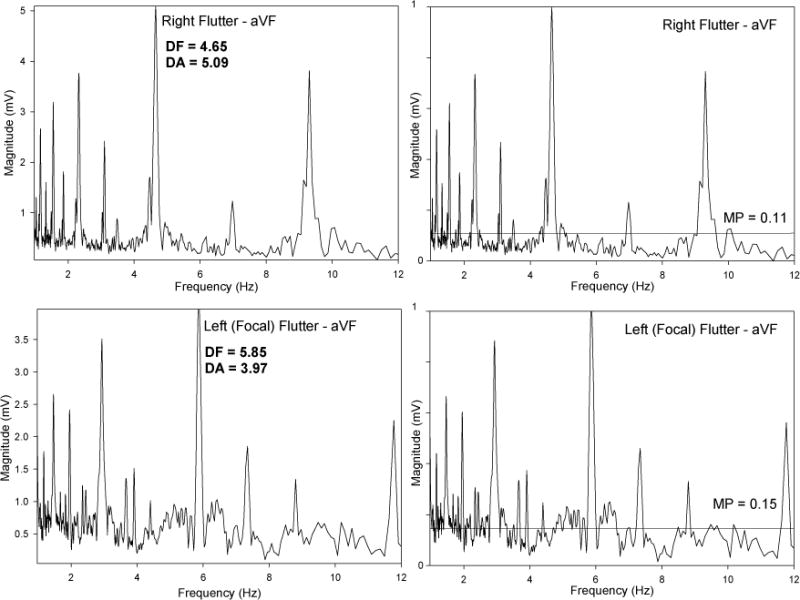
Figure 2 is a representative example of the spectral profile of a left mitral AT. The highest peak in the frequency spectrum is called the dominant frequency (DF), and the magnitude of that dominant frequency peak is called the dominant amplitude (DA). Similarly, the average level of the entire spectral profile is called the mean spectral profile (MP). The DA reflects the extent to which the frequency of that waveform is occurring at that particular frequency. Therefore, the more stable a circuit’s activation is, the greater the DA value (and higher the DA peak) will be. Similarly, the MP value will be lower, since more area under the total frequency spectrum will be concentrated under the DA peak rather than at other frequencies. Thus, calculation of DA and MP values allows for additional insights into the stability characteristics of the tachycardia, in addition to the frequency of activation (measured by the DF). For example, comparison of DA and MP among ATs of different mechanisms and locations can therefore be helpful for distinguishing them from each other, as noted in the following section.
Figure 2.
Comparison of Left AT vs. Right AT Using Spectral Analysis
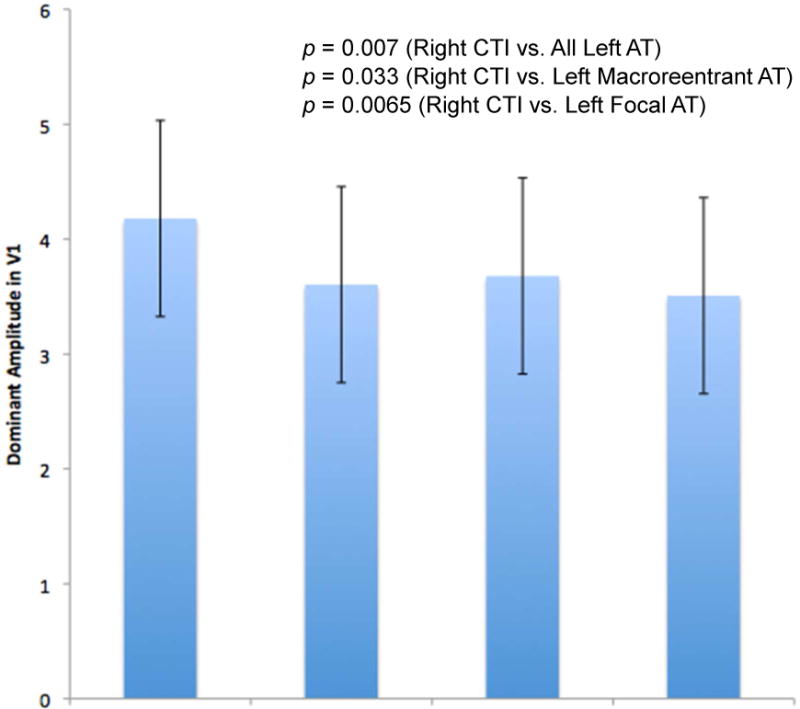
When comparing spectral characteristics of the surface ECGs of all the left ATs to the surface ECGs of right CTI ATs, a number of important differences were noted (Table 3). Right CTI ATs were found to have values consistent with increased stability and less complexity, as reflected by significantly higher DAs and lower MPs when compared with all left ATs (Figure 3). For example, DAs in lead V1 for right CTI ATs were 4.18 ± 0.84 and for all left ATs were 3.61 ± 0.85 (p=0.007). MPs in lead V1 for right CTI ATs were 0.156 ± 0.06 and for all left ATs were 0.188 ± 0.07 (p=0.028).
Table 3.
– Comparison of Dominant Amplitudes (DA) and Mean Spectral Profiles (MP) of Left-sided ATs versus Right-sided ATs.
| All Left ATs | Left Macro ATs | Left Focal ATs | Right CTI ATs | All Left vs. Right CTI | Left Macro vs. Right CTI | Left Focal vs. Right CTI | |
|---|---|---|---|---|---|---|---|
|
| |||||||
| n=73 | n=41 | n=32 | n=21 | ||||
| DA aVF | 3.56 | 3.70 | 3.39 | 4.14 | p = 0.007 | p = 0.069 | p = .001 |
| DA V1 | 3.61 | 3.68 | 3.51 | 4.18 | p = 0.007 | p = 0.033 | p = .007 |
| MP aVF | 0.186 | 0.18 | 0.194 | 0.152 | p = 0.033 | p = 0.109 | p = .020 |
| MP V1 | 0.188 | 0.183 | 0.194 | 0.152 | p = 0.028 | p = 0.063 | p = .033 |
Data for left atrial ATs are reported as a composite of all the left ATs combined (All Left ATs), as well as the two analyzed categories of left ATs: left atrial macro(reentrant) ATs ATs and left atrial focal ATs.
Figure 3.
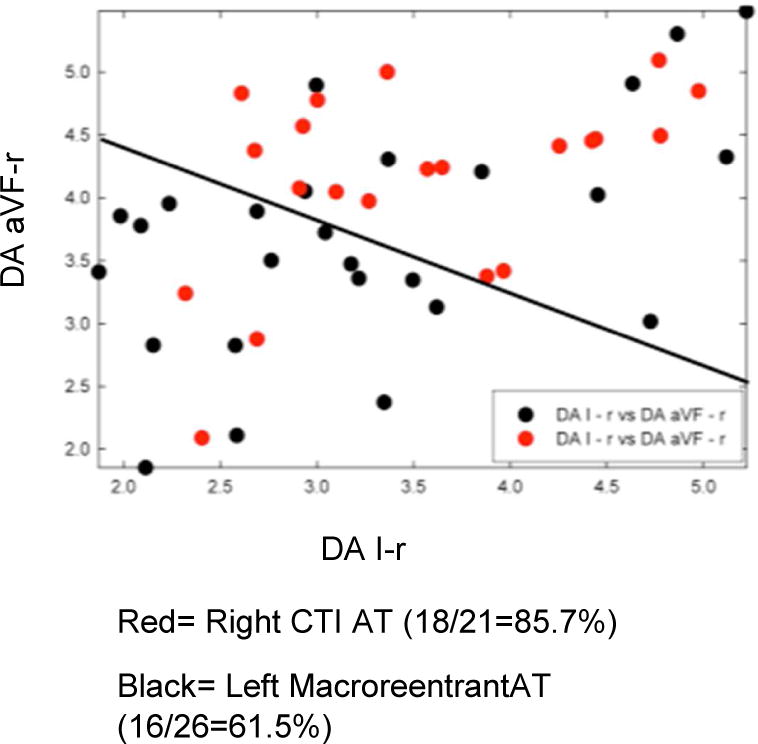
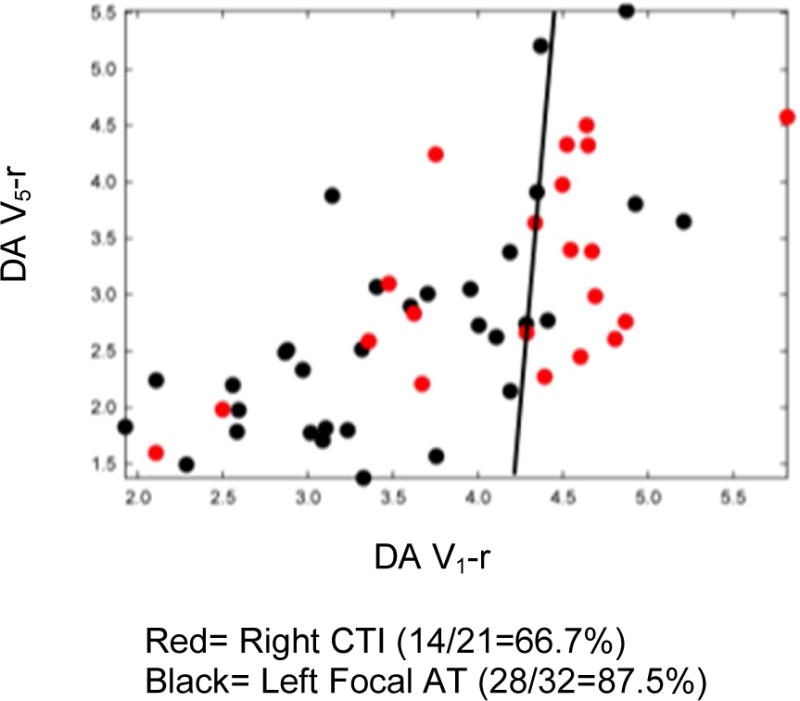
Increased organization in right CTI versus all left ATs persisted even when subtypes of left-sided ATs were further classified into either left macroreentrant AT or left focal AT, and then compared with the right CTI ATs (Figures 4A & 4B). Right CTI ATs maintained a significantly higher DA than left macroreentrant ATs in lead V1 (rightCTI DA=4.18 ± 0.84 vs. left macroreentrant AT DA= 3.68 ± 0.86, p = 0.033). Right CTI ATs also maintained a significantly higher DA and significantly lower MP versus left focal ATs (V1: right CTI AT DA= 4.18 ± 0.84 vs. left focal DA= 3.51 ± 0.84, p=0.0065). These values are consistent with greater stability and less random complexity in the activation patterns of right CTI ATs. Based on a mean DA in lead V1=4.18 ±0.84 for right CTI ATs and mean DA V1=3.61 ± 0.85 for all left ATs, it is possible to identify right atrial cavotricuspid isthmus-dependent ATs versus left ATs using a DA cutoff value ≥4.10 with specificity ≥0.70.
Figure 4.
Comparison of Right ATs with vs. without a History of PVI Ablation
Comparison of the cohort of 8 patients with right CTI ATs and no history of AF or ablation revealed no significant differences in DA or MP values (i.e., DA aVF=4.28, DA V1=3.91, MP aVF=0.127, MP V1=0.153) when compared to the right CTI AT patients who had undergone AF ablation.
ECG Waveform-Derived Temporospatial Loops
Figure 5 is a representative example of the temporospatial loops derived from two different types of ATs. These loops can be used to compare the differences in atrial waveform morphologies. Atrial waveform templates derived from an ECG lead are compared to subsequent ones to arrive at a correlation value for that lead. Then the correlation values from two leads at each sampling point are plotted on x and y-axes. On visual inspection alone, the focal ATs manifest higher variability. These temporospatial correlation coefficient values can be used to distinguish tachycardia types due to differences in waveform variability along vector axes, as noted in the following section.
Figure 5.
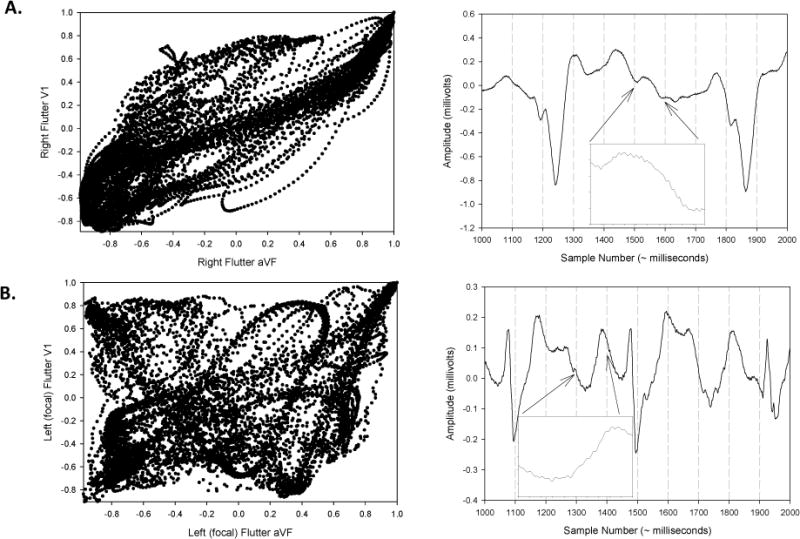
Left macroreentrant (i.e., mitral & roof) AT vs. Focal AT Using Temporospatial Analysis
Temporospatial correlation coefficient values (see Methods section) derived from atrial waveform analysis were able to help differentiate macroreentrant ATs (i.e., both left mitral AT and left roof AT) from left focal ATs (Figure S2). All left macroreentrant ATs, when grouped together, had a greater mean temporospatial correlation coefficient than left focal ATs (Cartesian planes I/aVF (i.e., XY): left macroreentrant AT= 0.414 ± 0.26 vs. left focal AT= 0.276 ± 0.20, p=0.015.
These findings remained similar when the left macroreentrant ATs were divided into the left mitral and left roof AT subtypes, and then each compared to left focal ATs. Left mitral ATs manifested significantly greater mean correlation coefficients versus the left focal ATs in leads I vs. aVF (i.e., XY plane) (left mitral AT 0.454 ± 0.22 vs. left focal AT 0.276 ± 0.20, p=0.02), while left roof ATs manifested a non-significant trend for greater coefficients than left focal ATs (left roof AT 0.346 ± 0.31 vs. left focal AT 0.276 ± 0.20, p=0.35). ECG waveform analysis was not able to distinguish between the macroreentrant left mitral AT and left roof AT subtypes (left mitral AT 0.454 ± 0.22 vs. left roof AT 0.346 ± 0.31, p=0.21).
DISCUSSION
Main Findings
Simple visual ECG inspection is often sufficient to differentiate between rhythms such as AF versus AT, even after a previous catheter ablation procedure. However, the specificity of ECG findings for accurate diagnoses of post-ablation AT subtypes is compromised after catheter ablation of atrial substrate in AF patients.3, 4 Therefore, visual diagnosis of ATs, including even the common type of right atrial flutter, can be fraught with difficulty.
The main findings of this study are: 1) Significant differences exist in ECG-derived spectral characteristics between common types of left atrial ATs vs. right atrial ATs; and 2) Significant differences in ECG-derived temporospatial properties exist between left macroreentrant AT vs. left focal ATs. These findings are particularly relevant because they show that robust noninvasive techniques of ECG-derived waveform analyses may help to:
Localize commonly encountered post-AF ablation ATs to the right atrium versus the left atrium based on greater degree of spectral organization of right CTI ATs (i.e., higher DA and lower MP in right CTI ATs vs. all left ATs).
Identify the underlying mechanism of left macroreentrant vs. focal ATs based on higher temporospatial correlation characteristics of left macroreentrant ATs.
Clinical Implications/Significance
Since catheter ablation procedures for treatment of AF have become widespread, there has been a substantial rise in post-ablation ATs that require further treatment with a second catheter ablation. The mechanisms of these ATs can be complex, resulting in long procedures involving detailed mapping. Furthermore, the usual surface ECG patterns used for diagnosis of ATs may be obscured and less reliable following a previous catheter ablation, especially if large left atrial antral areas were excluded. Finally, attempts to minimize the amount of entrainment mapping can help to decrease the possibility of AT transformation and/or termination during those maneuvers.5, 6 Therefore, any improvements in noninvasive ECG-based analyses of ATs that can provide insight regarding the location and the mechanism of the clinical AT can help with the planning and implementation of catheter ablation procedures.
The qualitative differences in spectral characteristics, specifically DA and MP, can be translated into quantitative values that can help to characterize right versus left ATs. That is, diagnostic specificity can be calculated and used to assess the extent to which cut-off DA values could accurately distinguish right versus left ATs. Such information could expedite localization of these tachycardias and the ablation procedure itself. In addition, differences in waveform variability as manifested in temporospatial correlation coefficient differences can also help to localize left ATs more efficiently. For example, significant differences between focal and macroreentrant ATs can be used to distinguish these AT subtypes.
Finally, when comparing the cohort of patients with typical right atrial flutter who did not undergo pulmonary vein isolation to those patients with typical right atrial flutter who did undergo ablation, there was no difference in spectral characteristics. Therefore, even if left atrial ablation can cause ECG waveforms to appear atypical, pulmonary vein isolation does not appear to change the measured spectral waveform characteristics of typical right-sided ATs to a significant degree.17 These results are potentially quite useful, since they point out a noninvasive method to distinguish right from left ATs in the setting of atypical ECG characteristics.
These results are also hypothesis-generating, as they offer insight into possible mechanistic differences among AT subtypes. That is, anatomic constraints (e.g., imposed by the tricuspid valve and inferior vena cava for right cavotricuspid isthmus ATs, or the mitral valve and left inferior pulmonary vein for mitral annular ATs) may limit the degree of waveform variability that these ATs can manifest. This may be the reason for the relatively higher temporospatial correlation coefficient values of right cavotricuspid and left mitral ATs, as compared to left atrial roof and focal ATs, whose activation patterns may not be as constrained in the left atrium. Further assessment of whether incorporation of these signal analytical techniques during real-time EP studies can help to diagnose AT locations and mechanisms is warranted.
Comparison to Prior Studies
Prior investigators have reported that ATs often manifest atypical morphologies in post-AF ablation patients. For example, Yoyokawa et al. described that approximately 20% of ATs in persistent AF ablation patients were due to a small reentrant circuit, manifesting ECGs with short p-wave duration and long diastolic intervals, and concluded that such insights derived from ECG analysis “would be helpful during mapping of post-ablation ATs.”4 Chyou et al. reported on the atypical electrocardiographic features of CTI-dependent atrial flutter in AF ablation patients, concluding that 85% of CTI-dependent right ATs had atypical features on ECG analysis.3 These findings point out the atypical nature of many ATs that occur in post-ablation patients, the diagnostic difficulties inherent in visual inspection of ECGS in such patients, and the need for more refined methods to noninvasively diagnose these ATs.
Investigators have previously utilized a variety of noninvasive techniques to analyze electrocardiogram waveforms in patients with arrhythmias. For example, Narayan et al. reported on the efficacy of spatial methodologies, including correlation in spatial planes, to distinguish right atrial flutters from other supraventricular tachycardias and atrial fibrillation.8 Hoppe et al. reported on the ability of spectral analysis to distinguish atrial flutter from atrial fibrillation in a cohort of 39 patients.18 These investigators were able to use spectral analysis of activation cycles to identify more organized atrial flutters, which were manifested as solitary activation cycles, from the more disorganized activation cycles of atrial fibrillation. Narayan et al. also reported on the use of wavefront variability and temporospatial loops to separate isthmus from non-isthmus dependent atrial flutters in a cohort of 62 patients with stable macroreentry.16 Finally, Brown et al. noted that shorter F-wave duration correlated with focal (vs. macroreentrant) atrial tachycardia etiology in a group of 41 patients.19
Our data extend these prior investigations in several important ways. This study used the novel diagnostic techniques of spectral and temporospatial signal analysis techniques specifically to analyze left atrial tachycardia subtypes in addition to right atrial tachycardias in post-AF ablation patients. This cohort of patients has not been well-represented or characterized in previous studies, having been excluded from prior investigations for reasons that included the possibility of ablation confounding atrial activation and waveform characteristics.8, 16, 18, 19 In addition, these analyses were compared between patients with right cavotricuspid ATs who had undergone pulmonary vein isolation to a cohort of patients who had not undergone ablation.
Study Limitations
This study included a relatively small patient population possessing different baseline clinical characteristics, including age, gender, and baseline cardiac structure and function. However, the data were collected in a relatively homogeneous manner using ECGs in a real-world population of post-AF ablation patients. Right atrial and left ATs were limited to commonly encountered types and mechanisms. Therefore, conclusions cannot be made with regard to other types of atypical macroreentrant or focal ATs. Another limitation is that the data analysis was performed retrospectively. However, the waveform analysis was blinded to any information related to the patients’ clinical background. We emphasize also that the ECG frequency and waveform analyses of post-ablation tachycardias should not be generalized to patients with atrial tachycardias who have not undergone a previous ablation procedure. In addition, the possibility that left atrial linear ablation could lead to different results is unclear. Finally, the extent to which these diagnostic methods can be incorporated into real time electrophysiology studies for AF ablation patients remains to be validated in further prospective analyses.
CONCLUSION
Novel, noninvasive, ECG-derived analytical techniques show significant differences among different types of ATs in patients who have previously undergone catheter ablation procedures for AF. These techniques may therefore be able to help to: (i) localize right versus left ATs, and (ii) identify and differentiate focal versus macroreentrant mechanisms. Further analyses that prospectively incorporate these ECG-based diagnostic techniques into the real-time setting of electrophysiology studies during AF catheter ablation procedures are warranted (e.g., by utilizing these diagnostic tools to analyze and predict AT locations in a prospective validation EP study).
Supplementary Material
Acknowledgments
The authors acknowledge Carmen Castillo for assistance with data collection.
AB is supported by National Heart, Lung, and Blood Institute Career Development Award K23HL105893. This publication was supported in part by the National Heart, Lung, and Blood Institute of the National Institutes of Health under award number 1K23HL105893, and the National Center for Advancing Translational Sciences, National Institutes of Health, through Grant Number UL1 TR000040, formerly the National Center for Research Resources, Grant Number UL1 RR024156. VI is supported by National Heart, Lung, and Blood Institute Career Development Award K08HL116790. The content is solely the responsibility of the authors and does not necessarily represent the official views of the NIH.
Abbreviations
- AF
atrial fibrillation
- AT
atrial tachycardia
- CTI
cavotricuspid isthmus
- DA
amplitude of dominant frequency peak
- DF
dominant frequency
- ECG
electrocardiogram
- EGM
electrogram
- EP
electrophysiology
- MP
mean spectral profile
Footnotes
Disclosures: None
References
- 1.Riley MJ, Marrouche NF. Ablation of atrial fibrillation. Current problems in cardiology. 2006;31:361–390. doi: 10.1016/j.cpcardiol.2006.01.002. [DOI] [PubMed] [Google Scholar]
- 2.Blomstrom-Lundqvist C, Scheinman MM, Aliot EM, Alpert JS, Calkins H, Camm AJ, Campbell WB, Haines DE, Kuck KH, Lerman BB, Miller DD, Shaeffer CW, Stevenson WG, Tomaselli GF, Antman EM, Smith SC, Jr, Alpert JS, Faxon DP, Fuster V, Gibbons RJ, Gregoratos G, Hiratzka LF, Hunt SA, Jacobs AK, Russell RO, Jr, Priori SG, Blanc JJ, Budaj A, Burgos EF, Cowie M, Deckers JW, Garcia MA, Klein WW, Lekakis J, Lindahl B, Mazzotta G, Morais JC, Oto A, Smiseth O, Trappe HJ, European Society of Cardiology Committee N-HRS Acc/aha/esc guidelines for the management of patients with supraventricular arrhythmias–executive summary. A report of the american college of cardiology/american heart association task force on practice guidelines and the european society of cardiology committee for practice guidelines (writing committee to develop guidelines for the management of patients with supraventricular arrhythmias) developed in collaboration with naspe-heart rhythm society. Journal of the American College of Cardiology. 2003;42:1493–1531. doi: 10.1016/j.jacc.2003.08.013. [DOI] [PubMed] [Google Scholar]
- 3.Chyou JY, Hickey K, Diamond L, Whang W, Dizon J, Garan H, Biviano A. Atypical electrocardiographic features of cavotricuspid isthmus-dependent atrial flutter occurring during left atrial fibrillation ablation. Annals of noninvasive electrocardiology : the official journal of the International Society for Holter and Noninvasive Electrocardiology, Inc. 2010;15:200–208. doi: 10.1111/j.1542-474X.2010.00364.x. [DOI] [PMC free article] [PubMed] [Google Scholar]
- 4.Yokokawa M, Latchamsetty R, Ghanbari H, Belardi D, Makkar A, Roberts B, Saint-Phard W, Sinno M, Carrigan T, Kennedy R, Suwanagool A, Good E, Crawford T, Jongnarangsin K, Pelosi F, Jr, Bogun F, Oral H, Morady F, Chugh A. Characteristics of atrial tachycardia due to small vs large reentrant circuits after ablation of persistent atrial fibrillation. Heart Rhythm. 2013;10:469–476. doi: 10.1016/j.hrthm.2012.12.018. [DOI] [PubMed] [Google Scholar]
- 5.Gerstenfeld EP, Callans DJ, Dixit S, Russo AM, Nayak H, Lin D, Pulliam W, Siddique S, Marchlinski FE. Mechanisms of organized left atrial tachycardias occurring after pulmonary vein isolation. Circulation. 2004;110:1351–1357. doi: 10.1161/01.CIR.0000141369.50476.D3. [DOI] [PubMed] [Google Scholar]
- 6.Gerstenfeld EP, Callans DJ, Sauer W, Jacobson J, Marchlinski FE. Reentrant and nonreentrant focal left atrial tachycardias occur after pulmonary vein isolation. Heart Rhythm. 2005;2:1195–1202. doi: 10.1016/j.hrthm.2005.08.020. [DOI] [PubMed] [Google Scholar]
- 7.Gerstenfeld EP, Dixit S, Bala R, Callans DJ, Lin D, Sauer W, Garcia F, Cooper J, Russo AM, Marchlinski FE. Surface electrocardiogram characteristics of atrial tachycardias occurring after pulmonary vein isolation. Heart Rhythm. 2007;4:1136–1143. doi: 10.1016/j.hrthm.2007.05.008. [DOI] [PubMed] [Google Scholar]
- 8.Narayan SM, Feld GK, Hassankhani A, Bhargava V. Quantifying intracardiac organization of atrial arrhythmias using temporospatial phase of the electrocardiogram. Journal of cardiovascular electrophysiology. 2003;14:971–981. doi: 10.1046/j.1540-8167.2003.03213.x. [DOI] [PubMed] [Google Scholar]
- 9.Shah D. Ecg manifestations of left atrial flutter. Current opinion in cardiology. 2009;24:35–41. doi: 10.1097/HCO.0b013e32831ca5a8. [DOI] [PubMed] [Google Scholar]
- 10.Chae S, Oral H, Good E, Dey S, Wimmer A, Crawford T, Wells D, Sarrazin JF, Chalfoun N, Kuhne M, Fortino J, Huether E, Lemerand T, Pelosi F, Bogun F, Morady F, Chugh A. Atrial tachycardia after circumferential pulmonary vein ablation of atrial fibrillation: Mechanistic insights, results of catheter ablation, and risk factors for recurrence. Journal of the American College of Cardiology. 2007;50:1781–1787. doi: 10.1016/j.jacc.2007.07.044. [DOI] [PubMed] [Google Scholar]
- 11.Ciaccio EJ, Biviano AB, Whang W, Wit AL, Garan H, Coromilas J. New methods for estimating local electrical activation rate during atrial fibrillation. Heart Rhythm. 2009;6:21–32. doi: 10.1016/j.hrthm.2008.10.016. [DOI] [PubMed] [Google Scholar]
- 12.Ciaccio EJ, Biviano AB, Garan H. The dominant morphology of fractionated atrial electrograms has greater temporal stability in persistent as compared with paroxysmal atrial fibrillation. Comput Biol Med. 2013;43:2127–2135. doi: 10.1016/j.compbiomed.2013.08.027. [DOI] [PubMed] [Google Scholar]
- 13.Ciaccio EJ, Biviano AB, Whang W, Gambhir A, Garan H. Spectral profiles of complex fractionated atrial electrograms are different in longstanding and acute onset atrial fibrillation atrial electrogram spectra. J Cardiovasc Electrophysiol. 2012;23:971–979. doi: 10.1111/j.1540-8167.2012.02349.x. [DOI] [PMC free article] [PubMed] [Google Scholar]
- 14.Biviano AB, Ciaccio EJ, Gabelman T, Whang W, Garan H. Ibutilide increases the variability and complexity of atrial fibrillation electrograms: Antiarrhythmic insights using signal analyses. Pacing Clin Electrophysiol. 2013;36:1228–1235. doi: 10.1111/pace.12224. [DOI] [PMC free article] [PubMed] [Google Scholar]
- 15.Kahn AM, Krummen DE, Feld GK, Narayan SM. Localizing circuits of atrial macroreentry using electrocardiographic planes of coherent atrial activation. Heart Rhythm. 2007;4:445–451. doi: 10.1016/j.hrthm.2006.12.042. [DOI] [PMC free article] [PubMed] [Google Scholar]
- 16.Narayan SM, Hassankhani A, Feld GK, Bhargava V. Separating non-isthmus- from isthmus-dependent atrial flutter using wavefront variability. Journal of the American College of Cardiology. 2005;45:1269–1279. doi: 10.1016/j.jacc.2004.12.070. [DOI] [PubMed] [Google Scholar]
- 17.Morady F, Oral H, Chugh A. Diagnosis and ablation of atypical atrial tachycardia and flutter complicating atrial fibrillation ablation. Heart Rhythm. 2009;6:S29–32. doi: 10.1016/j.hrthm.2009.02.011. [DOI] [PubMed] [Google Scholar]
- 18.Hoppe BL, Kahn AM, Feld GK, Hassankhani A, Narayan SM. Separating atrial flutter from atrial fibrillation with apparent electrocardiographic organization using dominant and narrow f-wave spectra. Journal of the American College of Cardiology. 2005;46:2079–2087. doi: 10.1016/j.jacc.2005.08.048. [DOI] [PubMed] [Google Scholar]
- 19.Brown JP, Krummen DE, Feld GK, Narayan SM. Using electrocardiographic activation time and diastolic intervals to separate focal from macro-re-entrant atrial tachycardias. Journal of the American College of Cardiology. 2007;49:1965–1973. doi: 10.1016/j.jacc.2006.10.080. [DOI] [PubMed] [Google Scholar]
Associated Data
This section collects any data citations, data availability statements, or supplementary materials included in this article.