Abstract
One of the major issues potentially limiting treatment planning with solely MR images is the possibility of geometric distortion inherent in MR images. We designed a large distortion phantom containing a 3D array of spheres and proposed a three-dimensional (3D) approach to determine the distortion of MR image volume. The approach to overcome partially filled spheres is also presented.
The phantom was assembled with a 3D array of spheres filled with contrast and was scanned with a 3T MRI simulator. A 3D whole-sphere or half-sphere template is used to match the image pattern. The half-sphere template is used when the normalized cross-correlation value for the whole-sphere template is below a predetermined threshold. Procrustes method was applied to remove the shift induced by rotation and translation of the phantom. Then the distortion map was generated. Accuracy of the method was verified using CT images of a small phantom of the same design.
The analysis of the small phantom showed that the method is accurate with an average offset of estimated sphere center 0.12 ± 0.04 mm. The Procrustes analysis estimated the rotation angle to be 1.95° and 0.01°, respectively, when the phantom was placed at 2° and 0° from the ceiling laser. The analysis showed that on the central plane through the magnet center, the average displacement is less than 1 mm for all radii. At distal planes, when the radius is less than 18 cm, the average displacement is less than 1 mm. However, the average displacement is over 1 mm but still less than 1.5 mm for larger radii.
A large distortion phantom was assembled and analysis software was developed to characterize distortions in MRI scans. The use of two templates helps reduce the potential impact of residual air bubbles in some of the spheres.
Keywords: MR image, distortion, sub-voxel accuracy, template matching, normalized cross correlation
I. Introduction
Magnetic resonance imaging (MRI) provides superior contrast to other imaging modalities such as computed tomography (CT), and MRI has become an integral tool to aid precision interventions such as neurosurgery and radiation therapy. However, possible geometric inaccuracies in MR images have relegated its role as an adjunct to CT for some precision surgical procedures (Alexander et al 1995) and has been a cause for concern in precision radiation therapy (Fraass et al 1987). Several factors affect the geometric accuracy in MR images, including B0 field inhomogeneity, the nonlinearity of the gradient field, and tissue magnetic susceptibility variations. The propagation of MR systems with higher field strength, while more attractive to clinical use because of the better signal-to-noise ratio in anatomical imaging (Schmitz et al 2005), further raises distortion concerns (Baldwin et al 2007). Gradient coils with fast slew rates are important for fast scanning, but consequentially may result in systems with higher gradient field nonlinearity (Wang et al 2004). While ‘open’ widebore systems are more patient friendly, such designs may compromise B0 field homogeneity (Baldwin et al 2007). All of these issues magnify for radiation therapy utilization outside of the head, where there is increased need for minimal distortion over large fields of view (FOVs). Characterization of distortion over large FOVs is thus of importance to support MRI utilization to guide precision therapies.
The geometric distortion of MR images has been evaluated using phantoms (Walton et al 1996, Bednarz et al 1999, Tanner et al 2000, Mizowaki et al 2000, Breeuwer et al 2001, Yu et al 2001, Koch et al 2003, Wang and Doddrell 2004, Wang et al 2004a, 2004b, Doran et al 2005, Jovicich et al 2006, Karger et al 2006, Baldwin et al 2007, Gunter et al 2009, Stanescu et al 2010, Dammann et al 2011), tissue (Sumanaweera et al 1994) and patient studies (Alexander et al 1995, Bednarz et al 1999, Li et al 2008). Bednarz et al (1999) studied the distortion using the Leksell fixation frame, a skull phantom with a test object imbedded, and an additional head phantom with catheters as markers. Scanning with phantoms containing landmarks (rods, grids, spheres, etc.) at designed locations provides a clear view of the distortion in MR images and also gives a way to analyze the distortion quantitatively by comparing the estimated coordinates of the landmarks to their designed values. Phantoms with rods (or vials) inserted in one direction (Walton et al 1996, Koch et al 2003), and two dimensional (2D) grids (Mizowaki et al 2000) were used for the study of distortion in two dimensions (2D). For 2D phantoms, separate scans for each different orientation or position need to be done in order to study the distortion in three dimensions (3D). To overcome this limitation, Tanner et al (2000), Yu et al (2001), and Doran et al (2005) designed phantoms with rods in three orthogonal planes so the distortion in three dimensions could be evaluated in a single scanned image volume. Wang et al (2004a, 2004b), Wang and Doddrell (2004), Baldwin et al (2007), Stanescu et al (2010), and Dammann et al (2011) used phantoms with 3D grid arrays inside to study distortion. 3D phantoms with arrays of spheres were also used in the evaluation (Breeuwer et al 2001, Jovicich et al 2006). There were also phantoms with special patterns used in distortion evaluation (Karger et al 2006, Gunter et al 2009). Recently, Walker et al (2015) developed a full field of view phantom with arrays of vitamin E capsules inserted to study the effect of table speed on the image distortion. The field strength of the MR system in these studies ranged from 0.2 T to 7 T, with most studies done with 1.5 T systems.
If a rod phantom is analyzed using a 2D method, because of the phenomenon of through-plane distortion, the measured distortion may be inaccurate, particularly in the outer-regions of the field of view (Doran et al 2005). Wang et al (2004b) suggested a method that was followed and improved by others (Baldwin et al 2007, Stanescu et al 2010) to locate landmarks, which were referred to as control points in their paper, in a 3D grid phantom. In these methods, image enhancements were used to emphasize the grid feature and the coordinates of the control points along three principal axes were determined one by one using the first moments of the magnitude of the first derivatives. Phantoms with spherical structures with rods were used to map distortion with a combined 2D/3D approach (Breeuwer et al 2001) or a method using the product of cross-correlation maps achieved with two templates (Gunter et al 2009). One template is a bright sphere in dark background and the other is a bright sphere with two voxels’ dark shell in bright background. Then the intensity threshold varies until a cluster overlapping the correlation maximum and containing between 75% and 110% of the expected volume is found. The final sphere center is estimated as the intensity weighted average position of voxels in the sphere. In the study from Walker et al, the phantom was scanned using both CT and MR scanners. The CT images served as the gold standard and the MR images were registered to CT using a deformable B-spline registration. Then geometric distortion of MR images was determined. The authors mentioned that the registration algorithm performed well in the central regions and not so well at high distortion regions at the FOV edges in the static acquisitions (Walker et al 2015).
In this study, a distortion phantom with large dimension was developed and used to evaluate the geometric distortion of a 3T MR Simulator (Siemens Skyra) in our department. A 3D array of spheres served as landmarks in the phantom. The benefits of the machined spheres are the machining accuracy, stability and ease of manufacturing. The CNC machine that was used to machine the parts is very reliable to ±0.025 mm in terms of positioning in X, Y, and Z directions. Also, the geometric spherical shape allows searching the center of the sphere from any slice and any orientation, which would be another benefit in terms of automatic analysis. We proposed a method to use 3D templates to identify the center of the spheres in the image volume using 3D normalized cross correlation (NCC) coefficient. With 3D template matching, the 3D coordinates of each sphere in three directions were identified simultaneously. While it was noticed in Wang’s study (Wang et al 2004a) that the variability in signal intensity affected successful extraction of the control point positions, in contrast, our method uses 3D NCC for template matching and the variation of the image intensity will not affect the results (Brown 1992). We used Procrustes analysis (Goodall 1991) to remove the rotational influence due to the imperfect placement of the distortion phantom on the scanning couch. The accuracy of this method was verified using CT images of a small phantom of the same design. In this paper, the distortion measured is the residual distortion after the vendor’s inherent distortion correction has been applied. However, this method does not rely on the inherent distortion correction.
II. Methods
II.A. Design and construction of distortion phantom
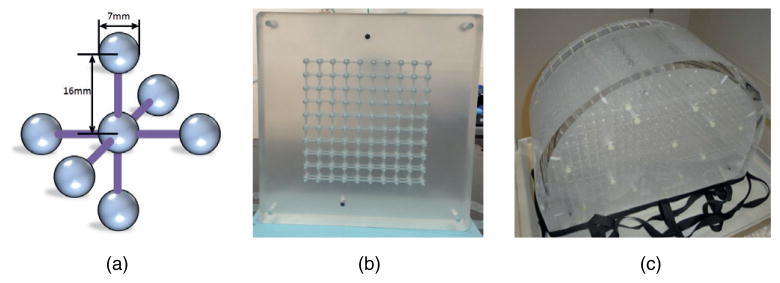
The phantom architecture was based on the assembly of a series of plates to yield a precise grid of arbitrary size. The plates were milled (with 0.1 mm tolerance) to yield regular patterns of half-spheres connected by half-channels on both sides. Stacking the plates together generated full spheres connected by cylindrical channels. The initial phantom design contained 7 mm diameter spheres with center-to-center separations of 16 mm in all directions (figure 1(a)). Plates were stacked with pinned attachments for precise alignment, and holes through the entire stack were used to run rods through that were anchored at the ends by nuts, thus providing further compression to further ensure precision in phantom assembly.
Figure 1.
Phantom design.
Two phantoms were constructed using this design. A small (254 mm × 254 mm × 46 mm) prototype was built containing a 10 × 10 × 2 sphere array. This prototype CT phantom was used for testing the accuracy of assembly and data analysis (figure 1(b)). A second, large volume, phantom was assembled for MRI imaging and evaluation (figure 1(c)). This phantom has dimensions of 465 mm × 350 mm × 168 mm, distributed in 9 planes, with 521 spheres in each plane. Each plane has 21 rows of spheres, and was shaped to fill the majority of the axial cross section of a wide-bore MRI scanner that we installed for use as a simulator (Siemens SKYRA), with the number of spheres on each row increasing from 9 on the top to 29 at the bottom. The phantom was assembled plate by plate while submerged in a tank full of MR contrast solution (0.4 mmol l−1 NiCl2). So the spheres were filled with the solution by sandwiching solution in between two adjoining plates. Solution can flow through all the spheres and channels as they are connected to two openings on the outer surface of the phantom. In the phantom design, the material was chosen such that the susceptibility difference led to insignificant distortions for the bandwidths used in our scanning protocols. The phantom was made of acrylic (PMMA), which is one of the most MR-compatible materials, with only −0.023 ppm difference from water (Tanner et al 2000, Wapler et al 2014). The molar concentration of the NiCl2 solution was determined using its molar magnetic susceptibility (6145 × 10−6 cm3 mol−1) (Lide 2000). 0.4 mmol l−1 NiCl2 induces the field inhomogeneity for about 0.85 ppm.
II.B. Imaging of the phantom
In this study, the MRI distortion phantom was scanned on our in-house 3T MRI simulator (Skyra, Siemens Medical Systems, Erlangen, Germany). The phantom was positioned so that the largest cross section was in the axial plane, and the center of the phantom was in the center of the bore. As the couch and indexed table surface of the scanner occupy posterior space in the magnet, the geometric center of the bore was closer to the posterior region of the phantom. A 3D T1-weighted imaging sequence (VIBE, bandwidth of 440 Hz/pixel, 9 degree flip angle, TR 4.39 ms and TE 2.03 ms) was used to acquire a volume with field of view of 500 × 500 × 176 mm with a spatial resolution of 0.98 × 0.98 × 1 mm. The body transmitting coil and body receiving coil were used in the acquisition. The inherent intensity non-uniformity correction (Prescan Normalize) was not applied and the vendor-supplied gradient non-linearity correction was applied to the image volumes prior to analysis. With this bandwidth, the distortion induced by the susceptibility of the phantom is about 1/4 of a voxel. The CT phantom was scanned helically using a Philips Brilliance 16-slice CT scanner at 120 kVp and 250 mA, with a voxel size of 0.7 mm × 0.7 mm × 0.7 mm. Scans were performed with the phantom aligned directly with the laser, as well as with the phantom rotated 2° about the anterior-posterior axes (defined by rotation away from the ceiling laser-defined axial plane).
II.C. Image distortion analysis
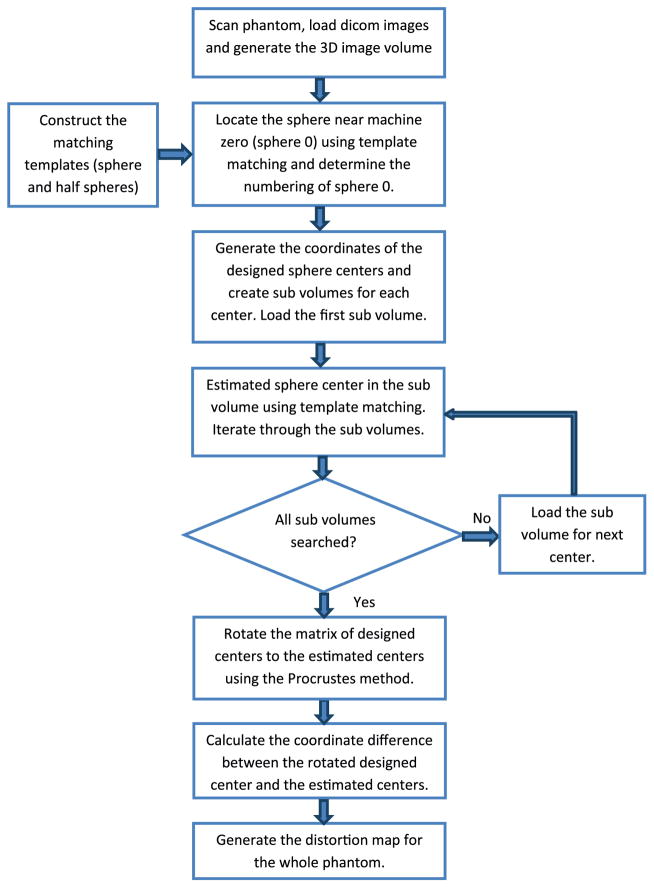
The procedure for distortion analysis is diagrammed in figure 2. First, the images of the distortion phantom are loaded to our in-house software and a 3D image volume matrix of the phantom is created. The distortion of the image volume at different places is determined by locating the sphere centers in the volume and comparing the coordinates of the estimated centers to their designed values. Estimated center locations of the spheres are found using 3D template matching. It is highly likely that the phantom cannot be positioned (translational and rotational) to a precision that is higher than the sphere location accuracy, and thus there could be a rigid transformation (translation and rotation) that would be present in the difference between measured and calculated coordinates. Thus efforts are taken to remove the translation (average coordinate of detected sphere centers) and rotation (orthogonal Procrustes method (Goodall 1991)). After removing the influence of these factors, the displacements of the estimated centers from their designed locations are determined and the distortion map of the imaging volume is generated by cubic interpolation between the center locations.
Figure 2.
Procedure for distortion analysis.
The distortion pattern depends on the MR scanner and the scanning sequence. The results shown in this study are for the 3D T1-weighted Vibe sequence of the 3T MR Simulator (Siemens Skyra) in our department. However, the method is not limited to any specific sequences or scanners.
II.C.1. 3D template matching and normalized cross correlation coefficient
3D template matching is used to locate the position of the sphere centers in the image volume. The similarity between the templates and the actual images of spheres in the image volume is calculated by the 3D NCC coefficient. Details about NCC and a fast method to do the calculation in two dimensions have been discussed by Lewis (1995) and Briechle (2001). The normalized cross correlation in 3D is
| (1) |
where γ is the normalized cross correlation coefficient between the template t and image volume f that is overlapped with the template at point (u, v, w). f(x, y, z) is the image intensity at point (x, y, z) in the image volume. f̄u,v,w is the average value of the intensity of the image volume overlapped with the template t, and t̄ is the average intensity value of the template. The advantage of using NCC for template matching is that it removes the influence of any underlying intensity variation and focuses only on the image pattern itself. Although the scanning sequence used the vendor-supplied pre-scan normalization to reduce such variation, residual intensity variation was observed, and the use of NCC reduced the impact of such residual variation on the accuracy of finding sphere centers. γ values range from 0 (no correlation) to 1 (identical match).
The localization of the sphere centers in the phantom starts with locating the sphere center closest to the (0, 0, 0) coordinate in the image space (nominally the center of the MRI bore). A search is performed over a 23 mm × 23 mm × 23 mm volume of interest (VOI) centered at the (0, 0, 0) coordinate. In this VOI, at least one whole sphere will be included given the diameter of the sphere 7 mm and the center to center distance 16 mm. After localization of the sphere around machine zero, the remaining spheres are found by cross-correlation following a search pattern according to the phantom design. The estimated center for each sphere is then determined by template matching within a 16 mm × 16 mm × 16 mm VOI centered at the expected (i.e. with no distortion) sphere center. In each VOI, γ between the template and the overlapping image pattern is calculated for all offsets. The machine coordinates of the estimated sphere center are calculated by
| (2) |
where C⃗est and C⃗VOI are the 3D coordinate of the estimated sphere center and the origin of the VOI, respectively. C⃗′ is the coordinate of the voxel in the VOI at which the highest γ value between the template and the image is obtained. O⃗ is the offset of the center of the sphere in the template from the origin of the template.
3D template matching searches for the highest NCC value with a template in a VOI with a voxel-level increment, and thus the resolution is limited by the voxel size. In order to achieve sub-voxel precision, the VOI was enlarged by a factor of three in all directions and searched by a template with the corresponding voxel size. Interpolation using cubic convolution polynomials was chosen for the enlargement, as a reasonable balance of accuracy of interpolation versus computational load (Keys 1981). The systematic error induced by interpolation using cubic polynomials is less than 0.01 voxel (Schreier et al 2000). In addition to increased resolution, we used another method to attempt to further increase the accuracy. If the center of the sphere can be clearly identified in one new voxel offset location after the enlargement, the position of the new voxel giving the highest NCC value is the matched position. However, if more than one of the new voxel offset locations gives a similar high NCC value, it is plausible that the real peak NCC value may be somewhere among these new voxels. In this case, taking the average position of voxels connected spatially as the matched position is a reasonable choice. A threshold was used to determine how many new voxels were used in the calculation of the average. The threshold had a value that equals to the NCC value calculated with the template shifted by one new voxel from an ideal match. In this case, the threshold was found to be a γ of 0.99. The number of positions that were used to achieve the average value in this study ranged from 1 to 4.
II.C.2. Dual matching templates
The presence of the air bubbles in the upper portion of some of the spheres in the phantom is nearly inevitable due to the large size and the design of the phantom. Such bubbles can lead to a potential erroneous location of the sphere centers. To improve accuracy in the presence of such bubbles, a second template containing the lower half of a sphere was also adopted to facilitate the localization. The whole-sphere template used in this study consisted of a 7 mm × 7 mm × 7 mm cube containing a sphere of 7 mm diameter. The intensity of the voxels in the sphere was 255 and all the other voxels were assigned intensity 0. The half-sphere template was a 7 mm × 7 mm × 4 mm rectangular region containing the lower half sphere filled with intensity of 255 and the intensity of the other voxels set to 0. For each sphere in the image volume, the searching algorithm tried to estimate the sphere center with the whole-sphere template first. The whole-sphere template was used first in the localization. The half-sphere template was selected when the highest NCC value calculated between the VOI and the whole-sphere template was less than the threshold. To verify the half-sphere template is superior in estimating sphere center of spheres with air bubbles and to determine the threshold, both templates were used to search VOIs containing a lower spherical cap of different height (2–6 mm), representing the presence of air bubbles of different size in spheres. In equation (2), for a whole-sphere template, O⃗ = 0.5 × D⃗, where D⃗ is the dimension of the template. For a half-sphere template, the offset along the shortest dimension (anterior-posterior) is zero (no offset), but the offset is still 0.5 × D⃗ in the other two dimensions.
II.C.3. Removal of rigid elements of the distortion map
To remove erroneous distortion mapping that might otherwise arise from the difficulties in aligning the phantom perfectly to the scanner axes, a rigid alignment was performed between the measured and designed coordinates of the sphere centers. In the first step, the average position of all the points was replaced by the origin of the machine coordinates. The rotation between the matrix of coordinates of the designed sphere centers and the matrix of the measured sphere centers was calculated using the orthogonal Procrustes method (Goodall 1991). To reduce the potential of bias from possible distortion (more likely at greater distances from the center of the bore) to the rotation estimation, only the coordinates of the 25 × 13 × 9 (on x, y, z respectively) sphere centers near the machine zero were used in the registration.
II.C.4. Distortion at sphere centers and the characterization of the distortion field
The difference between the designed coordinates after the rotation and the estimated coordinates from the template matching was calculated with the equation
| (3) |
where Δ⃗ is the total displacement between the designed and estimated sphere center. T() is the rigid transform of the designed coordinates C⃗des to the estimated (measured) coordinates C⃗est consisting of the translation and rotational transformation estimated by Procrustes analysis. The three components of Δ⃗ are Δx, Δy, and Δz, representing the displacement of the sphere center in the x, y, z directions. Directions are defined so that x and y are inside the plane that is perpendicular to the longitudinal axis of the magnetic field. Left and posterior are the positive directions along x, and y, respectively. z is along the bore with cranial (i.e. farthest into the bore away from the couch) defined as the positive z direction. The magnitude of deformation is
| (4) |
The displacement of each voxel in the image volume is calculated by cubic interpolation.
II.D. Verification of accuracy of the distortion mapping method using CT images
Since CT images are to first order free of distortion, the accuracy of the distortion mapping method was tested by using the CT images of the small phantom described in section II.A. To test the overall performance of the method, the phantom was aligned to the ceiling laser and the sphere centers in the image volume were estimated and compared to the designed value. To test the accuracy of the Procrustes method, the phantom was aligned with a certain angle to the ceiling laser. The angle estimated by the Procrustes method was compared to the set value.
III. Results
III.A. Testing of the analysis method
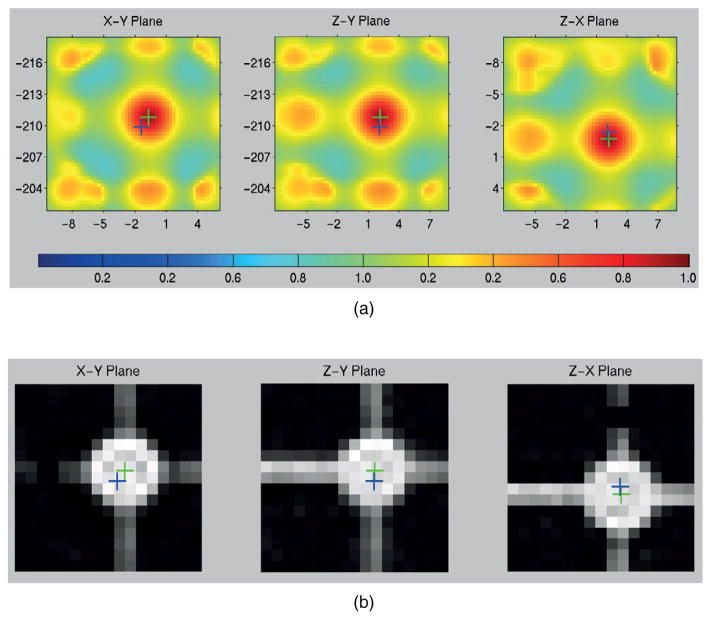
Figure 3 shows an example of the NCC mapping for a single sphere search of a sphere nominally located at (−1.6,−210.0, 1.9) mm from the MRI data. In this example, the maximum value of γ was 0.9815 and was found at offsets of (−0.9, 0.7, 0.1) mm relative to the expected zero offset had distortion not been present. The 2D NCC map through the highest γ value on X-Y, Z-Y, and Z-X planes are shown in figure 3(a). The 2D images of the VOI through the estimated sphere center are shown in figure 3(b). The blue cross represents the designed sphere center and the green cross represents the estimated center.
Figure 3.
NCC map and MR image on three orthogonal planes through estimated sphere center in a VOI. (a) NCC maps and (b) MR images with designed center (blue cross) and estimated center (green cross) shown.
The results of using both templates to match lower spherical cap of different heights are shown in table 1. Half-sphere template is superior to the whole-sphere template in locating the sphere center when the air bubble inside the sphere is large enough to deteriorate the distinguishability of the upper portion of the sphere. When the height of the spherical cap decreases to 4 mm, the center estimated by the whole-sphere template is different from the nominal center by 0.32 mm, which is acceptable, while the center estimated by the half-sphere template has no difference from the nominal center. When the height of the spherical cap decreases to 3 mm, the center estimated by the whole-sphere and half-sphere templates is 1.3 and 0.65 mm different from the nominal value, respectively. It is reasonable to set the threshold value below which the half-sphere template is used to 0.952.
Table 1.
Comparison of estimating center of spherical caps using whole-sphere and half sphere templates.
| Height of spherical cap (mm) | Whole-sphere template
|
Half-sphere template
|
||
|---|---|---|---|---|
| Max γ (no unit) | Difference from nominal center (mm) | Max γ (no unit) | Difference from nominal center (mm) | |
| 2 | 0.7466 | 1.30 | 0.8584 | 0.65 |
| 3 | 0.833 | 1.30 | 0.9584 | 0.65 |
| 4 | 0.8953 | 0.32 | 0.9971 | 0.00 |
| 5 | 0.9517 | 0.32 | 0.9975 | 0.00 |
| 6 | 0.9869 | 0.00 | 0.9975 | 0.00 |
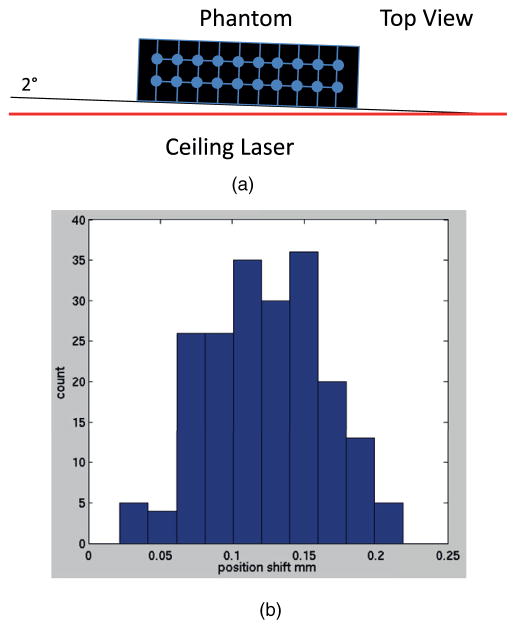
The CT scanning test results are shown in figure 4. The test of rotation measurement (figure 4(a)) via Procrustes analysis yielded a measured rotation of 1.95° and 0.01° when the small phantom was at 2° and 0°, respectively. The histogram of deformation magnitudes (figure 4(b)) shows an average offset of 0.12 mm with a standard deviation of 0.04 mm when the small phantom was set at 2°.
Figure 4.
CT scanning test and the result. (a) Scheme of the test for the verification of the Procrustes analysis. (b) Histogram of the deformation magnitudes.
III.B. Characterization of the MRI distortion map for the VIBE T1 sequence
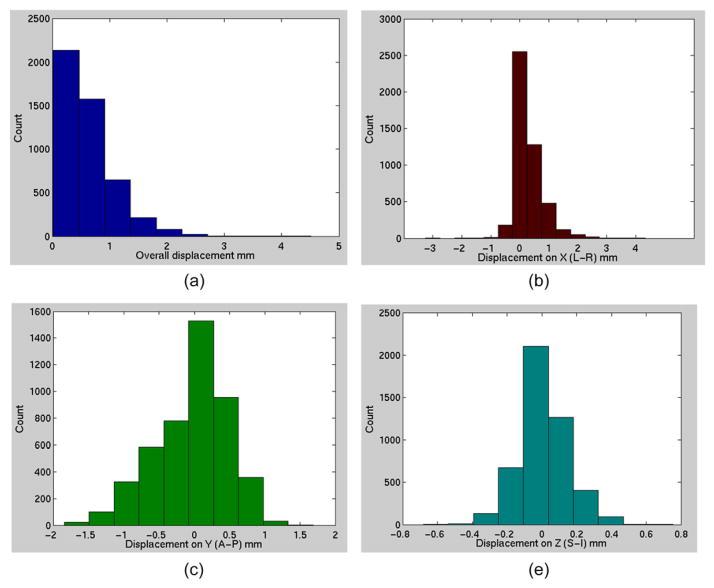
Histograms of the displacement of sphere centers measured from the MRI phantom test are shown in figure 5. Among all the sphere centers, 82.9% have displacements less than 1 mm, 12.2% have 1–1.5 mm displacement, 3.6% have 1.5–2 mm displacement, and 1.4% have displacements of more than 2 mm. The maximum observed displacement was 4.3 mm.
Figure 5.
Histogram of (a) the overall displacement of sphere centers; (b) the displacement on L-R direction; (c) the displacement on A-P direction; (d) the displacement on S-I direction.
The largest displacement appears on the left-right (LR or x) direction (3.5 mm maximum), which is the frequency encoding direction, while the displacements on the anterior-posterior (AP or y) and superior-inferior (SI or z) direction are under 1.5 mm (figures 5(c) and (d)). In the histogram, the region measured along x, and z direction is around 21, and 8 cm from the center of the bore on each side, respectively. Along y direction, since the geometric center of the bore was closer to the posterior region of the phantom, the measured region is around 21, and 11 cm on the anterior, and the posterior side, respectively. The largest displacements along any direction occur when the sphere centers are farthest away from the machine zero (figure 6). For example, the displacement along the x direction (Δx) is less than 2 mm until the sphere center is about 20 cm away from the machine zero (figure 6(a)). The displacements along the y and z directions also show similar trends (figures 6(b) and (c)). The location closest to the (0, 0, 0) coordinate that exhibited >2 mm displacement was at (11.0, −17.8, −4.7) cm.
Figure 6.
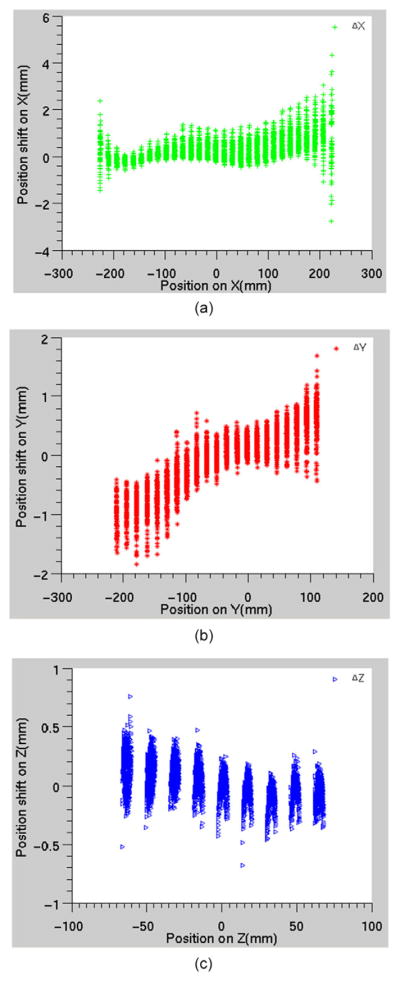
Displacements along (a) x or L-R direction; (b) y or AP direction; (c) z or S-I direction.
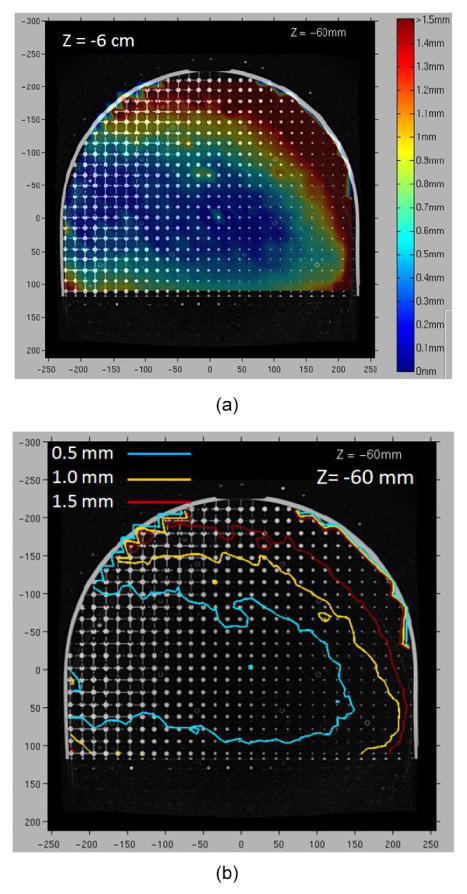
The distortion map and the iso-shift lines on the plane at z = −6 cm (where larger displacements are expected) for the 3D T1-weighted Vibe sequence are shown in figure 7. Larger displacements were seen in the anterior left region. Statistics of displacement of voxels on circles with increasing radii from the center in planes with different positions along the z axis (figure 8) show that at the central plane through the magnet center (z = 0 mm, red line in the plot), the average displacement is less than 1 mm for all radii. At distal planes (z = ±6 cm), when the radius is less than 18 cm, the average displacement is less than 1 mm. However, the average displacement is over 1 mm but still less than 1.5 mm for larger radii. Within this field of view, the distortion is acceptable for potential treatment planning using MR images for the treatment sites such as brain, head and neck, and some body parts of pediatric patients, depending on the additional distortion caused by the scanning subjects.
Figure 7.
Distortion map and the iso-shift lines on the plane at z = −6 cm. (a) Distortion map; (b) Iso-shift lines.
Figure 8.
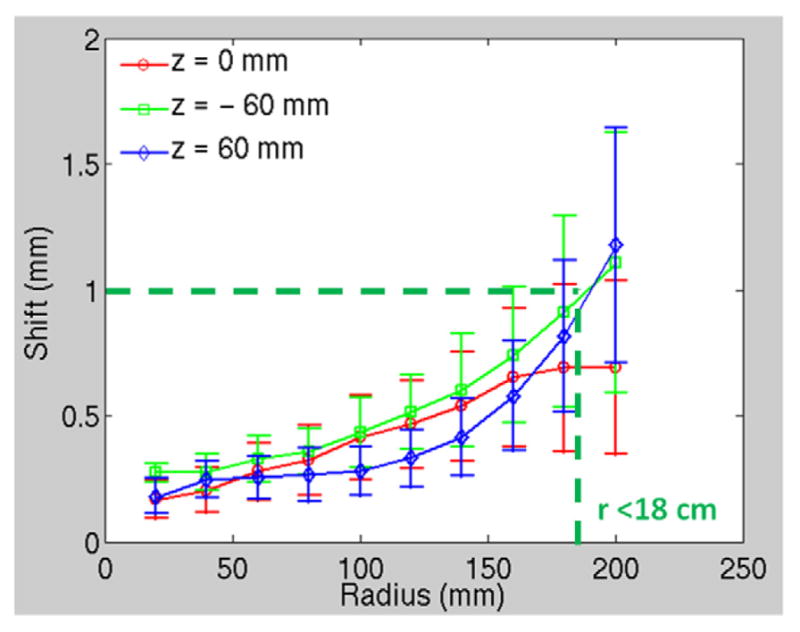
Displacement of sphere centers versus radii from the center in planes at z = 0 and ±6 cm.
IV. Discussion
Phantoms with rods and grids serving as landmarks were previously used by other groups (Walton et al 1996, Mizowaki et al 2000, Tanner et al 2000, Yu et al 2001, Koch et al 2003, Wang and Doddrell 2004, Wang et al 2004a, 2004b, Doran et al 2005, Baldwin et al 2007, Stanescu et al 2010, Dammann et al 2011) for the evaluation of distortion in MR images. In these studies, the three coordinates of the landmarks were determined one by one from three orthogonal directions. Among the studies using phantoms with spheres inside, Breeuwer (2001) used a 2D/3D combined approach, in which the center of a sphere was determined from the center of its cross sectional circle on each slice and interpolation between two slices with the largest circles determining the coordinate of the center between planes. The ADNI phantom is used in measurement of linear and nonlinear spatial distortion, signal-to-noise ratio, and image contrast (Gunter et al 2009). The analysis software uses cross-correlation maps in the initial search for spheres in the phantom, and then the intensity threshold is varied until a cluster is found which overlaps the correlation maximum and contains between 75% and 110% of the expected volume. Finally, the sphere center is found as the intensity weighted average position of voxels in the sphere.
In this study, we developed and built a large 3D phantom for assessing distortion, and used a 3D template matching approach to locate the sphere centers using 3D NCC to measure the similarity between the 3D sphere or half-sphere templates and the image of the sphere in the scanned images of the phantom. This is inherently a real 3D approach. The localization of the sphere centers is performed in the image volume and generating separate coordinates from axial, coronal or sagittal images for the determination of 3D coordinates of landmarks is unnecessary. The coordinates of a sphere center are determined simultaneously once the sphere is matched with the template. Another advantage of this approach is that it does not depend on the image intensity uniformity because using the normalized cross correlation coefficient minimizes effects from the variation of intensities, and thus provides a way to focus on the image pattern itself (the sphere in this study) without the need for intensity thresholds. In this study, the Procrustes method was employed to remove the systematic rotational and translational influence of manual phantom positioning. While theoretically possible real rigid components of the displacement vector field of deformation may be masked by this method, we think that the impact of such rigid transformations on our clinical need (relative localization for Radiation Oncology treatment planning) is negligible and this will be verified in future work.
In this study, the accuracy of machining has been verified using a small phantom with the same design and the same manufacturing technique. However, a CT scan could have been done with an empty phantom as a baseline and a quality check for machining. The actual center of the spheres can be determined using the CT images by applying the same analyzing method. If some spheres are not at the designed position, although not very probable, the value of these expected positions can be modified to that determined in the CT images. In our study, CT scans have been done with MR contrast filled using 140 kVp and different mAs. However, the spheres in the phantom were not very distinguishable in these scans. The images were noisy and it might be caused by several factors. The whole phantom has a large size and it was filled with NiCl2 solution. In addition, the effective atomic number of PMMA is very close to that of water. Further study could be done in the future to determine whether a clear CT scan can be obtained with the solution filled.
The method presented in this study can be used on other distortion phantoms. Procrustes method can be used to reduce the tolerance and setup time for phantom alignment and template matching using a 3D NCC coefficient can be used for phantoms that contain 3D patterns with a distinguishable center. This method determines the coordinates of the control points simultaneously in three directions.
V. Conclusion
A 3D MRI distortion phantom has been assembled and analysis software developed to characterize distortions in MRI scans. The analysis method is automated, and shows sub-mm accuracy in tests on CT scans. For MRI scans, the use of two templates helps reduce the potential impact of residual air bubbles in some of the spheres. Initial tests on an open wide bore MRI scanner used in Radiation Oncology show 3D displacements of less than 1 mm after vendor supplied distortion correction over distances of up to 15 cm from the magnet center, for the 3D T1-weighted VIBE sequence, as shown in figure 8. Future studies will further characterize the optimal use of various templates to manage the residual air found in some spheres, and will characterize displacements fields closer to the edge of the bore, as well as for a variety of scan techniques.
Acknowledgments
The authors would like to thank J French for performing the phantom scans for this project. This work was sponsored in part by NIH R01 EB016079.
References
- Alexander E, III, Kooy HM, van Herk M, Schwartz M, Barnes PD, Tarbell N, Mulkern RV, Holupka EJ, Loeffler JS. Magnetic resonance image-directed stereotactic neurosurgery: use of image fusion with computerized tomography to enhance spatial accuracy. J Neurosurg. 1995;83:271–6. doi: 10.3171/jns.1995.83.2.0271. [DOI] [PubMed] [Google Scholar]
- Baldwin LN, Wachowicz K, Thomas SD, Rivest R, Fallone BG. Characterization, prediction, and correction of geometric distortion in 3T MR images. Med Phys. 2007;34:388. doi: 10.1118/1.2402331. [DOI] [PubMed] [Google Scholar]
- Bednarz G, Downes MB, Corn BW, Curran WJ, Goldman HW. Evaluation of the spatial accuracy of magnetic resonance imaging-based stereotactic target localization for gamma knife radiosurgery of functional disorders. Neurosurgery. 1999;45:1156. doi: 10.1097/00006123-199911000-00028. [DOI] [PubMed] [Google Scholar]
- Breeuwer MM, Holden M, Zylka W. Detection and correction of geometric distortion in 3D MR images. Medical Imaging. 2001:1110–20. [Google Scholar]
- Briechle K, Hanebeck UD. Template matching using fast normalized cross correlation. Aerospace/Defense Sensing, Simulation, and Controls. 2001:95–102. [Google Scholar]
- Brown LG. A survey of image registration techniques. ACM Comput Surv. 1992;24:325–76. [Google Scholar]
- Dammann P, Kraff O, Wrede KH, Özkan N, Orzada S, Mueller OM, Sandalcioglu IE, Sure U, Gizewski ER, Ladd ME. Evaluation of hardware-related geometrical distortion in structural MRI at 7 Tesla for image-guided applications in neurosurgery. Acad Radiol. 2011;18:910–6. doi: 10.1016/j.acra.2011.02.011. [DOI] [PubMed] [Google Scholar]
- Doran SJ, Charles-Edwards L, Reinsberg SA, Leach MO. A complete distortion correction for MR images: I. Gradient warp correction. Phys Med Biol. 2005;50:1343. doi: 10.1088/0031-9155/50/7/001. [DOI] [PubMed] [Google Scholar]
- Fraass BA, McShan DL, Diaz RF, Ten Haken RK, Aisen A, Gebarski S, Glazer G, Lichter AS. Integration of magnetic resonance imaging into radiation therapy treatment planning: I. Technical considerations. Int J Radiat Oncol Biol Phys. 1987;13:1897–908. doi: 10.1016/0360-3016(87)90358-0. [DOI] [PubMed] [Google Scholar]
- Goodall C. Procrustes methods in the statistical analysis of shape. J R Stat Soc Ser B. 1991;53:285–339. [Google Scholar]
- Gunter JL, Bernstein MA, Borowski BJ, Ward CP, Britson PJ, Felmlee JP, Schuff N, Weiner M, Jack CR. Measurement of MRI scanner performance with the ADNI phantom. Med Phys. 2009;36:2193. doi: 10.1118/1.3116776. [DOI] [PMC free article] [PubMed] [Google Scholar]
- Jovicich J, Czanner S, Greve D, Haley E, van der Kouwe A, Gollub R, Kennedy D, Schmitt F, Brown G, MacFall J. Reliability in multi-site structural MRI studies: effects of gradient non-linearity correction on phantom and human data. Neuroimage. 2006;30:436–43. doi: 10.1016/j.neuroimage.2005.09.046. [DOI] [PubMed] [Google Scholar]
- Karger CP, Höss A, Bendl R, Canda V, Schad L. Accuracy of device-specific 2D and 3D image distortion correction algorithms for magnetic resonance imaging of the head provided by a manufacturer. Phys Med Biol. 2006;51:N253. doi: 10.1088/0031-9155/51/12/N04. [DOI] [PubMed] [Google Scholar]
- Keys R. Cubic convolution interpolation for digital image processing. IEEE Trans Acoust Speech Signal Process. 1981;29:1153–60. [Google Scholar]
- Koch N, Liu H, Olsson L, Jackson E. Assessment of geometrical accuracy of magnetic resonance images for radiation therapy of lung cancers. J Appl Clin Med Phys. 2003;4:352–64. doi: 10.1120/jacmp.v4i4.2510. [DOI] [PMC free article] [PubMed] [Google Scholar]
- Lewis J. Fast template matching. Vision Interface. 1995;95:120123. [Google Scholar]
- Li Y, Xu N, Fitzpatrick JM, Dawant BM. Geometric distortion correction for echo planar images using nonrigid registration with spatially varying scale. Magn Reson Imaging. 2008;26:1388–97. doi: 10.1016/j.mri.2008.03.004. [DOI] [PMC free article] [PubMed] [Google Scholar]
- Lide DR. CRC Handbook Chemistry and Physics. Vol. 86. Boca Raton, FL: CRC; 2000. Magnetic susceptibility of the elements and inorganic compounds; pp. 130–135. [Google Scholar]
- Mizowaki T, Nagata Y, Okajima K, Kokubo M, Negoro Y, Araki N, Hiraoka M. Reproducibility of geometric distortion in magnetic resonance imaging based on phantom studies. Radiother Oncol. 2000;57:237–42. doi: 10.1016/s0167-8140(00)00234-6. [DOI] [PubMed] [Google Scholar]
- Schmitz BL, Aschoff AJ, Hoffmann MHK, Grön G. Advantages and pitfalls in 3T MR brain imaging: a pictorial review. Am J Neuroradiol. 2005;26:2229–37. [PMC free article] [PubMed] [Google Scholar]
- Schreier HW, Braasch JR, Sutton MA. Systematic errors in digital image correlation caused by intensity interpolation. Opt Eng. 2000;39:2915–21. [Google Scholar]
- Stanescu T, Jans HS, Wachowicz K, Fallone BG. Investigation of a 3D system distortion correction method for MR images. J Appl Clin Med Phys. 2010;11:2961. doi: 10.1120/jacmp.v11i1.2961. [DOI] [PMC free article] [PubMed] [Google Scholar]
- Sumanaweera T, Glover G, Song S, Adler J, Napel S. Quantifying MRI geometric distortion in tissue. Magn Res Med. 1994;31:40–7. doi: 10.1002/mrm.1910310106. [DOI] [PubMed] [Google Scholar]
- Tanner S, Finnigan D, Khoo V, Mayles P, Dearnaley D, Leach M. Radiotherapy planning of the pelvis using distortion corrected MR images: the removal of system distortions. Phys Med Biol. 2000;45:2117. doi: 10.1088/0031-9155/45/8/305. [DOI] [PubMed] [Google Scholar]
- Walker A, Liney G, Holloway L, Dowling J, Rivest-Henault D, Metcalfe P. Continuous table acquisition MRI for radiotherapy treatment planning: distortion assessment with a new extended 3D volumetric phantom. Med Phys. 2015;42:1982–91. doi: 10.1118/1.4915920. [DOI] [PubMed] [Google Scholar]
- Walton L, Hampshire A, Forster D, Kemeny AA. A phantom study to assess the accuracy of stereotactic localization, using T1-weighted magnetic resonance imaging with the Leksell stereotactic system. Neurosurgery. 1996;38:170. doi: 10.1097/00006123-199601000-00038. [DOI] [PubMed] [Google Scholar]
- Wapler MC, Leupold J, Dragonu I, von Elverfeld D, Zaitsev M, Wallrabe U. Magnetic properties of materials for MR engineering, micro-MR and beyond. J Magn Reson. 2014;242:233–42. doi: 10.1016/j.jmr.2014.02.005. [DOI] [PubMed] [Google Scholar]
- Wang D, Strugnell W, Cowin G, Doddrell DM, Slaughter R. Geometric distortion in clinical MRI systems: part I: evaluation using a 3D phantom. Magn Reson Imaging. 2004a;22:1211–21. doi: 10.1016/j.mri.2004.08.012. [DOI] [PubMed] [Google Scholar]
- Wang D, Doddrell DM. A proposed scheme for comprehensive characterization of the measured geometric distortion in magnetic resonance imaging using a three-dimensional phantom. Med Phys. 2004;31:2212. doi: 10.1118/1.1767051. [DOI] [PubMed] [Google Scholar]
- Wang D, Doddrell DM, Cowin G. A novel phantom and method for comprehensive 3-dimensional measurement and correction of geometric distortion in magnetic resonance imaging. Magn Reson Imaging. 2004b;22:529–42. doi: 10.1016/j.mri.2004.01.008. [DOI] [PubMed] [Google Scholar]
- Yu C, Petrovich Z, Apuzzo MLJ. An image fusion study of the geometric accuracy of magnetic resonance imaging with the Leksell stereotactic localization system. J Appl Clin Med Phys. 2001;2:42–50. doi: 10.1120/jacmp.v2i1.2627. [DOI] [PMC free article] [PubMed] [Google Scholar]


