
FIGURE 3.
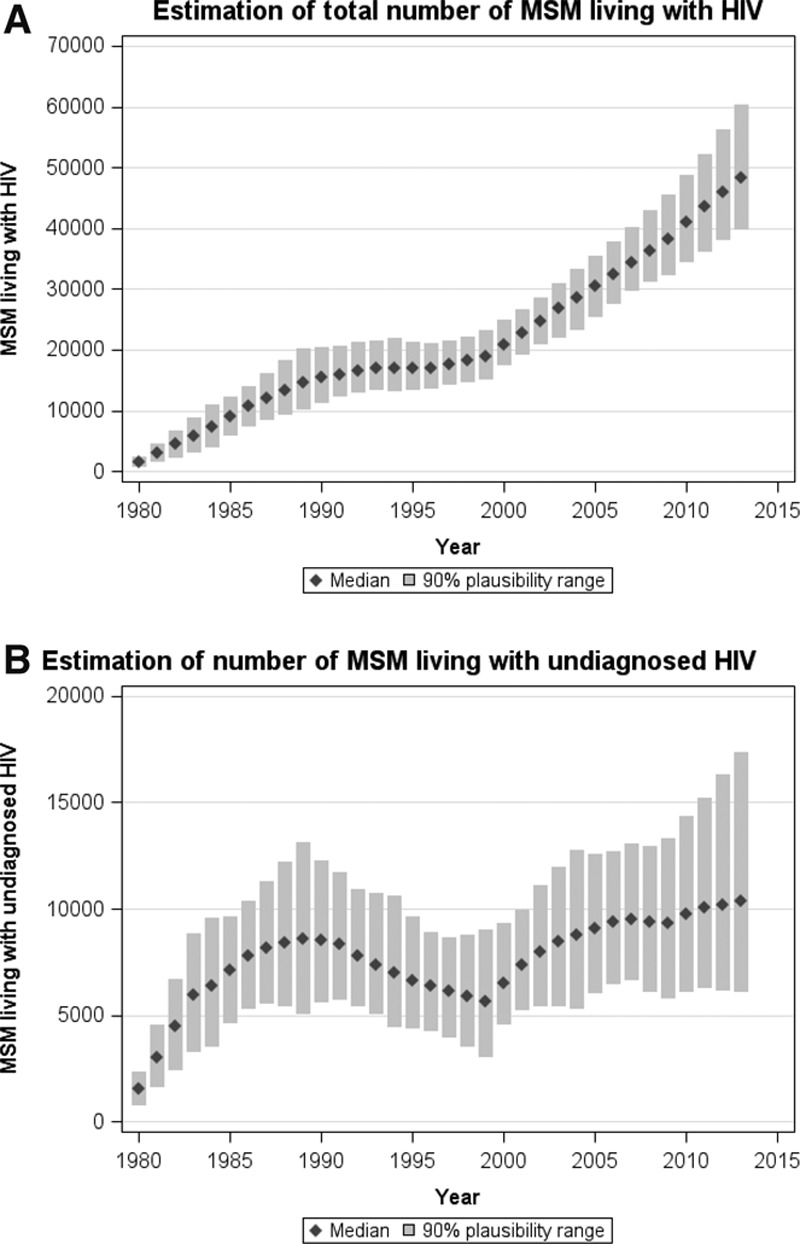
Estimates of the (A) total number of MSM living with HIV in the UK and (B) total number of MSM living with undiagnosed HIV, by calendar year. Columns and error bars: Modeled median and 90% plausibility range.
Official websites use .gov
A
.gov website belongs to an official
government organization in the United States.
Secure .gov websites use HTTPS
A lock (
) or https:// means you've safely
connected to the .gov website. Share sensitive
information only on official, secure websites.
Estimates of the (A) total number of MSM living with HIV in the UK and (B) total number of MSM living with undiagnosed HIV, by calendar year. Columns and error bars: Modeled median and 90% plausibility range.