
Figure 10.
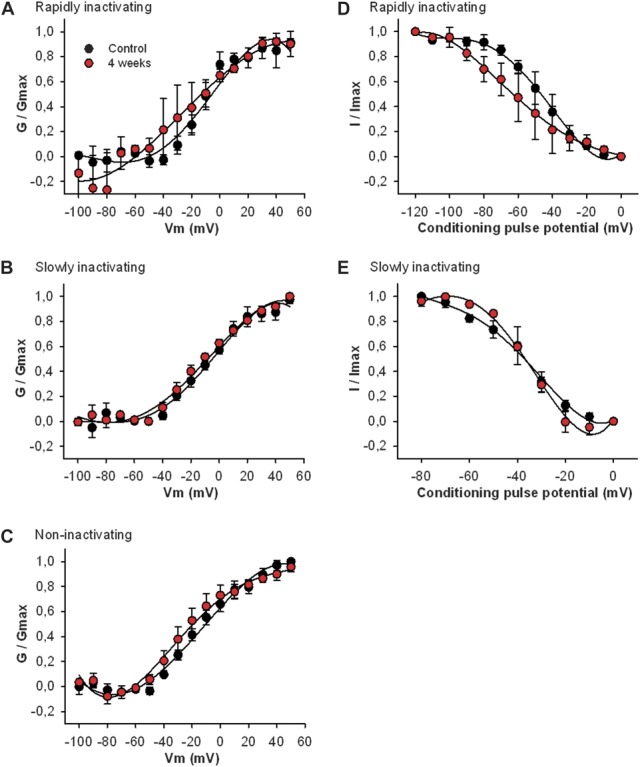
Activation and inactivation curves of voltage-gated K+ currents in corneal cold sensory neurons from control and 4-week tear-deficient guinea pigs. Activation curves were generated by voltage pulses in 10-mV steps from −100 to +50 mV. Activation voltage dependency was studied by plotting normalized conductance (G/Gmax) against test pulse voltage, and the data were fitted using a Boltzmann function. (A) Activation curves for rapidly inactivating K+ current in cold sensory neurons from control and tear-deficient animals (n = 5 neurons in each group). V0.5: control −12.5 ± 2.0 mV; tear-deficient −14.5 ± 7.6 mV. Slope factor: control 7.9 ± 1.7; tear-deficient 15.9 ± 6.0. No significant differences were observed. (B) Activation curves for slowly inactivating K+ current (n = 5 neurons each) V0.5: control −8.6 ± 2.4 mV; tear-deficient −10.6 ± 2.1 mV. Slope factor: control 15.1 ± 2.2; tear-deficient 17.2 ± 2.0. (C) Activation curves for noninactivating K+ current (n = 5 neurons in each group), V0.5: control −12.7 ± 1.5 mV; tear-deficient −20.1 ± 2.5 mV. Slope factor: control 16.8 ± 1.5; tear-deficient 20.2 ± 2.5. (D) Inactivation curves for rapidly inactivating K+ current. Inactivation curves were constructed using a 2-pulse protocol, a 1-second prepulse varying between −120 and 0 mV, followed by a 400-millisecond test pulse of +50 mV. The peak of the transient component was measured. Tear-deficient neurons showed a significant leftward shift in the inactivation curve of KA,fast (P < 0.05, 1-way repeated-measures analysis of variance). V0.5: control −45.9 ± 2.5 mV, tear-deficient −64.2 ± 7.7 mV. Slope factor: control −12.3 ± 2.2, tear-deficient −20.5 ± 9.0. (E) Inactivation curves for slowly inactivating KA,slow were constructed using a 2-pulse protocol: an 8-second prepulse varying between −80 and 0 mV followed by a 1-second test pulse of +50 mV. No significant effects were observed between groups.