

Abstract
Lectin microarray technology has been used to profile the glycosylation of a multitude of biological and clinical samples, leading to new clinical biomarkers and advances in glycobiology. Lectin microarrays, which include over 90 plant lectins, recombinant lectins, and selected antibodies, are used to profile N-linked, O-linked, and glycolipid glycans. The specificity and depth of glycan profiling depends upon the carbohydrate-binding proteins arrayed. Our current set targets mammalian carbohydrates including fucose, high mannose, branched and complex N-linked, α- and β- Galactose and GalNAc, α-2,3- and α-2,6- sialic acid, LacNAc and Lewis X epitopes. In previous protocols, we have described the use of a contact microarray printer for lectin microarray manufacture. Herein, we present an updated protocol using a non-contact, piezoelectric printer, which leads to increased lectin activity on the array. We describe optimization of print conditions and sample hybridization, and methods of analysis.
Keywords: carbohydrate analysis, glycomics, lectin microarray, Nano-Plotter, piezoelectric
INTRODUCTION
This article describes an updated protocol for lectin microarrays, a useful tool for the rapid analysis of glycosylation (glycomics). Glycomics is an emerging field in the post-genome/proteome era that focuses on glycan structural identification and elucidation of glycan function in relevant biological processes such as differentiation, embryogenesis, immunity, infection and metastasis (Hirabayashi, 2008). All living organisms are comprised of cells, which are covered with diverse forms of glycoconjugates, complex carbohydrate biopolymers (glycans) attached to lipids, proteins or glycophosphatidylinositol (GPI) anchors. Glycans are often structural isomers and are not blueprinted in the genome by a known code, unlike proteins and RNA. This complicates glycan analysis. Lectin microarray technology addresses the challenge of glycan analysis by harnessing lectins, natural carbohydrate-binding proteins, to decipher glycan structure.
In lectin microarrays, lectins are addressed to specific locations on a glass slide or other solid support, enabling rapid fingerprinting of glycosylation patterns of fluorescently labeled samples (Kuno et al., 2005 , Pilobello et al., 2005, Pilobello and Mahal, 2007) (Figure 1a). Unlike other methods for glycomic analysis such as HPLC or mass spectrometry, the lectin microarray can be used for the direct application of mixed or crude samples, including clinical samples such as sera and tissue extracts, without pre-fractionation or separation of the glycan types. Since its introduction in 2005, (Pilobello et al., 2005) this analytical technology has been used for the glycomic analysis of various biological samples including glycoproteins (Pilobello and Mahal 2007.), bacteria (Hsu et al., 2006), mammalian cell-surfaces (Hsu et al., 2011), viruses (Krishnamoorthy et al., 2009) and clinical samples (Fry et al., 2011, Bird-Lieberman et al., 2012).
Figure 1.


a) Schematic of lectin microarray experimental procedure: mammalian cell lysis and hybridization of labeled micelles. Labeled glycoproteins, viral particles, or bacteria can also be hybridized. b) Interpretation of lectin microarray data using lectin specificity annotations.
Our previous work focused on protocols for contact printing of lectin microarrays; however we have recently updated our methodology to use non-contact piezoelectric print techniques. This change resulted in superior activity for the majority of lectins on our array, but has necessitated changes in our print protocol. Herein we describe an updated protocol for lectin microarray analysis, including protocols for lectin micorarray printing on a piezoelectric platform (GeSiM Nano-Plotter), sample labeling, hybridization and data analysis.
STRATEGIC PLANNING
Lectin considerations
Simultaneous recognition of a wide range of glycans is achieved using the lectin microarray technology by printing lectins with known specificities to a known location. The range of glycans observed is dependent on the probes (Figure 1b). Continual expansion of the panel with commercially available lectins, glycan-binding antibodies and new carbohydrate binders such as recombinant bacterial lectins increases the profiling capacity of this technology. On our current lectin microarrays the number of probes reaches upwards of ~90 distinct lectins, recombinant lectins and antibodies (Table 1). Inclusion of recombinant lectins addresses the limitations imposed by naturally purified plant lectins, which include lot-to-lot-dependent inconsistencies in activity and availability, as well as post-translational glycosylation of the lectins, which can complicate analysis when lectins are present in the sample to be analyzed. Our arrays are biased towards analysis of the mammalian glycome and our choice of probes reflects that bias. Many of the bacteria and microbes targeting mammalian systems harness mammalian epitopes and some glycan epitopes are shared across all of the biological kingdoms, thus this array can be used for analysis of non-mammalian systems (Hsu and Mahal, 2006). However, if analyzing a non-mammalian system, thought should be given to the inclusion of additional carbohydrate-binding probes (Shirai et al., 2009, Yasuda et al., 2011).
Table 1.
Panel of lectins included in our lectin microarray organized by carbohydrate specificity.
| Lectin source | Abbreviation | Print conc. µg/ml |
Inhibitory monosaccharide |
Rough specificity |
|---|---|---|---|---|
| Anguilla anguilla | AAA | 1000 | Fuc | α-Fuc |
| Aleuria aurantia | AAL | 500 | Fuc | Fuc |
| Aspergillus oryzae | AOL | 500 | Fuc | Fuc α-1,6 GlcNAc (core Fuc) |
| Ulex europaaeus I | UEA-I | 500 | Fuc | α-Fucose |
| Psophocarpus tetragonolobus | PTL-II | 1000 | Gal | α-1,2 Fucosylated LacNAc, β-GalNAc |
| Trichosanthes japonica | TJA-II | 500 | Lac | Fuc α-1,2 Gal β-1,4 or GalNAc β-1,4 groups at their non-reducing terminals |
| Pisum sativum | PSL | 500 | Man | Man, (Fuc α-1,6 GlcNAc, α-D-Glc, α-D-Man_Hirabayashi) |
| Cancer antennarius | CCA | 500 | Lac | 9-O-Acetyl Sia and 4-O-Acetyl Sia |
| Limax flavus | LFA | 500 | Lac | α-Sia (O-glycans) |
| Limulus polphemus | LPA | 500 | Lac | α-Sia |
| Maackia amurensis | MAA | 500 | Lac | α-2,3 Sialic acid |
| Maackia amurensis-I | MAL- I | 1000 | Lac | galactosyl (β-1,4) N-acetylglucosamine, sialic acid |
| Maackia amurensis-II | MAL-II | 500 | Lac | (α-2,3) sialic acid-LacNAc structure |
| Trichosanthes japonica | TJA-I | 1000 | Lac | Sia α-2,6 Gal/GalNAc |
| Trichosanthes kirilowii | TKA | 500 | Gal | β-Gal, LacNAc but Sia α-2,3 or 2,6 inhibits best |
| Phaseolus vulgaris Leucoagglutinin | PHA-L | 500 | Gal | β-1,6 Branched trimannosyl core N-linked glycans |
| Erythrina cristagalli | ECA | 500 | Gal | Gal β-1,4 GlcNAc |
| Ricin B chain | RCA | 1000 | Lac | β-Gal/GalNAc |
| Phaseolus vulgaris Erythroagglutinin | PHA-E | 500 | Lac | Complex-type N-glycans with outer Gal and bisecting GlcNAc |
| Colchicum autumnale | CA | 500 | Gal | Terminal Gal β-OR |
| Bauhinia purpurea | BPA | 500 | Gal | Primarily Gal β-1,3 or 1,4 but will also bind β-GalNAc more weakly |
| Agaricus bisporus | ABA | 500 | Gal | O-linked Gal β-1,3 GalNAc |
| Abrus precatorius | APA | 500 | Gal | Gal β-1,3GalNAc (TF antigen) > Gal |
| Griffonia simplicifoia | GS-I | 500 | Gal | α-Galactose, also bids some GalNAc |
| Aegopodium podagraria | APP | 500 | GalNAc | GalNAC>Lacose>Galactose |
| Bryonia dioica | BDA | 500 | Gal | GalNAc |
| Black bean | Blackbean | 1000 | Lac | GalNAc |
| Caragana arborescens | CAA | 500 | Gal | GalNAc/Gal (monosaccharides best) |
| Cystisus scoparius | CSA | 500 | Gal | β-GalNAc, terminal |
| Iris Hybrid | IRA | 1000 | Gal | GalNAc(GalNAc α-1,3 Gal>GalNAc>Gal |
| Vicia villosa | VVA | 500 | Gal | α-Linked terminal GalNAc, GalNAc α-1,3 Gal |
| Wisteria floribunda | WFA | 500 | Gal | GalNAc |
| Allium sativum | ASA | 1000 | Man | Mannose |
| Allium moly | AMA | 1000 | Man | d-mannose |
| Calystegia Sepium | Calsepa | 500 | Man | Man/maltose |
| Canavalia ensiformis | Con A | 500 | Man | Branched and terminal mannose [High-Man, Manα-1,6 (Manα-1,3) Man] |
| Cyanovirin | CVN | 1000 | Man | α-1,2 Mannose |
| Galanthus nivalis | GNA | 1000 | Man | Terminal α-1,3 mannose |
| Griffithsin | GRFT | 1,000 | GlcNAc | Mannose, GlcNAc |
| Hippeastrum Hybrid | HHL | 500 | Man | α-1,3 Mannose and α-1,6 mannose |
| Narcissus pseudonarcissus | NPA | 1000 | Man | Terminal and internal Man |
| Scytovirin | SVN | 500 | Man | α-1,2 Mannose |
| Uritica dioica | UDA | 1000 | GlcNAc | GlcNAc β-1,4 GlcNAc oligomers and high mannose epitopes |
| Vicia villosa | VVA (mann) | 500 | Gal | Man |
| Vicia faba | VFA | 500 | Gal | Man>Glc>GlcNAC |
| Tulipa sp. | TL | 1000 | GlcNAc | Man3 core, bi- and tri-antennary complex-type N-glycan, GalNAc |
| Lens culinaris | LCA | 500 | Man | Complex (man/GlcNAc core with α-1,6 Fuc) |
| Artocarpus integrifolia | AIA | 500 | Gal | O-glycosidically linked oligosaccharides, preferring the structure galactosyl (β-1,3) N-acetylgalactosamine |
| Eunonymus europaeus | EEL | 500 | Lac | Blood group B antigen, Gal α-1,3 Gal |
| Maclura pomifera | MPA | 500 | Gal | Gal β-1,3 GalNAc, GalNAc |
| Arachis hyogaea | PNA | 500 | Gal | Terminal Gal β-OR |
| Vicia graminea | VGA | 500 | Gal | O-linked Gal β-1,3 GalNAc |
| Vigna radiata | VRA | 500 | Gal | α-Galactose |
| Amaranthus Caudatus | ACL | 500 | Lac | Gal β-1,3 GalNAc (the T antigen) |
| Dolichos biflorus | DBA | 500 | Gal | GalNAc α-OR (GalNAcα-1,3 GalNAc) and Blood group A antigen, |
| Glycine max | SBA | 500 | Gal | α- or β-Linked terminal GalNAc, GalNAc α-1,3 Gal |
| Sophora japonica | SJA | 500 | Gal | GalNAc |
| Homarus Americanus | HAA | 1000 | Gal | Terminal GalNAc |
| Helix pomatia | HPA | 500 | Gal | α -Linked terminal GalNAc |
| Sambucus nigra | SNA-II | 500 | Gal | GalNAc linked alpha to C-2, C-3 or C-6 hydroxyl gropup of galactose |
| Psophocarpus tetragonolobus | PTL-I | 1000 | Gal | α-GalNAc, A-antigen |
| Phaseolus lunatus | LBA | 1000 | Gal | GalNAc α-1,3 [Fuc α-1,2]Gal |
| Datura stramonium | DSA | 500 | Lac | GlcNAc β-1,4 GlcNAc oligomers and LacNAc (Gal β 1–4 GlcNAc) |
| Griffonia simplicifoia | GS-II | 500 | GlcNAc | terminal GlcNAc |
| Ulex europaaeus II | UEA-II | 1000 | GlcNAc | Oligomers of β-1,4 GlcNAc |
| Persea americana | PAA | 500 | GlcNAc | Unknown |
| Cicer arietinum | CPA | 1000 | Lac | Complex |
| Robinia pseudoacacia | RPA | 500 | GlcNAc | Complex |
| Lycopersicon esculentum | LEA | 500 | GlcNAc | β-1,4GlcNAc oligomers |
| Phytolacca americana | PWM | 500 | Lac | (GlcNAc α-1,4)n |
| Solanus tuberosum | STA | 500 | GlcNAc | GlcNAc oligomers, LacNAc |
| Triticum vulgare | WGA | 500 | GlcNAc | β-GlcNAc, sialic acid, GalNAc |
| Cholera Toxin from Vibrio cholerae | Cholera Toxin | 2000 | Lac | glycolipid |
| Marasmium oreades | MOA | 500 | Gal | Gal α-1,3 Gal and Gal α-1,3 Gal β-1,4GlcNAc |
| Morniga sp. | MNA-G | 1000 | Gal | GalNAc α, Tn antigen |
| Lotus tetragonolobus | Lotus (LTL) | 500 | Fuc | Terminal α-Fuc, Lewis x |
| Iberis amara | IAA | 500 | GalNAc | GalNAc |
| Bacteria | GafD | 500 | GlcNAc | GlcNAc |
| Bacteria | PA-IL | 500 | Gal | GalNAc |
| Bacteria | RS-IIL | 500 | Man | Mannose |
| antibody | 7-LE Ab | 500 | Lac | Blood Group, Lewis A |
| antibody | 2–25 Ab | 500 | Lac | Blood Group, Lewis B |
| antibody | STn 219 | .0025 | Lac | Sialyl Tn |
Advantages of non-contact printing
In contrast to genomics based microarrays where the most widely used platform is produced by an in situ synthesis technique (Hardiman, 2009), protein arrays are typically manufactured using either a contact or non-contact printing process that transfers samples from microwell plates to a solid support, typically a derivatized glass slide. Contact printing utilizes pin-type arrayers that transfer a defined volume of sample by directly touching the surface of the slide. Contact printers are usually simpler in design, less expensive, and faster than non-contact printers. They may be the arrayer of choice when large numbers of samples are to be spotted; however protein activity can be lowered by this physical deposition method (Walther et al., 2007). Non-contact printers can be syringe-based (solenoid) or piezo type. With these technologies, sample droplets are dispensed onto the slide, avoiding contact of the printer pins with the surface. Sample volumes can be varied in steps by firing multiple times on the same spot. This technique enables very high reproducibility. Examples of non-contact systems used for protein arraying include the Biochip Arrayer (Perkin-Elmer), GeSiM Nano-Plotter, and Scienion sciFLEXARRAYER (Scienion AG) (Walther et al., 2007). For our experimental setup we chose the GeSiM Nano-Plotter. To assure high quality printing, it is advantageous to establish systems that check for fabrication errors that can be used to repair “miss-prints”. The GeSiM (GeSiM GmbH,) Nano-Plotter piezoelectric non-contact dispensing platform has features that can be implemented to provide quality control, during and after array fabrication. This piezoelectric technology allows different spot sizes by varying the number of drops per spot without changing the tip itself. Non-contact arraying technology allows for highly consistent spots showing little or no “donut” effect. Additional benefits to non-contact printing include that print patterns are not restricted by the physical pin arrangement facilitating the design of the print.
Experimental design: single versus dual color analysis
Typically, we hybridize samples for both single and dual color analysis. Data from the single color experiments can be used to confirm the dual color signals. In dual color experiment, the sample is co-hybridized with a reference labeled with an orthogonal dye. The choice of reference will depend on the experiment. Typically, the reference consists of either a mixture of samples across the experimental set, for example a mixture of all samples studied, or a single sample that we wish to compare all other samples to, for example a parental cell line when studying mutants. Dual color hybridization, and subsequent ratiometric analysis, not only minimizes the effects of variable spot morphology, which can influence the median value of a spot and contribute to deviation between replicate spots, but also allow more subtle differences to be observed through competitive binding, which might not be obvious in single color. Dual color hybridization designs can vary and may be adjusted depending on the number of arrays available. We have used both a dye swap design, in which every sample is labeled in both colors and co-hybridized with reference labeled in the opposite color, and a direct comparison of samples in one color against a common reference hybridized in the opposite color. In the later case, the data is median centered after data extraction, which assumes a normal distribution. A common method to evaluate distributions is the Q-Q plot which can be performed in various statistical programs including SPSS and R.
BASIC PROTOCOL 1: LECTIN MICROARRAY PRINT PREPARATION AND GENERAL PRINTING PROTOCOL USING NON-CONTACT PRINTER (NANO-PLOTTER)
This protocol describes lectin microarray printing with a piezoelectric printer. All conditions herein are optimized for a NanoPlotter (GeSIM). The optimization of print conditions for the lectins, including print buffer, lectin concentrations and environmental conditions for the NanoPlotter are discussed in the Critical Parameters section in the Commentary below.
NOTE: All lectins were purchased from either EY Laboratories (San Mateo, CA) or Vector Laboratories (Burlingame, CA) with the following exceptions: TJA-I and TJA-II were purchased from NorthStar Bioproducts**, cyanovirin (CVN), scytovirin (SVN) and griffithsin (GRFT) were gifts from Dr. B. O’Keefe (NCI Frederick); and Gaf-D, PA-IL, and RS-IIL were made recombinantly as previously described (Hsu et al., 2008). See Table 1 for a typical print list. We usually aliquot lectins into 10 µL portions at 1 mg/mL and store them at −80°C. Aliquots are discarded after thawing. In general, we have found that the lectins are active for 1–2 years when stored under these conditions. We routinely monitor lectin activity, via our glycoprotein standards, on each microarray print (See basic protocol 2).
** NorthStar Bioproducts is no longer selling lectins.
Materials
Monosaccharides: α-D-Lactose monohydrate, 99.5+ %, D-(+)-Mannose, 99+ % , D-(+)- galactose, 99+ % , l-(–)-Fucose, 97%, N acetyl-glucosamine (Acros Organics)
PBS-Tween (PBS-T; 0.1 M NaH2PO4 , 0.15 M NaCl, 0.01 % Tween-20, pH 7.2)
Nexterion H slides (SCHOTT, Elmsford, NY) Slides should be stored at −20°C in a vacuum tight packet and are typically good for ~ one year.
Equipment
Nano-Plotter 2.1 piezoelectric printer (GeSiM, Germany) with cooled microwell plate holder and cooled printing deck (Figure 2)
Figure 2.

Schematic of the Nano-Plotter deck and printhead. Chassis and external components are not included in the image. Printhead with single tip inserted is shown. Plotter deck is designed to hold 55 slides (Nano-Plotter 2.1). The plotter is contained within a glass chamber and comes with a humidifier that can adjust the humidity to 80% (not shown). The system can be modified with a dehumidifier to better control the humidity levels (not shown). Both the plotter deck and the microwell plate holder can be cooled to 10 °C. The system comes with both a stroboscope to align droplets, and an integrated camera system that can be used for target alignment.
Print preparation
Remove Nexterion H slides from –20 °C and thaw to room temperature (20 – 25 °C). The slides must be allowed to thaw to room temperature to avoid condensation on the slide surface, which can result in loss of activity. The unused slides can be stored in a vacuum-sealed bag at –20 °C.
-
Dilute lectins to the recommended or predetermined concentrations in the appropriate print buffer (final concentration of print buffer 0.01 % Tween-20, 1 mM monosaccharide in PBS; Table 1). Load 20 µl of the lectin mix in the 384-well plate in the desired order.
The addition of a complementary monosaccharide helps to prevent aggregation during the print process. We have found it best to make a fresh plate for each print. Reuse of plates is not advised as most lectins lose activity when stored in the fridge (see Critical Parameters for more on this subject).
Centrifuge the plate at 150 x g for 5 min and store at 4 °C. The prepared microplate can be stored at 4°C for up to 12 hours, however for best results we suggest using the plate immediately.
Determine the number of slides to print. Take out the slides from deep freezer and keep at room temperature for 30 minutes prior to printing.
Set-up of Nano-Plotter: Check the humidity of the print chamber. Ideally, the humidity should be kept around 45–50 % during the entire print process. A humidity control device may be used to maintain the appropriate relative humidity (see Strategic Planning section).
-
Turn on the chiller and set the temperature to ~10 °C. This is important to help maintain lectin activity during extended and overnight print runs. Once the temperature and humidity reach the desired parameters, start the print setup (See troubleshooting point 1).
The temperature of the cooled slide deck should be 2 °C above the dew point, which depends on the difference in ambient temperature and the temperature of the cooled slide deck surface. (Refer to the Nano-Plotter manual section 2.3.9)
-
Turn on the machine and accessories (Nano-Plotter and the Diluter, Figure 2). For the Nano-Plotter, you should hear two beeps (See troubleshooting point 2).
The Nano-Plotter is shipped with several built-in programs written in the Nano-Plotter language (NPL). These programs include the ‘Sequential.npl’ program, which allows printing with mutiple tips. In our prints, we have found that printing with 2 tips is prone to artifacts, including tip-to-tip variations in deposition and positional defects, thus we do not recommend printing with multiple tips. Instead, for the best quality arrays, we print with a single tip using the more advanced Multitask Program. As this program is not standard for the Nanoplotter, in this section we detail printing with ‘Sequential.npl’ and have included the Multitask protocol as an Alternative (see Alternative Protocol). Sequential program allows you to wash and aspirate two tips at the same time (Refer to the Nano-Plotter manual section 7.3.1 General preparations).
-
Initialize the Nano-Plotter.
During initialization the Nano-Plotter goes through a system check. If successful, the NPC print program can be accessed. There are four modes in the NPC Program: Interactive, Edit, Run, and Simulate. In interactive mode, all built-in functions and devices of the Nano-Plotter can be activated in a direct (interactive) manner. This is useful if you want to perform adjustments, washing cycles and a pipette test before starting a program. Edit mode allows you to modify the Workplate file, which holds the locations and dimensions for the slides, microplate, wash/dry station, etc. Run mode is the mode you must be in to run a print program. Simulate mode, allows you to simulate the program generated visually in NPC. These menus are easily accessible from either the pull down menus or the button bar at the top of the program window (refer to the Nano-Plotter manual section 3.3 Program modes).
-
Activate and assign tips, tip sockets and diluter positions. In interactive mode, go to System -> Setup -> Pipette Head/Z-Sensor. Select the tip IDs or enter a new one by pressing the button to the right of the field. Select the sockets and the diluters you are using. The socket is the electrical socket that the tip is connected to. The diluter is the fluidics system, where 1 is the tube closest to the front of the machine.
Make sure that you have the tip you just selected assigned to the proper location by clicking on that position in the Mechanical Assignment box. This should correspond to the physical tip assignment in the print head. Position A is closest to the front of the machine.
Fill the tubing for the activated tips using the fill tubing option in the interactive mode.
Tap the tubes to get out air bubbles (See troubleshooting point 3).
Connect the tubes to the tips. Wash the tips a few times and make sure that the tubes don’t pop off (See troubleshooting point 4).
Make sure the tips are dispensing correctly. For the Nano-Plotter, use the Stroboscope to check how the tips are dispensing. If they are dispensing without sputtering, they are probably fine (See troubleshooting point 5). At this point, the voltage can be set for water, although it will be adjusted for lectins later. The ideal voltage may vary with tip but the stroboscope pattern should be two to three drops in a line with some space in between them (Figure 3).
Generate the print design parameters: For the Nano-Plotter, select the workplate (.npw) file. Any type of target can be accommodated in the workplate. Right clicking on the targets in Edit mode will give you a menu to edit or add new targets or the spot layout. The module for slides as a target group already exists, thus the dimensions are stored and you can increase the number of slides easily by increasing the rows and columns of slides.
-
Edit the target number to reflect the number of slides you would like to print. Edit the spot layout in order to use the Sequential.npl program (Refer to the Nano-Plotter manual section 6.3). If a target or target group contains more than one block then make appropriate entries such as rows of blocks, columns of blocks, distances between block row and block column.
In Sequential, the number of spot columns and rows must be a multiple of the lectin columns and rows in the microwell plate. We normally print 3 replicate spots of each lectin. Thus for a row with 5 lectins, the spot layout should be 15 columns. When using the NanotipA tips, which result in 100–150 µm diameter spots, we set the spot-to-spot distance to 250 µm. This distance can be set to 225µm if you have more probes to fit into the well dimensions. We leave enough room on either side of the array to aspirate buffers without scratching the printed arrays during the washing steps after hybridization, typically 1.5–2 mm.
Load the appropriate number of slides onto the printer deck in the orientation defined in the Workplate file.
-
Make sure the Z height is set for the print substrate. In the Nano-Plotter, use a Z sensor test. A Z-Level-Sensor, which can be attached to the side of the printhead, gives the exact height of each object on the tray. System- setup- pipette head/z sensor (Refer to the Nano-Plotter manual Section 6.2.3, Z-level measurement)
Although piezoelectric dispensing is always non-contact, close proximity between slides and dispenser nozzle ensures well-aligned spots.
Load the 384 well microwell plate into the cooled microplate holder.
Run the print program: In the Nano-Plotter Run mode, select Run Program to access the menu of Nano-Plotter programs. Select ‘Sequential.npl’ and double click.
A popup window will ask you to mark the microwell plate to indicate the number of rows and columns in the microplate that are filled with lectins. The two tips then dispense sequentially in a pattern that is a direct copy of the loaded samples in the microwell plate. (See troubleshooting point 6). We typically fill 5–6 columns and all 16 rows of the microplate in order to accommodate 80–90 lectins. The number of replicates for each sample is determined from the number of spots designated for the target slides in the workplate (Figure 4) (Refer to the Nano-Plotter manual Section 7.3.2 Definition of the workplate). If you assign 5 wells of sample to the microplate and 15 spots to the slides, Sequential will assume that you want 3 spots of each lectin. Therefore, the number of spots must be a multiple of the number of wells or you will receive an error. A pop-up window will confirm that you want 2 replicates in addition to the single default spot per sample.
-
In the next popup window, you will have the option to change several variables including number of droplets of the replicates, stroboscope delay time, distance to target, extra sample volume, aspiration flow, wash time and stroboscope break (Table 2). (Refer to the Nano-Plotter manual Section 7.4 Basic settingsin the dispensing programs and spotting).
We use a wash time of 30 seconds and recommend wash times between 30–60 seconds for the best results. An automatic test in the stroboscope (“StroboCheck”) can be carried out, which allows you to check the droplets in the stroboscope after each sample is loaded. We recommend performing the StroboCheck, as lectins are often more viscous than water and voltage adjustments may be required. Lectins that do not pass the StroboCheck will be dispensed to waste and their microwell plate coordinates will be saved to the RepairSeq.npl file.
Check the distance of the pipettes to your targets. A value of 0.5 mm is typical. Considerably higher values may be used, however this can lead to scattering due to static electricity. Lower values can also be used but a distance of at least 0.25 mm should be maintained for safety. We change the height so that the pin prints at 0.3 mm, which minimizes any variation due to airflow that might occur because of the humidifier. Typically, we equilibrate the Nano-Plotter enclosure for ~2 hours prior to printing which minimizes use of the humidifier. The SCHOTT Nexterion H slides we use undergo strict quality control and the surface is highly homogeneous. This may not be the case for all slides or surfaces and it is recommended that you test them with the dummy tip first.
Extra sample volume [µl]: The volume taken up is made up of the sum of the volume of drops needed, which is calculated by the program depending on the number of total arrays and replicate spots, plus the extra sample volume. The extra sample volume prevents the sample from being diluted with system liquid (there is no air gap between sample and system fluid). An extra sample volume between 0.5 to 1.5 µl is sufficient. In theory, 5 µL of sample loaded into the plate should be sufficient, however this relies on perfect calibration of the NanotipA to the bottom of the 384 well microplate. We suggest loading 20 µL of sample per well in case the sample must be reprinted due to errors and to insure against evaporation. We have found that ~1 µL of sample evaporates during a 10 hr print. With a larger volume, the percentage change in concentration due to evaporation is lower.
Aspiration flow [µl/sec]: The default aspiration flow works well for aqueous media and should be changed only if a problem occurs.
Stroboscope break: The stroboscope break is quite important to adjust the piezo parameters of the pipettes for the real samples, which will generally be more viscous than water. If activated, the pipettes will take up sample and the pipetting head will move to the stroboscope and wait until the user has performed a manual stroboscope test/adjustment. Change the parameters such as voltage and frequency until optimal drops are produced (Figure 3). We perform the Stroboscope break to adjust the parameters for the first lectin. Although lectin properties can vary and influence the drop pattern, it is complex to change the parameters for each lectin. However, it is possible to perform a Stroboscope break periodically as the print is running. If you know that a particular sample is more viscous, you can readjust the parameters using the Stroboscope break.
-
The program should commence. Samples that do not pass the Stroboscope check are not printed and the program marks the graphic representation of the microplate with an orange circle to indicate the missing sample. It takes approximately 12 hours to print 9 slides of 24 arrays, containing ~90 lectins each, using 1 tip.
Periodically monitor the printing process to make sure that everything is functioning properly. After the print is finished, we wash the tips several times and check the stroboscope until we get a good droplet distribution without stray spots (fluttering) before running the correction file.
A correction file is written during the print with the microwell plate coordinates for the samples that did not pass the stroboscope test. This file can be found saved in the subdirector data of the program Sequential as the repair file, Sequential_Repair.cor. Run RepairSeq.npl and select Sequential_Repair.cor to correct the print and fill in any missing spots. Incubate the arrayed slides for 1 hour at room temperature post-printing, in order to maximize the protein immobilization. If the arrayed slides are not to be used immediately, store them at −20°C in a slide box in a vacuum-sealed pack for up to one month.
-
Shut down the Nano-Plotter: Wash the tips until they dispense spots without fluttering in the Stroboscope. Run the Goodnight.npl program to remove water from the tips. Detach the tubes from the tips and empty the tubes in Interactive mode (Functions -> System -> Empty Pipette Tubing).
We find that performing this shut-down procedure minimizes clogs and air bubbles that make the next print set-up more difficult.
Figure 3.

Drop dispensing pattern in stroboscope and corresponding microarray pattern from a, b and c on water-sensitive yellow paper. (a) A drop splits into two to three single droplets, which is ideal for microarrays; but the drops should be in-line. Figures b and c shows faulty arrays. Incorrectly positioned spots may indicate low dispensing parameters according to figure 1b, whereas satellite spots may suggest high dispensing.
Figure 4.

(A) Schematic view of sequential pipetting. In Sequential, the two tips dispense sequentially in a pattern that is a direct copy of the loaded samples in the microwell plate. (B) Format of 24-blocks (3×8) slide.
Table 2.
Basic Setting Parameters in the Dispensing Programs and Spotting
| Tip setting | |
|---|---|
| Aspiration volume (µl) | 3 |
| Aspiration flow rate (µl/sec) | 0.20 |
| Return sample in source plate after spotting | No |
| Return sample in source plate if failed stroboscope check | No |
| Delay time (sec) | 1.0 |
| Before aspiration dry pad time (sec) | 0.10 |
| after aspiration dry pad time (sec) | 0.0 |
| Piezo voltage (V) | 100 |
| Piezo pulse width (µsec) | 50 |
| Piezo frequency (100 Hz) | 100 |
| Wash conditions | |
| Wash time | 30.00 |
| Dry time (sec) | 0.10 |
| Extrawash well | Extrawash |
| Extrawash volume | 0.00 |
| Extrawash flow rate (µl/sec) | 0.50 |
| Extrawash piezo | No |
| Stroboscope details | |
| Delay before check | 0.50 |
| Checks | 4 |
| Delay between checks (sec) | 0.10 |
| % CV tolerance across checks | 5% |
| Z heights | |
| Z height from target | 0.3 |
| Z height from traverse target | 0.0 |
BASIC PROTOCOL 2
SAMPLE PREPARATION, LABELING, HYBRIDIZATION AND DATA ANALYSIS
Following Basic Protocol 1, Basic Protocol 2 can be performed to hybridize samples. Prior to hybridizing samples of interest, glycoprotein standards should be evaluated as a quality control (Refer to Anticipated Results section for further discussion). In addition, we include information on data extraction and analysis using Genepix Pro 7 and hierarchical clustering.
Materials
Reagents
Glycoproteins(Sigma, St. Louis, MO) or cells (harvested from tissue culture)
Lectin array (from Basic protocol 1). Printed slides should be stored under vacuum at −20°C and can be used for up to 1 month
NHS-Cy3 or -Cy5 dye (GE Healthcare Life Sciences, Piscataway, NJ). This reagent is light sensitive and should be stored at 4 °C.
Slide-A-Lyzer cassette (Pierce, Rockford, IL)
Cy dye labeling buffer (0.1 M Na2CO3 in H2O, pH=9.3). A stock buffer may be made but the pH will change over time and will need adjustment.
25-Gauge needle, 1-mL plastic syringe.
DC protein assay (Bio-Rad, Hercules, CA)
Phosphate-buffered saline (PBS; 0.1 M NaH2PO4, 0.15 M NaCl, pH 7.3)
Washing buffer- PBS-Tween (PBS-T; 0.1 M NaH2PO4, 0.15 M NaCl, 0.01% Tween 20, pH 7.2)
Blocking solution (25 mM ethanolamine in 100 mM sodium borate pH 8.0)
Coplin jars
Slide spinner (Labnet International, Edison, NJ)
Deionized water, to be used in all solutions
Instruments
VialTweeter sonicator (Heischler U.S.A., Ringwood, NJ)
Optima L-100K Ultracentrifuge (Beckman Coulter, Brea, CA, USA)
Avanti JE centrifuge (Beckman Coulter, Brea, CA, USA)
24-well ArrayIt multi-well Hybridization Cassette (Arrayit Corporation, Sunnyvale, CA )
Slide spinner model C1303 (Labnet International Woodbridge NJ)
Synergy HT microplate reader (BIO-TEK Winooski, VT)
Labotron shaker AK15/6 (Bottmingen, Switzerland)
GenePix 4300 A fluorescent slide scanner (Molecular Devices, Sunnyvale, CA)
Genepix Pro 7 software (Molecular Devices, Sunnyvale, CA)
Glycoprotein and cell membrane labeling
-
1.
Label glycoproteins with 60 µg Cy dye/ mg of protein (Cy5- NHS GE Life Sciences, Piscataway, NJ) in Cy dye labeling buffer buffer (pH 9.3). Incubate the glycoprotein for 30–45 minutes at room temperature on a rocker. Quench the free dye with 250 mM Tris buffer (pH 6.8) to stop the reaction and ensure homogeneous sample labeling. If necessary, dialyze the samples against PBS. We found dialysis helpful in reducing background with complex samples such as cell membranes, possibly due to improved micelle formation, as hybridized free dye does not result in increased background. Minimize the amount of light exposure by covering or performing in the dark. All steps performed after this point should take light exposure into consideration.
-
2.
Alternatively, isolate the membrane components of cells harvested with a cell scraper. We avoid the use of proteases, such as trypsin, to release cells to prevent any bias in the glycoprotein pool due to selective cleavage (Takekawa et. al., 2006).. Physically disrupt cells by probe tip sonication to form micellae or by sonication using a VialTweeter (Heischler), which can simultaneously sonicate multiple eppendorf tubes at high cavitation allowing smaller volumes to be processed. We have adapted our original protocol for cell membrane preparation to the VialTweeter. The resistance increases and power decreases along the length of the VialTweeter. For the best results, load two eppendorf tubes into the VialTweeter holes closest to the power source. Set the amplitude to 70 % and rotate the cycle to 1 for 5 seconds and back to zero for 10 seconds, allowing the samples to rest. Repeat this twice for a total of 3 times. We have observed that this results in the formation of membrane vesicles that are similar to those observed for probe-tip sonication. Follow by NHS-Cy dye labeling of samples as described above for glycoproteins. The labeled cell membrane preparations can be aliquoted and snap frozen in liquid N2. Aliquots can be stored at −80 °C for future use. Calculate labeled protein concentration and Dye/Protein ratios according to the instructions included with the dyes.
Slide processing and microarray hybridization
-
3.
Prior to use for a large experiment, one of the slides should be tested using one or many glycoprotein standards.
This adds an important level of quality control that can help identify inactive and misprinted lectins. We do this by evaluating the activity of both the whole slide and individual lectins for every block (see Additional Considerations section: Glycoprotein signatures as a quality control measure.
-
4.
Allow the printed slide to come to room temperature for approximately 10–15 min.
Lectin array slides should be handled very carefully. Always wear gloves during slide handling and avoid any contact with the slide surface.
-
5.
Place the slide(s) in a coplin jar. Slowly add 50 ml blocking solution to the coplin jar. Incubate on an orbital shaker set to rotate at 100 rpm for 60 min at room temperature (15–25 °C).
-
6.
Wash slides by adding 50 ml wash solution to the coplin jar. Incubate on an orbital shaker set to rotate at 100 rpm for 5 min at room temperature (15–25 °C). Discard wash solution. Repeat wash step twice (a total of three wash steps).
-
7.
After the third wash step, leave slides submerged in water to prevent them drying out. Remove a single slide from the Petri dish and dry the slide using a slide spinner.
-
8.
Fit the lectin microarray slides within the 24-well FAST frame to create a separate well for each individual array.
-
9.
To each well (array) add either 10 µg labeled glycoprotein sample or 2.5 µg of labeled cell membrane sample diluted to 100 µl in PBS and incubate for 2 hr at room temperature. Note: For dual-color experiments, an equal amount of Cy3- and Cy-5 labeled sample (or reference) should be mixed and added to each well (i.e. 2.5 µg of a Cy3-sample mixed with 2.5 µg of a Cy5-reference). Steps involving labeled proteins/probes should be carried out with a cover or in the dark.
-
10.
Incubate the arrays on an orbital shaker with a gentle rotation. We have found that high frequency rotation results in higher signal at the edges.
Wash the arrays five times, each time with 200 µl of wash buffer to cover the bottom of the well. Once finished, remove the FAST frame, immerse the slides in PBS (5 min) and dry the slides by using a bench top slide spinner before analysis. To avoid non-specific background signals, slides must be dried prior to scanning. We typically scan the slides either immediately or within 24 hours. We have observed no significant differences in fluorescence under these two conditions
Scanning and data analysis of lectin array
-
11.
Scan slides using a fluorescent slide scanner (Genepix 4300A). We preview the slide to adjust photomultiplier gain (PMT) for each channel (Cy3: 532 nm, Cy5: 635 nm) such that signals that are expected to be the same (e.g. in a reference sample labeled independently in each dye they have a ratio of 1). We generally acquire data at a resolution of 5.0 µm per pixel, and with the laser power at 100 %.
-
12.
Extract data from scanned slide using the scanner software (GenePix Pro 7). To extract the data, the spots are segmented in GenePix Pro 7. First, prepare a mask for the array and set the expected values based on your expectations from the print (i.e. column spacing, row spacing, feature diameter, rectangular format). Replicate the block-mask and drag the new block-mask to each array. Zoom into one well and position the block-mask over the array, auto-adjust the contrast and align the mask. After the alignment, it is necessary to visually evaluate each feature and adjust the size and position if necessary. One advantage of the piezoelectric printing method is that the spot morphology is generally circular and the print buffers have been optimized to reduce the “donut” effect. Thus, the edges of the feature are unambiguous and circular alignment with manual adjustment works well. We use the default setting of local background subtraction. Save the settings as a .gps file for reference. If you need to cross-reference the raw image with extracted data, it is convenient to load the .gps file which identifies the feature row and column. Extract the aligned data and export as a text file.
-
13.
Test the background subtracted median fluorescence of the three replicate spots per lectin for outliers using the Grubbs outlier test with alpha = 0.05. If there is an outlier, it is discarded before averaging the signals for replicated lectin spots. Average the signals for the replicate spots and take the log2 values. The averaged log2 lectin signals can be centered by the median lectin signal for each array.
Note: For dual-color data, we take the log2 ratio of the average median fluorescence for the two channels for each lectin. This can be median normalized by channel to ease dye bias. (Hsu et al., 2011). For dual-color data we threshold the signals using the signal-to-noise-ratio (SNR) provided by Genepix Pro 7. Signals with SNR lower than 3 are not included because their signals are statistically indistinguishable from noise. These low signals can have highly variable ratiometric signals.In addition, we use a floor value of 100 to minimize variability.
-
14.
Determine the glycan profiles using the positive lectin signals and their specificity annotations. For the glycoprotein standards, with known carbohydrate epitopes, we expect families of lectins that are known to bind those epitopes to have significantly positive signals (Refer to the Anticipated Results section below). If you are comparing more than two samples, you can perform hierarchical clustering on them using the Pearson correlation coefficient with average linkage analysis using Cluster 3.0 and visualize with Java Treeview. This will help you in assessing common patterns between the samples. Make sure that you cluster the lectins as well as the arrays, as lectins should group by specificity and which helps with the annotation. Alternatively, for 2 samples, the Pearson correlation can be calculated in Microsoft Excel. We consider a Pearson correlation of 0.9 or higher to be good, although any value above the Pearson critical value for a set significance level (p<0.01 is our typical p-value) can be of importance. The Pearson critical value is a function of the number of lectins.
ALTERNATIVE PROTOCOL
USING AN ADVANCED PROGRAM INTERFACE (MULTITASK) FOR CUSTOMIZABLE AUTOMATION
The basic protocols above describe using the standard Nano-Plotter programs. As an alternative to the basic protocol, we have included a protocol using an advanced program interface (API), called Multitask, which was developed by Richard Rouse (HTS Resources, San Diego, CA, USA). Although this program is not shipped with the Nano-plotter suite of programs, we hope to illustrate the immense automation possibilities (i.e. non-standard print positions, prototype substrates, quality control imaging and facilitation of data management) using the Nano-Plotter and an API.
The Nano-Plotter includes an interactive development environment (IDE) for writing programs using a Pascal based scripting language. Athough a non-standard print program can be written in Pascal using this environment, we use Multitask, which is available online (https://github.com/htsrjdrouse/GeSiM-Nano-Plotter-Multitask), to program our machine. Multitask is an object oriented API that enables the Nano-Plotter to use an extensible markup language (XML) that contain tags representing specific defined functions for liquid handling automation. Thus, we are able to program the Nano-Plotter by assembling XML commands using another programming language, Python. The Python script can be developed in an environment such as Spyder, which was made with the scientific researcher in mind. Python and Spyder are both open source projects which are available online for free. Although this adds a few steps to the workflow (Figure 5), once the API is developed, it offers a simple solution for researchers who are comfortable programming in a more human intuitive language (Python) for experimenting with different print designs.
Figure 5.
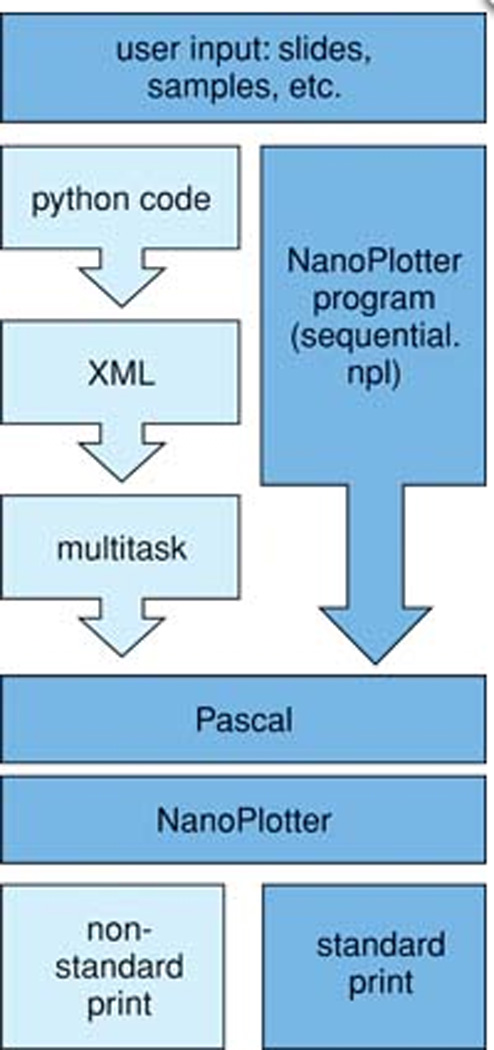
Schematic comparing workflow using the Multitask API and a standard NanoPlotter program.
Download Multitask from https://github.com/htsrjdrouse/GeSiM-Nano-Plotter-Multitask or develop an API.
Transfer the Multitask.npl file to the programs folder within the NPC folder. Open the python file in a text editor. The variables are defined in Multitask.
Change the number of tips. The example python file is written for either 1 or 2 tips although some alterations are required for 2 tips. Comment out the bbra (see comments in the program example provided in Supplementary Materials) variables for 1 tip by adding ‘#’ and delete the ‘#’ before the bbra variables for 2 tips. In addition the tips variable should be changed to 2.
Change the number of samples.
-
Change the target end row variable to match the number of slides you want to print. (tec = ?)
This does not have to match the Workplate settings, although the dimensions in the Workplate must be greater than the dimension in defined in the python program. The transfer list created from the python script will start at position 1,1 as defined by the Workplate.
If you are going to use more than 2 rows of targets, you have to change both the tbra and bbra variables in the program. Tbra is a set(dictionary) of variables for the target rows, so [1,2] refers to 2 rows and each number in the set will be passed to the program and printed as an XML command at a point defined by the for-loop (for k in range(0,len(tbra)):). If you have 3 rows, tbra = [1,2,3]. The set of variables assigned to bbra works similarly to pass values into the program to define the number of block rows. Since this program snakes, and since in a two-tip program, you use the highest numbered tip as a reference, the bbra sets for 1 and 2 tips is different. In the one tip program bbra = [every row up to 8]. In the two tip program bbra = [odd rows up to 7] (Refer to Supplementary Materials).
-
Save your python file and run it using the command line
Find the file using ‘cd’ (change directory) and ‘dir’ or ‘ls’.
You can use the tab key to autofill folders or filenames for you.
When you are in the right directory, type the command: mypythonprogram.py > myprint.txt
Press enter. Double check that your txt file is in the same folder as your python program. This is your transfer list.
-
Simulate your transfer list in Simulate mode.
Occasionally, there’s a bug in simulation mode where it doesn’t print across the slides. If this happens, restart the simulation and see if it’s fixed.
In Run mode, run Multitask
Select the correct transferlist.
Change variables, such as wash time and CV of y in the stroboscope check. Our optimized variable conditions are show in Table 2
-
Run
We recommend running the program with the dummy tip, especially if you significantly change your workplate. This is a good way to check the z-height and also to make sure that it will print within the boundaries of the 24 well gasket.
COMMENTARY
Lectin microarray technology addresses the challenge of glycan analysis by addressing lectins, carbohydrate binding proteins, to specific locations on a glass slide or other solid support, enabling rapid fingerprinting of glycosylation patterns of fluorescently labeled samples (Kuno et al., 2005 , Pilobello et al., 2005, Pilobello and Mahal, 2007) (Figure 1a). Lectins can discriminate between N-linked, O-linked, and glycolipid glycans and α versus β conformations. Lectin specificities, broadly defined, include galactosides, sialosides, fucosides, terminal N-acetylgalactosamine, N-acetylglucosamine, N-acetyllactosamine, blood group antigens, and mannose core structures (complex, hybrid and high). Unlike other methods for glycomic analysis such as HPLC or mass spectrometry, the lectin microarray can be used for the direct application of mixed or crude samples, including clinical samples such as sera and tissue extracts, without pre-fractionation or separation of the glycan types. Since its introduction in 2005, (Pilobello et al., 2005) lectin microarray technology has been used for the glycomic analysis of a wide variety of biological samples including glycoproteins (Pilobello and Mahal 2007.), bacteria (Hsu et al., 2006), mammalian cell-surfaces (Hsu et al., 2011), viruses (Krishnamoorthy et al., 2009) and clinical samples (Fry et al., 2011, Bird-Lieberman et al., 2012).
Our previous work focused on protocols for contact printing of lectin microarrays. Contact printing uses pins, often with a quill tip, to dispense samples onto the slide surface. Although this technology is quite simple to use and less expensive, problems may arise from the tips themselves, as they can be difficult to wash and dry thoroughly. In addition, the tips can scratch the slide surface and drag the printed lectins resulting in irregular spot morphologies. We have recently updated our methodology to use a non-contact piezoelectric printer (GeSiM Nano-Plotter). This change has resulted in superior activity for the majority of lectins on our array. Samples in the piezoelectric tips can be fully dispensed during the washing process insuring that samples do not carry over. In addition, this technology allows for a much more flexible print design that is not limited by the physical conformation of the tips. One disadvantage of piezoelectric printing is that print optimization can be time consuming (Refer to Troubleshooting points 4 and 5). Considerations for printing lectin microarrays using piezoelectric technology include optimization of the print environment to maximize lectin activity, quality control, and spot morphology. These are discussed in more detail in the Critical Parameters section below.
Critical Parameters
Optimizing print environment to maximize lectin activity
In many respects, printing high quality lectin microarrays is a matter of optimization. As they are proteins, most lectins will lose activity with time in buffer due to denaturation, evaporation and aggregation. This can be mitigated by minimizing the print time and lowering the temperature of the printing deck and microwell plate. Minimization of the print time depends on the complexity and number of arrays to be printed. We try to keep our print times under 10 hours, to prevent lectin activity issues. A typical print of 9 slides where each slide has 24 arrays, each containing 90 lectins per array can be printed in 12 hours using a single tip. A strategy to minimize loss of lectin activity is to divide the print in half and to do the print in two steps with two microwell plates each containing half of the lectins to shorten the amount of time any lectin spends in the plate. Microarray printers marketed for proteins often come with a cooled printing deck and microwell plate area and are encapsulated in an enclosure to prevent contamination from dust. Cooling the print deck can have unintended negative consequences for the print, due to the humidity in the chamber and the surface chemistry of the slides to be used. We have tested several slide chemistries and recommend using a functionalized hydrogel slide (such as Nexterion H from Schott) for optimal lectin activity and signal to noise. These slides work best when the relative humidity is 50%. However, water vapor condensation can inactivate the functional sites and must be avoided. Condensation occurs at the dew point, which is determined by the relative humidity and the difference in temperature between the surface (printing deck) and the surrounding area. Thus, the optimal temperature for the cooled printing deck depends upon the humidity and temperature of the surrounding area, which must also be controlled. The humidity can be raised with a humidifier, which often comes with the machine. If it is necessary to lower the humidity, as can occur during the summer months in warm humid climates, air can be pumped through desiccant into the enclosure. The pump can be directly connected to a relative humidity controller (such as Model RHC-1 ,Green Air Products, Oregon, USA,), which allows current to flow to the pump if the humidity exceeds a set percent humidity. Ideally, the microarray printer should be kept in a temperature and humidity controlled room to help minimize perturbations. Proper set up of this equipment is an essential part of the optimization process.
Array quality control
To optimize lectin activity in the piezoelectric print requires several considerations including lectin concentration, print buffer and tip ejection parameters. We typically adjust the concentration printed for each lot of lectin purchased. This is particularly important as most plant lectins are extracted from natural sources and can vary in activity from lot-to-lot. When we first optimize new lectins, we choose a concentration that gives a fluorescence signal in the linear range of detection when it is incubated with a fluorophore-labeled glycoprotein to which it can bind (Figure 6). For the majority of lectins, a concentration between 500 and 1000 µg/ml was found to be optimal for most applications. Whenever a new lot of lectin is obtained, it should be printed at multiple concentrations (usually 0.25, 0.5, 1 mg/mL) and compared to the previous lot on the same array. For antibodies, the upper end of the printing range is recommended.
Figure 6.

Mock signal intensities for lectins acquired from lectin optimization prior to printing.
A suitable print buffer will keep the lectin in a state that maintains its molecular recognition properties. For most lectins, phosphate buffered saline (PBS) is a suitable buffer. Other components that can aid the print include the addition of carbohydrates to stabilize the protein and small amounts of detergents such as 0.01% Tween 20, which help the spot morphology by disrupting air/water interface effects (Kambhampati, 2004). We recommend against including the common additive glycerol in the print buffer as we find that it interferes with lectin deposition.
Spot morphology
In a piezoelectric print, the tip ejection of the droplet is critical for determining spot size and morphology. Two parameters affect the velocity and size of the droplet, the voltage and the voltage pulse. Optimization of these 2 parameters is essential; however they can be tip dependent. The best estimation of the velocity and size of the droplet is to look at the image of the dispensing droplets. The Nano-Plotter includes a stroboscope function which takes images of the droplet while it is dispensing, allowing for quality control and optimization of the voltage and pulse parameters just prior to printing (Figure 3). A description of this aspect of the array fabrication is given in this protocol for use with the Nano-Plotter, however these steps can be applied to other piezoelectric print systems. The piezoelectric tips available come in multiple sizes: Nanotip (0.4 nl), NanotipA (0.25 nl) and Picotip (0.1 nl). We usually use NanotipA tips as they clog less and the volumes dispensed are less sensitive to air currents which cause misalignment, however we have used Picotips to print higher density arrays.
Beyond the lectin microarray print, some thought must be given to sample preparation and hybridization. The arrays can handle a variety of different samples from whole viruses and bacteria to cell membrane micellae, glycoproteins and tissue samples (Krishnamoorthy et al., 2009, Batista et al., 2011, Li et al., 2011, Toyoda et al., 2011, Yasuda et al., 2011,). We will not discuss the wide variety of sample preparations here. Instead we focus on a newly optimized method for the preparation of mammalian cell membrane samples which allows for the preparation of smaller volumes of material. The membrane micellae are then labeled with NHS-Cy3 or -Cy5. Although other dyes can be used, these dyes are the standard for most microarray scanners. The amount of labeled material required for an analysis can vary based on the nature of the experiment. Typically we have found that 1–10 micrograms of material are needed, with ~ 2.5 micrograms of sample showing good signal strength for most complex samples such as membranes.
Troubleshooting,
During the course of printing it may be necessary to open the enclosure, which can cause fluctuations in the humidity and temperature (the temperature within small air space of the enclosure can be influenced by the cooling deck), therefore it is better to keep the printing deck a few degrees above the dew point. This has an added advantage since it has been reported that printing 2°C above the dew point improves spot morphology.
If you do not hear 2 beeps there iss an electrical error of some type. Let the machine dry out if it has over-humidified (refer to the Nano-Plotter manual section 3.4.1 First program start).
Air bubbles inside the tubing: Eliminate all air bubbles in the tubing or either the tubes will pop off or inconsistencies will be seen in the drop deflection, which will affect alignment of the printed spots. This process can take a long time. To remove air bubbles, we typically fill the tubes, tap the side of the tubes, and partially empty the tube. When necessary, replacing the tubes also helps to reduce bubbles. It also helps to empty the tubes after printing.
If the tube pops off, you may have a clogged tip. If this happens, refer to the troubleshooting section of the Nano-Plotter manual.
If they are sputtering a little, this may be fixed by putting the Nano-Plotter on stand-by for a while, which washes the tip at timed intervals. To run the NP2 Standby.npl program, make sure the program is in Run mode by pressing the red “R” button. Then go to Program -> Run Npl-Application or just press F4. Select NP2 Standby.npl and press Enter or double click. Fill in the number of hours and time between washes. If you are setting up the printer before printing or the night before a print, it’s best to run the Standby program until you are ready to print. Refer to the running standby program of the Nano-Plotter manual section 5.3.4. If the tips are still not dispensing properly after running Standby.npl, it is necessary to clean the tips. This should not be done unless necessary as the tips can degrade from the cleaning procedure with time. To clean the tips, suspend them in a cleaning solution and sonicate for 5 minutes in a jewelry sonicating bath (which is lower power than typical sonication baths found in a laboratory setting). Cleaning solutions can be found in Nano-Plotter manual section 12.1.2. We are usually successful with a mild cleaning solution of 0.1 % TWEEN in water.
We have found some tip-to-tip variation, which can result in differences that lower the correlation between two identically hybridized arrays to levels below our threshold. This may be due to lectin printing peculiarities. For example, we have observed voltage dependent printed spot size variations that are lectin specific.
Anticipated Results
Glycoprotein signatures as a quality control measure
Quality control measures after printing primarily involve judging spot quality and lectin activity. The consistency of the printed arrays can be evaluated by comparing the overall range of intensities between spatially separated blocks hybridized with the same glycoprotein. These signatures can also be compared to previous experiments scanned under approximately the same conditions. For 10µg of Asialofetuin scanned with a PMT gain of 500 on the Genepix 4300A scanner, we have observed a maximum signal of 4500 (A.U.). The maximum intensity will vary with the glycoprotein, however generally if the maximum signal is less than 1000 (A.U.), we consider the arrays unusable.
In order to test the ability of the printed arrays to identify defined glycan structures, as well as distinguish between closely related ones we use well-characterized glycoproteins such as; Fetuin, Asialofetuin, Ovalbumin, Ovomucoid, Transferrin, Thyroglobulin, and RNAse. A sample lectin print pattern and glycoprotein binding pattern are presented in the Figure 7. (The lectin print list is presented in the Table 1.) The data can be interpreted using the specificity annotations of the lectins. For example, Fetuin and Asialofetuin have well characterized glycan structures and are routinely used as model glycoproteins for glycosylation studies. Fetuin is abundantly sialylated on bi- and triantennary complex-type N-glycans (Townsend et al., 1989). Asialofetuin, as its name implies, has unsialylated bi- and tri-antennary N-linked oligosaccharides. The lectins SNA and MAA bind specifically to terminal sialic acid with either an α-2,6 or an α-2,3 linkage, respectively. Asialofetuin does not show any binding to the sialic acid recognizing lectins SNA and MAA. In contrast, PNA bound to only asialofetuin as its specificity is for galactosyl (α-1,3) N-acetylgalactosamine residues, which are exposed due to the lack of sialic acid. The differences in lectin binding confirm that the lectins are active and maintaining their specifities.
Figure 7.
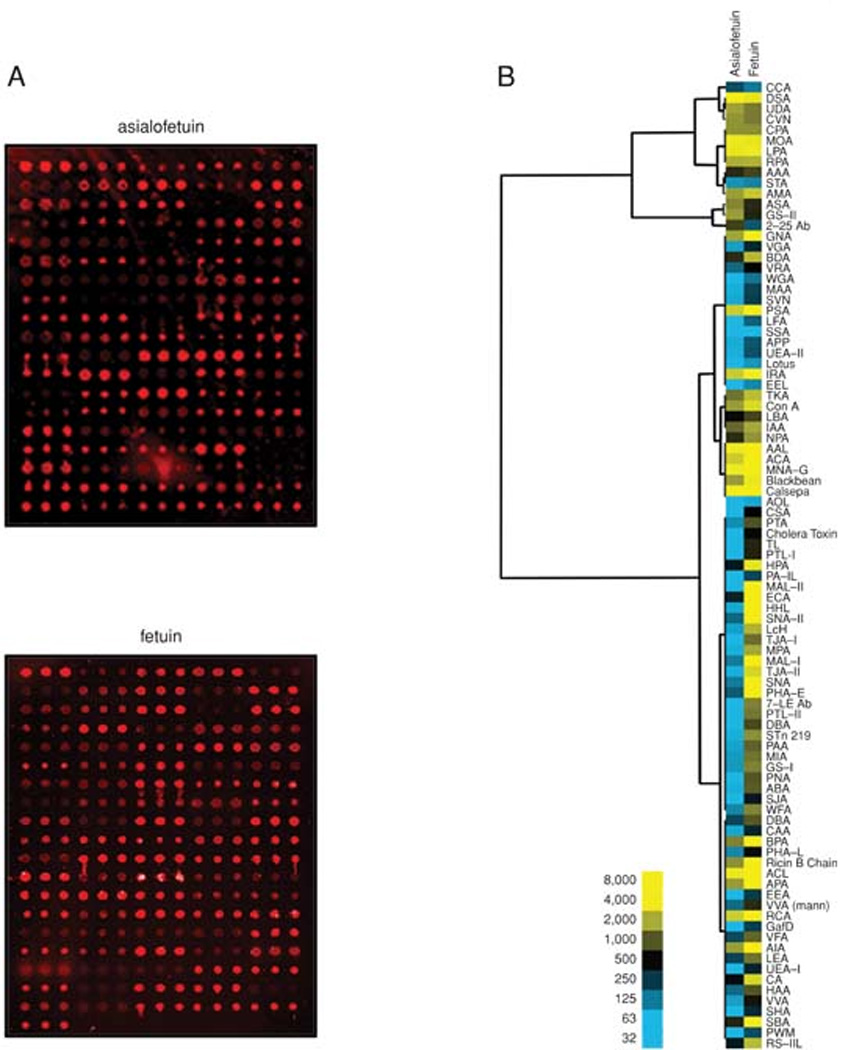
Comparative glycan profiling of Asialofetuin (upper image) and Fetuin (lower image) (a) on printed lectin microarrays. Glycans, attached to Cy5 labeled glycoproteins, that have successfully bound with lectins will fluoresce. The total fluorescence pattern generated by the glycan to lectin binding is then captured by the scanner, extracted by the software, and analyzed in Excel. (b) Hierarchical cluster and heatmap of median normalized lectin microarray data for Fetuin and Asialofetuin. The blue squares indicate a fluorescence of less than 500 A.U., whereas yellow squares indicate a fluorescence of greater than 500 A.U. As expected, several known sialic acid binding lectins (i.e. LFA, MAL-I, MAL-II, SNA, TKA) have a higher fluorescence intensity for Fetuin.
Correlation analysis
Although it is a convenient measure of similarity, correlation analysis has its limitations in terms of quality control. For example, changes in the overall fluorescence intensity would most likely go unnoticed with just correlation analysis. Lower intensities could be the result of less active lectins, a mechanical problem with the scan (slide askew), or the filter choice could be incorrectly selected. Thus, arrays with overall low signals should be treated with skepticism. One caveat of correlation analysis is that the Pearson correlation depends on a parametric assumption. For the most part, Log2 transformation of the data results in nearly normal distributions, however we have observed signal distributions outside of that model. Another caveat in correlation analysis is the possibility that good correlation could occur even though a few critical lectins may not be active. Clustering of the lectins can help to confirm glycan patterns, as some of the lectins have overlapping specificities, thus their binding should co-vary across samples. However, some lectins are highly specific and unique. The activity of those lectins should be evaluated individually.
Time Considerations
Most of the time considerations revolve around concerns of lectin denaturation. Lectins can be aliquoted and stored at −80°C for 1–2 years. Their quality can be checked by hybridizing the glycoprotein standards and checking activity by looking for signal strength in lectins with specificities that correspond to the known glycoprotein epitopes. The prepared microwell plate of diluted lectins can be stored at 4°C for up to 12 hours, however we suggest using it as soon as possible. The printed lectin arrays can be stored for 1 month at −20°C in a vacuum-sealed pouch.
Printing 9 slides using Basic Protocol 1 in the 24 array format using a single tip takes approximately 14 hours including microwell plate preparation and NanoPlotter set-up. Although the print time is around 12 hours, we have adjusted for troubleshooting the Nano-Plotter set-up and running the correction file. The alternative printing protocol could take either more or less time depending on the number of tips used and the print design. For Basic Protocol 2, if the samples are already prepared, the hybridization and scanning will take approximately 5 hours. Sample preparation times for glycoproteins and cell membranes vary. Glycoproteins may be quenched with 250 mM Tris buffer (pH = 6.8), forgoing dialysis, which should take 1 hour. We suggest overnight dialysis for cell membrane samples. Including the ultracentrifugation, labeling and dialysis, cell membrane sample preparation should take approximately 15–20 hours.
Supplementary Material
LITERATURE CITED
- Batista BS, Eng WS, Pilobello KT, Hendricks-Muñoz KD, Mahal LK. Identification of a conserved glycan signature for microvesicles. J. Proteome Res. 2011;10:4624–4633. doi: 10.1021/pr200434y. [DOI] [PMC free article] [PubMed] [Google Scholar]
- Bird-Lieberman EL, Neves AA, Lao-Sirieix P, O’Donovan M, Novelli M, Lovat LB, Eng WS, Mahal LK, Brindle KM, Fitzgerald RC. Molecular imaging using fluorescent lectins permits rapid endoscopic identification of dysplasia in Barrett’s esophagus. Nature Medicine. 2012;18:315–321. doi: 10.1038/nm.2616. [DOI] [PubMed] [Google Scholar]
- Fry SA, Afrough B, Lomax-Browne HJ, Timms JF, Velentzis LS, Leathem AJ. Lectin microarray profiling of metastatic breast cancers. Glycobiology. 2011;21:1060–1070. doi: 10.1093/glycob/cwr045. [DOI] [PubMed] [Google Scholar]
- Hardiman G, Ramana Bhasker C, Rouse R. Microarray Innovations Technology and Experimentation. Boca Raton, FL: CRC Press; 2009. [Google Scholar]
- Hirabayashi J. Concept, strategy and realization of lectin-based glycan profiling. J. Biochem. 2008;144:139–147. doi: 10.1093/jb/mvn043. [DOI] [PubMed] [Google Scholar]
- Hsu KL, Gildersleeve JC, Mahal LK. A simple strategy for the creation of a recombinant lectin microarray. Mol. Biosyst. 2008;4:654–662. doi: 10.1039/b800725j. [DOI] [PMC free article] [PubMed] [Google Scholar]
- Hsu KL, Mahal LK. A lectin microarray approach for the rapid analysis of bacterial glycans. Nat. Protoc. 2006;1:543–549. doi: 10.1038/nprot.2006.76. [DOI] [PubMed] [Google Scholar]
- Hsu KL, Pilobello K, Krishnamoorthy L, Mahal LK. Ratiometric lectin microarray analysis of the mammalian cell surface glycome. Methods Mol. Biol. 2011;671:117–131. doi: 10.1007/978-1-59745-551-0_6. [DOI] [PubMed] [Google Scholar]
- Kambhampati D. In Protein Microarray Technology. Weinheim, Germany: Wiley-VCH; 2004. Production of Protein Microarrays; pp. 165–193. [Google Scholar]
- Krishnamoorthy L, Bess JW, Jr, Preston AB, Nagashima K, Mahal LK. HIV-1 and microvesicles from T cells share a common glycome, arguing for a common origin. Nat. Chem. Biol. 2009;5:244–250. doi: 10.1038/nchembio.151. [DOI] [PMC free article] [PubMed] [Google Scholar]
- Kuno A, Uchiyama N, Koseki-Kuno S, Ebe Y, Takashima S, Yamada M, Hirabayashi J. Evanescent-field fluorescence-assisted lectin microarray: a new strategy for glycan profiling. Nat. Methods. 2005;2:851–856. doi: 10.1038/nmeth803. [DOI] [PubMed] [Google Scholar]
- Li Y, Tao SC, Bova GS, Liu AY, Chan DW, Zhu H, Zhang H. Detection and verification of glycosylation patterns of glycoproteins from clinical specimens using lectin microarrays and lectin-based immunosorbent assays. Anal. Chem. 2011;83:8509–8516. doi: 10.1021/ac201452f. [DOI] [PMC free article] [PubMed] [Google Scholar]
- Pilobello KT, Krishnamoorthy L, Slawek D, Mahal LK. Development of a lectin microarray for the rapid analysis of protein glycopatterns. Chembiochem 2005. 2005;6:985–989. doi: 10.1002/cbic.200400403. [DOI] [PubMed] [Google Scholar]
- Pilobello KT, Mahal LK. Deciphering the glycocode: the complexity and analytical challenge of glycomics. Curr. Opin. Chem. Biol. 2007;11:300–305. doi: 10.1016/j.cbpa.2007.05.002. [DOI] [PubMed] [Google Scholar]
- Shirai T, Watanabe Y, Lee MS, Ogawa T, Muramoto K. Structure of rhamnose-binding lectin CSL3: unique pseudo-tetrameric architecture of a pattern recognition protein. J. Mol. Biol. 2009;391:390–403. doi: 10.1016/j.jmb.2009.06.027. [DOI] [PubMed] [Google Scholar]
- Takekawa H, Ina C, Sato R, Toma K, Ogawa H. Novel Carbohydrate-binding Activity of Pancreatic Trypsins to N-Linked Glycans of Glycoproteins. J. Biol. Chem. 2006;281:8528–8538. doi: 10.1074/jbc.M513773200. [DOI] [PubMed] [Google Scholar]
- Townsend RR, Hardy MR, Cumming DA, Carver JP, Bendiak B. Separation of branched sialylated oligosaccharides using HPAE-PAD. Anal. Biochem. 1989;182:1–8. doi: 10.1016/0003-2697(89)90708-2. [DOI] [PubMed] [Google Scholar]
- Toyoda M, Yamazaki-Inoue M, Itakura Y, Kuno A, Ogawa T, Yamada M, Akutsu H, Takahashi Y, Kanzaki S, Narimatsu H, Hirabayashi J, Umezawa A. Lectin microarray analysis of pluripotent and multipotent stem cells. Genes Cells. 2011;16:1–11. doi: 10.1111/j.1365-2443.2010.01459.x. [DOI] [PubMed] [Google Scholar]
- Walther M, Stillman B, Frisse A, Beator J. The FAST Guide to Protein Microarrays. Dassel, Germany: Whatman/Schleicher & Schuell; 2007. [Google Scholar]
- Yasuda E, Tateno H, Hirabayashi J, Iino T, Sako T. Lectin microarray reveals binding profiles of Lactobacillus casei strains in a comprehensive analysis of bacterial cell wall polysaccharides. Appl. Environ. Microbiol. 2011;77:4539–4546. doi: 10.1128/AEM.00240-11. [DOI] [PMC free article] [PubMed] [Google Scholar]
Associated Data
This section collects any data citations, data availability statements, or supplementary materials included in this article.