

Abstract
Triclosan is an antimicrobial chemical incorporated into many personal, medical and household products. Approximately, 75% of the U.S. population has detectable levels of triclosan in their urine, and although it is not typically considered a contact sensitizer, recent studies have begun to link triclosan exposure with augmented allergic disease. We examined the effects of dermal triclosan exposure on the skin and lymph nodes of mice and in a human skin model to identify mechanisms for augmenting allergic responses. Triclosan (0%–3%) was applied topically at 24-h intervals to the ear pinnae of OVA-sensitized BALB/c mice. Skin and draining lymph nodes were evaluated for cellular responses and cytokine expression over time. The effects of triclosan (0%–0.75%) on cytokine expression in a human skin tissue model were also examined. Exposure to triclosan increased the expression of TSLP, IL-1β, and TNF-α in the skin with concomitant decreases in IL-25, IL-33, and IL-1α. Similar changes in TSLP, IL1B, and IL33 expression occurred in human skin. Topical application of triclosan also increased draining lymph node cellularity consisting of activated CD86+GL-7+ B cells, CD80+CD86+ dendritic cells, GATA-3+OX-40+IL-4+IL-13+ Th2 cells and IL-17 A+ CD4 T cells. In vivo antibody blockade of TSLP reduced skin irritation, IL-1β expression, lymph node cellularity, and Th2 responses augmented by triclosan. Repeated dermal exposure to triclosan induces TSLP expression in skin tissue as a potential mechanism for augmenting allergic responses.
Keywords: triclosan, allergy, TSLP, OVA, Th2
Triclosan (2,4,4′-trichloro-2′-hydroxydiphenyl ether) is a synthetic antimicrobial chemical incorporated into various medical devices, personal health care products and household consumer goods. Although triclosan has been in use in the United States since the 1960s, the FDA is re-evaluating its safety and efficacy. The CDC reports that triclosan is detected in the urine of 75% of the U.S. population (Calafat et al., 2008), a reflection of its ubiquitous use today. Triclosan is a small lipophilic compound that is readily absorbed through the skin. Many healthcare settings use triclosan-containing hand soaps and sanitizers to prevent nosocomial infections, and it was recently found that staff at hospitals that used triclosan-containing hand soaps had increased concentrations of triclosan in their urine (MacIsaac et al., 2014). Although triclosan itself has low allergenic and irritation potential (Lachapelle et al., 1979) with few cases of contact dermatitis reported, analyses of data collected from the National Health and Nutrition Examination Surveys (NHANES) and others have revealed a positive association between urinary triclosan levels and diagnoses of allergy and hay fever (Clayton et al., 2011), allergic sensitization to air and food allergens (Bertelsen et al., 2013; Savage et al., 2012; Spanier et al., 2014), and increased asthma exacerbations (Savage et al., 2014). Triclosan is incorporated into products at concentrations between 0.1% and 1%, and was found by our laboratory to augment allergic responses in a mouse ovalbumin (OVA) asthma model after 28 days of repeated dermal exposures to 0.75%–3% triclosan (Anderson et al., 2012). The mechanisms that promote these adjuvant effects are not yet known. Further investigations into the immunological mechanisms that augment allergic responses with repeated dermal triclosan exposure are needed.
We hypothesized that repeated dermal exposure to triclosan induces early changes in cytokine expression in the skin tissue and local draining lymph nodes that help promote allergic immune responses. Analyses of the early molecular and cellular changes in the skin tissue and skin draining lymph nodes (LN) after repeated dermal exposure to triclosan induce a unique cytokine expression signature in the skin that includes increased thymic stromal lymphopoietin (TSLP) expression in both mouse and human skin. In the lymph node (LN) we identified increases in antigen presenting cells (APCs), Th2 cells and IL-17+ CD4 T cells. In vivo antibody blockade of TSLP significantly reduced the augmented allergic responses in the skin and LN. Dermal exposure to triclosan induces expression of TSLP in mouse and human skin tissue as a potential mechanism for augmenting allergic disease.
MATERIALS AND METHODS
Animals
Female BALB/cAnNTac (BALB/c) mice were purchased from Taconic and BALB/c-Tg DO11.10 (DO11.10) mice (6–8 weeks of age) from The Jackson Laboratory. Mice were housed 3–5 per cage in sanitized HEPA-filtered ventilated cages with sterilized hardwood chip bedding and nesting enrichment materials in the AAALAC-accredited NIOSH animal facility in Morgantown, WV. Mice were provided with NIH-31 modified irradiated rodent diet (Harlan) and autoclaved tap water ad libitum. Euthanization was performed by CO2 asphyxiation. Animal procedures were performed according to the Guide for the Care and Use of Laboratory Animals and reviewed and approved by the NIOSH Animal Care and Use Committee.
Animal Procedures
Chemical exposures
Triclosan (Calbiochem; CAS number 3380-34-5) was dissolved in acetone (Sigma) as a percent solution (weight/volume) at concentrations based on previous studies (Anderson, et al., 2012). For epicutanous exposures which we refer to here as dermal exposures, 25 μl of solution was pipetted onto the dorsal surface of both ears at 24-h intervals for the durations indicated. Studies included 3–6 mice/exposure group depending upon the biological endpoint being evaluated.
Injections
For OVA sensitization, mice received 10μg of ovalbumin (OVA; Sigma) dissolved in USP grade PBS (Amresco) by intraperitoneal injection. Functional grade anti-mouse TSLP (clone 28F12, eBioscience) or Rat IgG2a isotype control (eBR2a) antibodies were also prepared in PBS and injected intraperitoneally (200–400 μg). A timeline of the treatments is depicted in Figure 7A. For adoptive cell transfers, CD4 T cells were negatively selected using magnetic cell isolation (Stemcell) from pooled spleens and peripheral lymph nodes collected from DO11.10 mice. DO11.10 CD4 T cells (3 × 10⁶) were adoptively transferred intravenously into BALB/c hosts just prior to OVA injections.
FIG. 7.
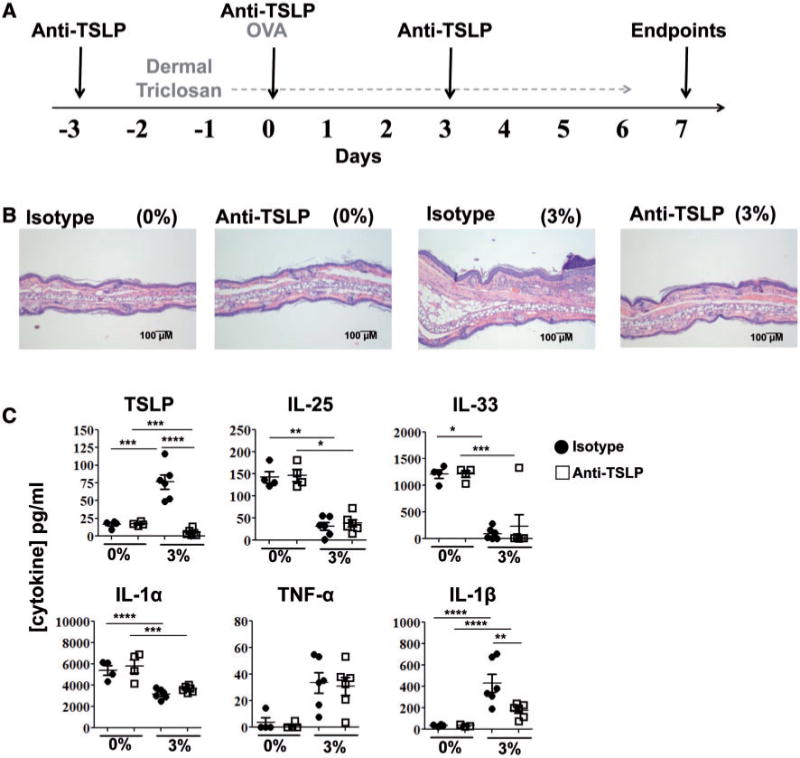
In vivo antibody blockade of TSLP impairs allergic responses in the skin augmented by triclosan. Timeline of treatments to OVA-sensitized mice co-treated with anti-TSLP or isotype control antibodies and dosed daily with triclosan (A). Representative photomicrographs of H&E-stained ear pinnae tissue sections (B) and concentrations of cytokine in ear protein lysates of mice dosed daily with 0% or 3% triclosan and co-treated with anti-TSLP (square) or isotype control (circle) antibodies (n=4–6 mice) (C). Each data point reflects analyses of an ear from an individual mouse (C). Data are representative of two independent studies. Bars represent the mean ± SEM, with statistical significance indicated as P ≤ .05 (*), P ≤ .01 (**), P ≤ .001 (***), and P ≤ .0001 (****).
Ex Vivo Lymph Node Cell Stimulations
Superficial cervical lymph nodes draining the ears (LN) were collected, homogenized between frosted microscope slides and counted on a Cellometer (Nexcelom). Lymph node cells (5 × 10⁵) were seeded into 96-well u-bottom plates with soluble anti-CD3 (5 μg/ml) and anti-CD28 (2 μg/ml) in RPMI media containing L-glutamine and HEPES (Cellgro) with 7.5% fetal bovine serum (Hyclone), 50 μM 1-Mercaptoethanol and penicillin-streptomycin (Sigma-Aldrich) (cRPMI). Cells were incubated for 24 h in a humidified incubator (37°C/5% CO2). Cytokines in the supernatants were measured using Flowcytomix bead assay kits (eBioscience). For intracellular cytokine analyses, LN cells (1 × 10⁶) were incubated in loosely capped 12 × 75 mm tubes in 500 μl cRPMI with leukocyte activation cocktail with Golgi Plug (BD) for 4 h.
Ear Histology and Protein Lysates
Ears were fixed in 10% neutral buffered formalin and embedded in paraffin. Tissues were sectioned at 5 μM and stained with Hematoxylin-Eosin (H&E) and evaluated using microscopy. Alternatively, ears (1 per mouse) were mechanically disrupted on a TissueLyser II (Qiagen) in T-PER protein extraction reagent (Pierce) and soluble proteins quantified by BCA protein assay (Pierce). Cytokines were measured in 25 μg of protein lysate using Flowcytomix bead assay kits (eBioscience) or measured in 100 μg of protein lysate by ELISA including TSLP (BioLegend), IL-25, and IL-33 (eBioscience).
Flow Cytometry
Cells were resuspended in staining buffer (PBS +1% bovine serum albumin+ 0.1% sodium azide) containing anti-mouse CD16/32 (clone 2.4G2) to block Fc receptors. PMA-stimulated cells were then additionally labeled with Live/Dead Aqua fixable solution (Life Technologies) for exclusion of dead cells. Cells were incubated with fluorochrome-conjugated antibodies recognizing extracellular proteins: CD11b-PerCPCy5.5 (clone M1/70), MHC class II-Alexa Fluor 700 (M5/114.15.2), DO11.10-TCR-FITC (KJ1-26), B220-Alexa Fluor 488 (RA3-0452), CD4-APC-eFluor 780 (GK1.5), CD44-Alexa Fluor 700 (IM7), OX40-PE (OX-86), CD80-PE (16-10A1), and CD86-APC (GL1) from eBioscience and CD4-V500 (RM4-5), CD8-V500 (53-6.7), CD69-PE-CF594 (H1.2F3), and GL-7-Alexa Fluor 647 (GL7) from BD Biosciences. Cells were fixed in Cytofix buffer (BD Biosciences), and for intracellular cytokine staining, cells were also permeabilized with Perm Wash (BD Biosciences) containing 10% rat serum (Stemcell) and anti-mouse CD16/32. Cells were then incubated with fluorochrome-conjugated cytokine antibodies in perm wash: IL-4-Alexa Fluor 488 (11B11), IL-13-PE (13A) and TNF-α-PE-Cyanine7 (MP6-XT22) from eBioscience, IL-17-PE-CF594 (TC11-18H10), and IFN-γ-PE-CF594 (XMG1.2) from BD Biosciences and IL-2-BV42 (JES6-5H4) from BioLegend. Cells were alternatively fixed in Foxp3 fixation buffer (eBioscience), and incubated in Perm Buffer containing fluorochrome-conjugated antibodies: GATA-3 PE (TWAJ), T-bet-PE-Cyanine7 (4B10) (eBioscience) and ROR-γt-PE-CF594 (Q31-378) (BD). 100,000 events were collected and analyzed on an LSR II flow cytometer (BD Biosciences). Compensation controls were prepared with OneComp eBeads (eBioscience). Data analyses were performed using FlowJo 7.6.5 software (TreeStar Inc.).
EpiDerm Skin Model
The EpiDerm human epidermis tissues (EPI-200) were purchased from MatTek Corporation. The source of the commercially available tissues was a single human donor. Upon receipt, EpiDerm tissue inserts were incubated (4°C) for 1–2h, and incubated overnight (37°C/5% CO2) in 6-well tissue culture plates in 0.9 ml prewarmed (37°C) serum-free assay medium (MatTek Corp). Supernatants were collected and tissues were rinsed with Dulbecco’s PBS (DPBS) without calcium and magnesium (MatTek Corp). After removing the DPBS, 0.9 ml prewarmed assay media was added beneath each cell culture insert. Triclosan was added in 30 μl volumes atop the cell culture inserts (n=3) and the plates were returned to the incubator for 24 h. These studies were repeated with tissues from separate donors to confirm the results (data not shown).
Real-Time PCR
Ears (1 per mouse) or LN were mechanically disrupted on a TissueLyser II in Buffer RLT (Qiagen). Qiazol (ears) or chloroform (LN and EpiDerm) was added to the tissue homogenates, then vortexed and centrifuged for 10min at 12000×g (4°C). Total RNA was extracted from the aqueous phase using Qiagen’s RNeasy mini spin column kits with DNase treatment on a QIAcube work station. RNA concentrations and purity were analyzed on a NanoDrop spectrophotometer (Thermo Scientific). cDNA was prepared on an Eppendorf Mastercycler using Applied Biosystems’ High Capacity Reverse Transcription Kit. The cDNA was used as template for real-time PCR reactions containing TaqMan PCR Master Mix with gene-specific primers (Applied Biosystems) on a 7500 Real-Time PCR System. Relative fold changes in gene expression (2−ΔΔCT) was determined compared with acetone controls unless otherwise indicated and normalized for expression of housekeeping gene Actb (mouse) or GAPDH (human).
LDH Release Assay
Lactate dehydrogenase (LDH) was measured in 10 μl of EpiDerm culture supernatants using BioVision’s LDH-Cytotoxicity Colorimetric Assay kit II. Absorbance (450 nm) was measured using a SpectraMax plate reader (Molecular Devices) with background subtraction.
Statistical Analyses
Statistical analyses were generated using SAS/STAT software, version 9.3 (SAS Institute). Data were analyzed with either 1-way (triclosan concentration) or 2-way (triclosan by day or immune parameter) analysis of variance using PROC MIXED. In some cases data were transformed using the natural log to meet the assumptions of the analysis. Significant interactions were explored utilizing the “slice” option in PROC MIXED, and pairwise differences were assessed using Fishers Least Significant Difference Test. Significant differences are indicated as P ≤ .05 (*), P ≤ .01 (**), P ≤ .001 (***), and P ≤ .0001 (****).
RESULTS
Kinetic Changes in Cytokine Expression in Skin Tissue With Repeated Triclosan Exposure
For these studies, triclosan was applied at 0.75% or 3% in acetone to the dorsal surface of both ear pinnae of BALB/c mice every 24 h for up to 12 days. These concentrations were previously found to enhance allergic responses in a mouse OVA asthma model (Anderson et al., 2012). The majority of mice dosed with 3% triclosan exhibited some mild skin irritation (Supplementary Fig. S1); these effects were typically observed after 4 days of repeated exposure, and peaked in severity after approximately 9 days. The skin of mice dosed with 0.75% triclosan generally appeared normal, however approximately 20% of the mice exhibited some mild skin irritation. Sections of ear pinnae from mice dosed with 3% triclosan (n=5) were further examined which revealed formation of epidermal keratocellular crust (4/5), keratosis (3/5), hyperplasia (5/5), subcorneal/superficial pustules (3/5), and dermal mixed inflammatory cell infiltrates (4/5). Histopathological changes associated with 0.75% triclosan were of minimal severity and lower incidence (1/5) than with 3%.
Next, we examined the cytokine expression kinetics in the skin tissue with repeated topical application of triclosan. To maintain consistency between studies, mice were also sensitized to OVA by intraperitoneal injection on Day 0 to help identify effects on antigen-specific responses. The histopathological effects of triclosan on the ear tissue were consistent regardless of OVA administration (Supplementary Fig. S2A). Dermal dosing was initiated on Day −2 thus the analyses shown for Days 2–10 reflect 4–12 days of repeat dosing, respectively. Changes in cytokine gene expression were first measured in the cDNA by realtime PCR which identified dose-dependent increases in the expression of Tslp, Il6, Il1b, and Tnfa with concomitant decreases in Il25 and Il33 (Supplementary Fig. S2). Soluble proteins were extracted from the ear tissue and found to increase by 3-fold in total protein concentrations by Day 10 after 3% dosing compared with controls (Fig. 1A). After normalizing total protein concentrations, TSLP was the only cytokine identified to increase significantly by Day 2 and remain increased (3%) (Fig. 1B). Although Tslp was upregulated 3-fold in the skin with 0.75% triclosan exposure (Supplementary Fig. S2), changes in TSLP protein expression were not significant. Inflammatory cytokines IL-1β and TNF-α were significantly increased by Day 7 (3%) which correlated with increased skin irritation. Conversely, IL-25, IL-33, and IL-1α expression were significantly decreased by Day 7 (3%). IL-22 was not detected in controls, but was detected at low concentrations with triclosan exposure. IL-4 was also detected by Day 10 along with small decreases in IL-2 (3%). Other cytokines below limits of detection included IFN-γ, GM-CSF, IL-5, IL-6, IL-10, and IL-17A. Increased TSLP, IL-1β, and TNF-α expression in concert with decreased IL-1α, IL-25, and IL-33 expression suggests a unique cytokine expression signature is induced in skin tissue with repeated triclosan exposure.
FIG. 1.
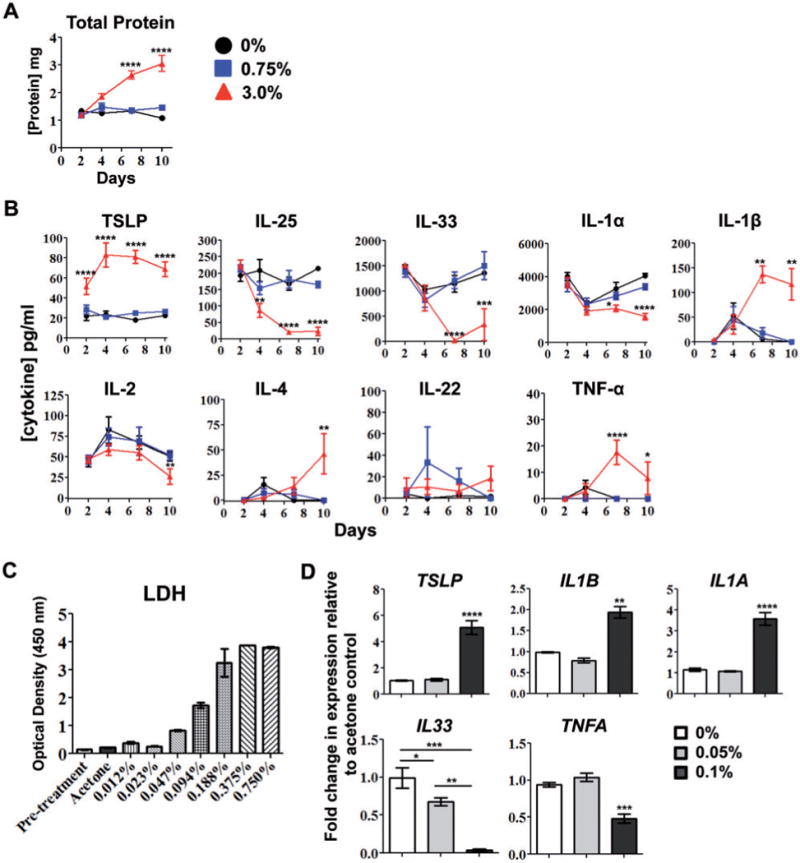
Kinetic changes in cytokine expression in skin tissue with repeated dermal triclosan exposure. Concentrations of soluble protein (A) and cytokines (B) extracted from the ear pinnae of OVA-sensitized mice after daily dosing with 0% (circle), 0.75% (square) or 3% (triangle) triclosan (n=6 mice). Data are representative of two independent time-course studies. LDH released into supernatants of EpiDerm tissues prior to (pretreatment) or after exposure to triclosan dissolved in acetone (n=3 wells) (C). Fold-change in gene expression relative to acetone control (0%) in EpiDerm tissues 24h after application of 0.05% or 0.1% triclosan (n=3 wells) (D). Data are representative of two independent studies utilizing different donor tissues. Bars represent the mean ± SEM, with statistical significance indicated as P ≤ .05 (*), P ≤ .01 (**), P ≤ .001 (***), and P ≤ .0001 (****).
Cytokine gene expression changes were then measured in a primary human skin tissue model (EpiDerm) after triclosan application. A range of 2-fold dilutions of triclosan were applied (0%–0.75%) and tissues were examined after 24h. Concentrations of triclosan ≥ 0.188% were toxic as measured by high lactate dehydrogenase (LDH) release (Fig. 1C) and poor RNA recovery (data not shown). At concentrations ≤ 0.094%, there were some increases in LDH release compared with acetone control, however RNA recovery was comparable thus the effects of triclosan were further assessed at concentrations between 0 and 0.1%. Interestingly, 24h after application of 0.1% triclosan, TSLP, and IL1B transcripts were upregulated 5-fold and 2-fold respectively (Fig. 1D). IL33 transcript was down-regulated in tissues exposed to both 0.1% and 0.05% triclosan. These results were consistent with the mouse ear tissue, but conversely, TNFA expression was decreased and IL1A was increased. The expression of IL6, IL22, and IL25 were below limits of detection.
Repeated Exposure to Triclosan Enhances Adaptive Immune Responses and Cytokine Expression in the Skin Draining LN
Next, the effects of triclosan on the skin draining LN were examined. There were significant dose-dependent increases in LN cellularity that peaked at Day 7 (Fig. 2A). Increased LN cellularity also occurred in non-OVA-sensitized mice dosed with triclosan (Supplementary Fig S2B). Further phenotypic analysis of the LN revealed a significant increase in the frequency of B cells across all time points (Fig. 2B). On Day 2 after OVA sensitization, there was a significant increase in the frequency of CD11bhigh MHC II+ DCs (3%) and dose-dependent increases in the numbers of B cells, CD4 T cells, CD8 T cells, and DCs that peaked at Day 7 (Fig. 2C). There were also significant increases in cytokine production by T cells from LN exposed to triclosan (Fig. 3A). By Day 2, IL-2, IFN-γ (0.75% and 3%) and IL-17A and IL-22 (3%) were significantly increased. By Day 4, IL-17A concentrations were also increased with 0.75% triclosan exposure. By Day 7, concentrations of IL-17A were still increased relative to controls; however significant increases in IL-4 (3%) and IL-13 (0.75% and 3%) emerged indicating a shift toward Th2 cytokine production. Other cytokines including IL-6, IL-10, IL-1α, and IL-21 were below limits of detection.
FIG. 2.
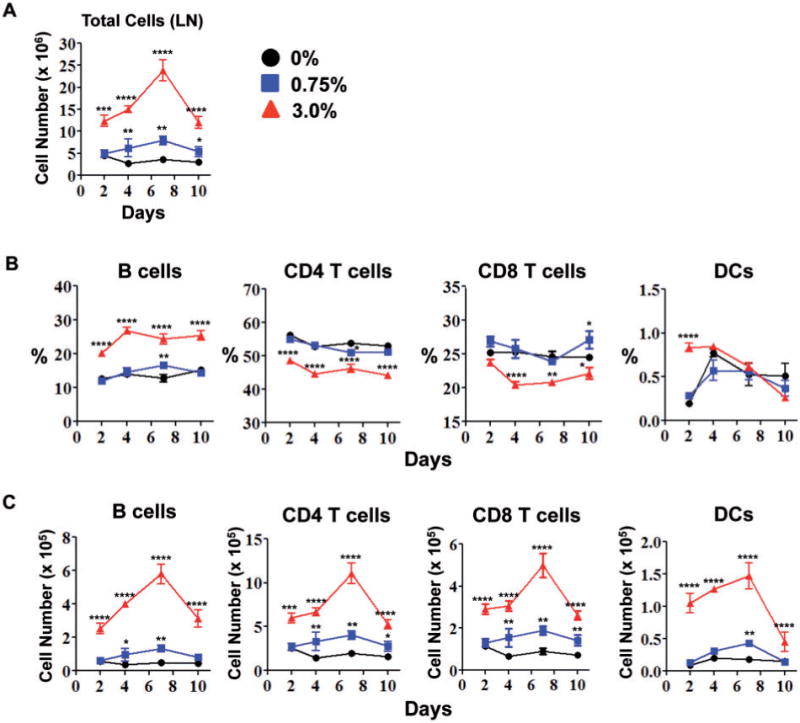
Repeated dermal exposure to triclosan promotes adaptive immune responses in the skin draining LN. Total number of LN cells (A), frequencies (B) and numbers (C) of specific leukocyte subsets in the LN of OVA-sensitized mice after daily dosing with 0% (circle), 0.75% (square) or 3% (triangle) triclosan (n=4 mice). Data are representative of 3 independent studies. Bars represent the mean ± SEM, with statistical significance indicated as P ≤ .05 (*), P ≤ .01 (**), P ≤ .001 (***), and P ≤ .0001 (****).
FIG. 3.
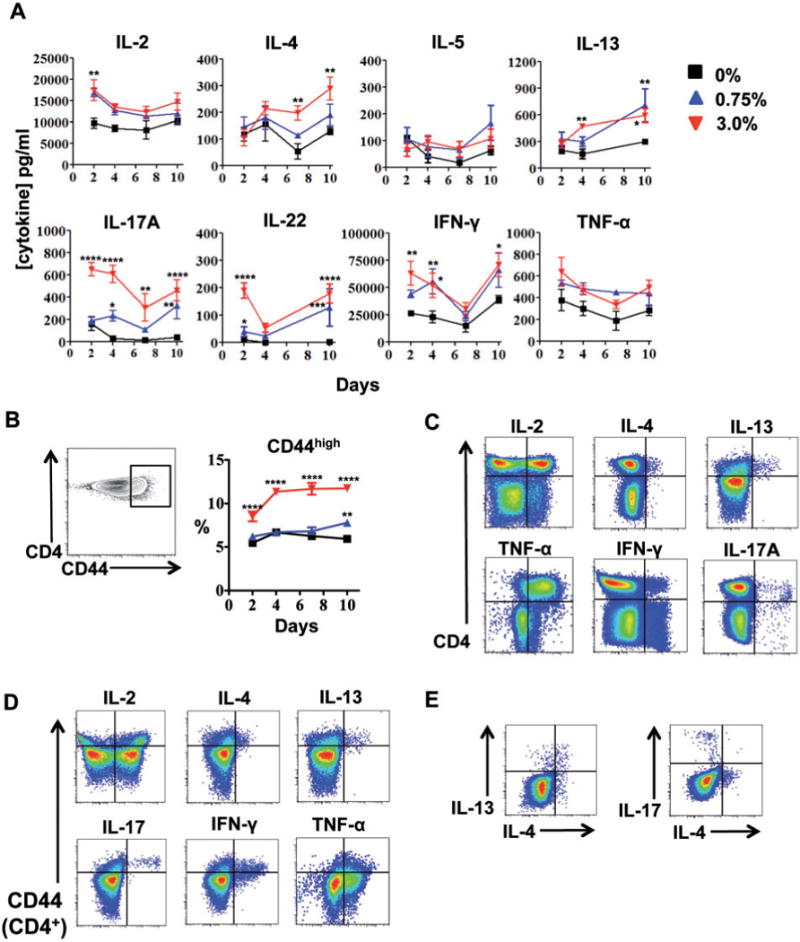
Repeated dermal exposure to triclosan augments cytokine production by activated LN CD4 T cells. Cytokine concentrations in LN cell supernatants (A) and percentage of LN CD4T cells expressing high levels of CD44 (B) from mice dosed daily with 0% (square), 0.75% (triangle) or 3.0% (inverted triangle) triclosan (n=4 mice) (A). Representative two-parameter histogram plots of LN CD4 T cell ICS staining from mice dosed daily with 3% triclosan and harvested Day 7 (C, D, E), versus CD44 expression (D) and in CD44+ CD4 T cells (E). Data are representative of 3 independent studies. Bars represent the mean ± SEM, with statistical significance indicated as P ≤ .05 (*), P≤ .01 (**), P≤ .001 (***), and P≤ .0001 (****).
Additional phenotyping of the LN CD4 T cells revealed a subset that expressed high levels of CD44 across all time points (3%) (Fig. 3B). These cells were also CCR7low and CD62Llow (data not shown) suggesting this polyclonal CD4 T cell population consisted of primary effectors and/or effector memory T cells that had emerged or were recruited to the site. Intracellular cytokine staining (ICS) revealed that CD4 T cells were the primary producers of cytokines detected in the supernatants including IL-4, IL-13, TNF-α, and IL-17A, with some production of IL-2 and IFN-γ (Fig. 3C). CD8 T cells were the primary producers of IFN-γ (data not shown). ICS staining for IL-5 and IL-22 expression was not sufficient to identify positive subsets. Examining co-expression of CD44 revealed the CD44high CD4 T cells were a major source of IL-4, IL-13, IL-17, and IFN-γ, whereas IL-2 and TNF-α were produced by CD44low and CD44high CD4 T cells (Fig. 2D). Interestingly, co-ICS staining revealed mutually exclusive IL-13+IL-4+ and IL-17+IL-4neg CD44high CD4 T cell subsets in the LN on Day 7 (Fig. 2E). Expression of IFN-γ, IL-2, and TNF-α was not unique to either of the 2 CD4 T cell subsets suggesting different functional roles for IL-17 and IL-4 in the responses to dermal triclosan exposure.
Dermal Exposure to Triclosan Promotes Th2 Responses in LN
Next, expression of transcription factors associated with different effector CD4 T cell subsets were measured including T-bet (Th1), GATA-3 (Th2), and ROR-γt (Th17). This revealed a CD4 T cell subset that expressed high levels of GATA-3 (Fig. 4A). The mean fluorescence intensity (MFI) of GATA-3 expression in LN CD4 T cells was dose-dependently increased on Day 4 with triclosan exposure (Fig. 4B) and the GATA-3high subset was not found in the spleen or in other peripheral LN (Fig. 4C). The GATA-3high CD4 T cells also expressed OX40 which was increased both as a percentage of cells (0.75% and 3%) and MFI (3%) in both OVA-sensitized and nonsensitized mice (Fig. 4D and E, Supplementary Fig. S2C). Ox40l transcript was also detected in the LN and found to be increased 2-fold with 3% triclosan exposure although changes in protein expression were not detected (data not shown). It should also be noted that changes in Foxp3 (Treg) and Bcl-6 (TFH) populations were unremarkable.
FIG. 4.
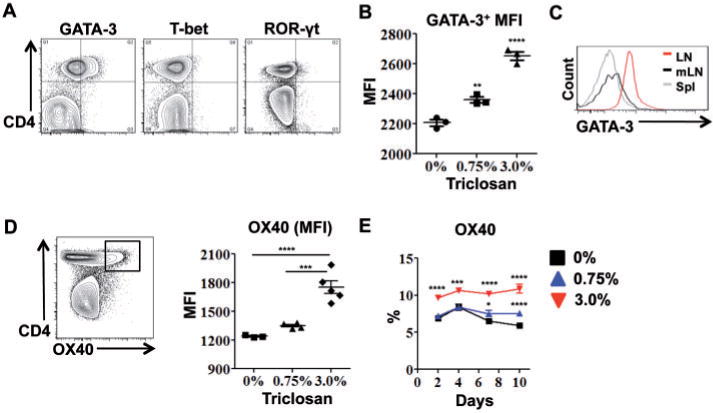
Dermal exposure to triclosan promotes Th2 responses in the LN. Representative two-parameter histogram plots of LN CD4 T cell ICS staining from OVA-sensitized mice dosed with 3% triclosan and harvested Day 7 (A) or Day 4 (n=3 mice) (B). GATA-3 expression in CD4 T cells from superficial cervical LN (LN), mesenteric LN (mLN) or spleen (Spl) on Day 7 (C). OX40 MFI on LN CD4 T cells Day 7 and percentage of LN CD4 T cells expressing OX40 after daily dosing with 0% (square), 0.75% (triangle) or 3% (inverted triangle) triclosan (n=4–5 mice) (E). Data are representative of 3 independent studies. Bars represent the mean ± SEM, with statistical significance indicated as P ≤ .05 (*), P ≤ .01 (**), P ≤ .001 (***), and P ≤ .0001 (****).
We postulated that CD4 T cells with known antigen specificity could be influenced by triclosan and skewed towards a Th2 phenotype in vivo. OVA-specific CD4 T cells (KJ126+) were adoptively transferred from transgenic DO11.10 mice into BALB/c mice that were then sensitized to OVA and dosed dermally with triclosan. KJ126+ CD4 T cells identified in the spleen and LN were CD44+ and consisted of 2% of the CD4 T cells on Day 4 after sensitization (Fig. 5A). The numbers of KJ126+ CD4 T cells in both tissues also peaked at Day 4 with significantly more in the LN of mice exposed to 3% triclosan (Fig. 5B). Interestingly, on Day 2 there was a transient dose-dependent increase in the GATA-3 MFI in LN KJ126+ CD4 T cells that was not observed in the spleen (Fig. 5C). Thus CD4 T cells responding to OVA could be further skewed towards a Th2 phenotype when influenced by dermal triclosan exposure.
FIG. 5.
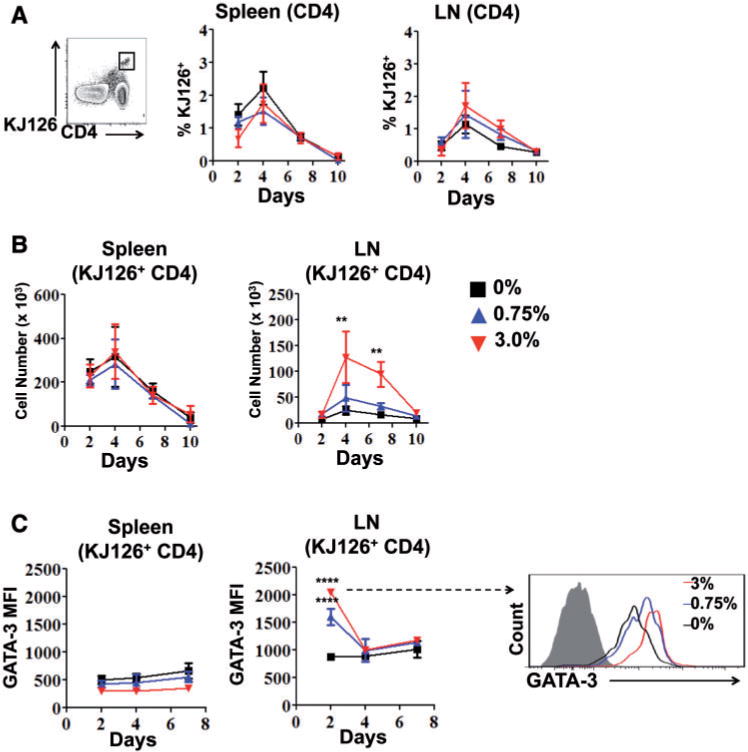
Dermal exposure to triclosan promotes OVA-specific Th2 responses in the LN. CD4 T cells from DO11.10 mice (KJ126+) adoptively transferred into BALB/c mice as a percentage of total CD4 T cells (A), and number (B) in the spleen and LN with 0% (square), 0.75% (triangle) or 3% (inverted triangle) daily triclosan dosing (n=4 mice). GATA-3 MFI of KJ126+ LN or spleen CD4 T cells and representative overlay histogram of GATA-3 expression in KJ126+ LN CD4 T cell on Day 2 (C). Data are representative of two independent studies. Bars represent the mean ± SEM, with statistical significance indicated as P ≤ .05 (*), P ≤ .01 (**), P ≤ .001 (***), and P ≤ .0001 (****).
Dermal Exposure to Triclosan Enhances the Expression of Activation Markers on APCs in the LN
Significant increases in the numbers of B cells and DCs in the LN suggested that triclosan may also affect their expression of activation markers. Dose-dependent increases in the percentage of DCs that expressed CD80 and CD86 were observed after 4 days of repeated triclosan exposure (Fig. 6A). CD40 was also expressed by the DCs however expression was not different (data not shown). There was also a dose-dependent increase in the percentage of B cells expressing CD86 that increased dramatically by Day 4 and remained increased (Fig. 6B). The MFI of GL-7 expression, a marker for germinal center B cells, was also significantly increased by Day 9 (3%) (Fig. 6C). These effects on APCs were not observed for any time-point in the spleen.
FIG. 6.
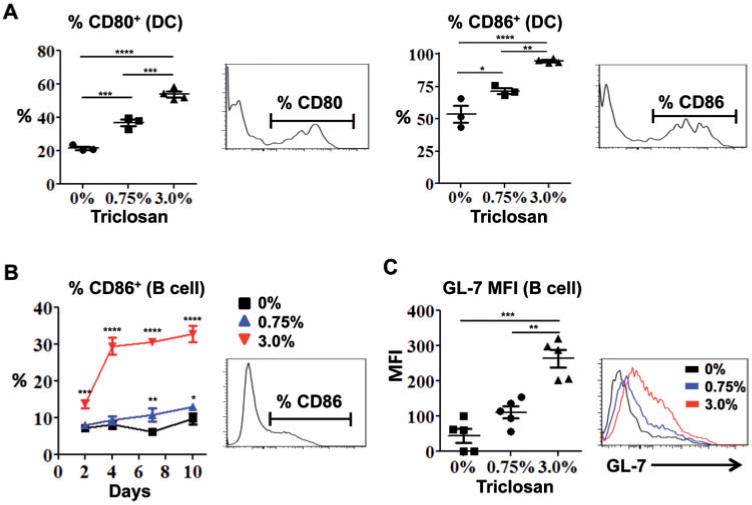
Dermal exposure to triclosan increases the expression of activation markers on antigen presenting cells in the LN. Frequencies of CD80+ and CD86+ LN DCs from OVA-sensitized mice after 4 days of triclosan dosing (A) and frequency of CD86+ LN B cells in mice dosed daily with 0% (square), 0.75% (triangle) or 3% (inverted triangle) triclosan (B) (n=3–4 mice). GL-7 staining MFI and overlay histogram for LN B cells on Day 9 (C) (n=5 mice). Each data point reflects analyses of the LN from an individual mouse (A, B, C). Data are representative of 3 independent studies. Bars represent the mean ± SEM, with statistical significance indicated as P ≤ .05 (*), P ≤ .01 (**), P ≤ .001 (***), and P ≤ .0001 (****).
In Vivo Antibody Blockade of TSLP Impairs Allergic Responses in the Skin and LN Augmented by Triclosan
TSLP is established to play an important role in allergic Th2 responses. After measuring early and sustained TSLP expression in the skin tissue, we employed a neutralizing antibody to determine the role of TSLP in the effects of dermal triclosan exposure. Mice were dosed with 0% or 3% triclosan and injected with anti-TSLP or isotype control antibodies at 3 day intervals as outlined in Figure 7A. On Day 7, evaluation of ear pinnae tissue sections revealed that anti-TSLP treatment (200 μg) reduced the histopathological effects observed with 3% triclosan exposure including decreased hyperplasia and inflammatory cell infiltrate (Fig. 7B). Little to no TSLP protein was detected in the ear tissue of mice dosed with 3% triclosan and injected with anti-TSLP (400 μg) (Fig. 7C); however at the transcript level, Tslp was increased 2-fold compared with isotype controls which may indicate a positive feedback loop for TSLP expression (Supplementary Fig. S4A). The lack of TSLP protein detection by sandwich ELISA was likely due in part to interference by the injected anti-TSLP antibody present in the ear tissue lysates. IL-1β protein expression was also significantly decreased with anti-TSLP treatment, but no significant changes were observed for IL-1α, IL-22, IL-25, IL-33, or TNF-α transcript and protein (Fig. 7C, Supplementary Fig. S4). Il4 transcript, only detected in the 3% group, was decreased by half with anti-TSLP treatment (Supplementary Fig. S4B).
Next, we examined the effects of blocking TSLP activity on the LN. With anti-TSLP treatment, there was a significant decrease in the total number of LN cells with 3% dosing (Fig. 8A), including significant decreases in the numbers of B cells and DCs (Fig. 8B). Although the number of T cells was not different, there was a significant decrease in the GATA-3 MFI with anti-TSLP treatment (Fig. 8C). The MFI of OX40 expression was also decreased with anti-TSLP treatment but was not significant (P=.08). A significant decrease in the frequency of CD44high CD4 T cells which, albeit small, was repeatable with anti-TSLP treatment (Fig. 8C). Anti-TSLP treatment also induced significant increases in TNF-α and significant decreases in IL-5 production by LN T cells with no effects on IL-22, IL-17A, IL-2, or IFN-γ (Fig. 8D). Changes in cytokine gene transcript expression also revealed greater than 2-fold decreases in Il4 and Il13 in LN cells with anti-TSLP treatment (Fig. 8E). The results of blocking TSLP activity in vivo suggests TSLP plays an important role in augmenting Th2 allergic responses with triclosan exposure. The molecular and cellular changes we observed in the skin tissue and draining LN with dermal triclosan exposure are collectively summarized in an illustration (Fig. 9).
FIG. 8.
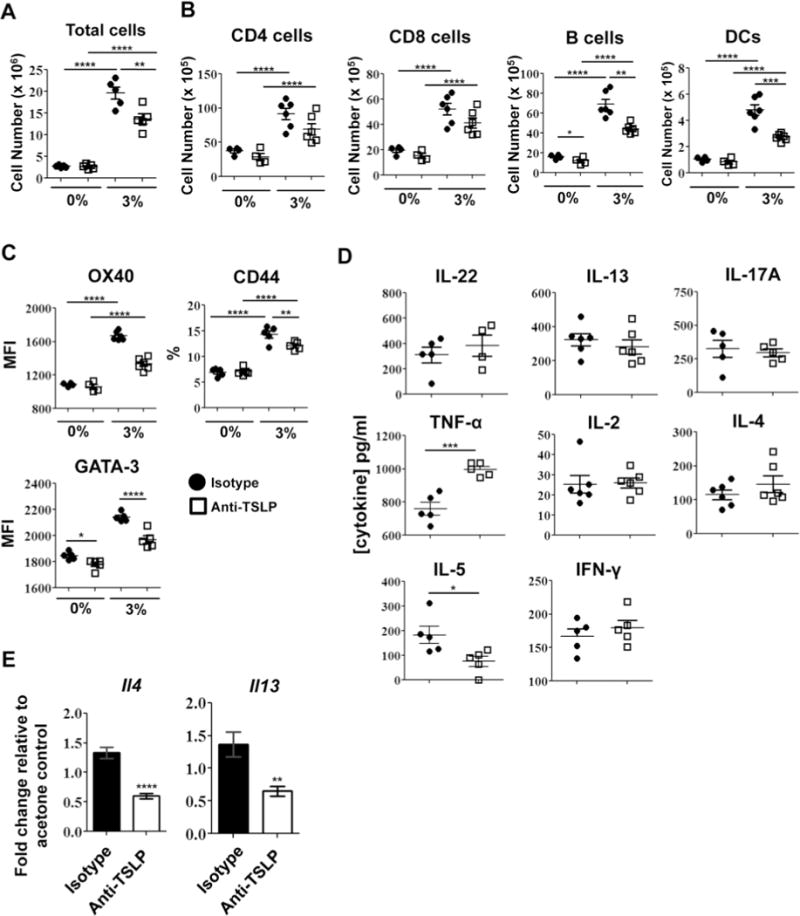
In vivo antibody blockade of TSLP impairs allergic responses in the LN augmented by triclosan. The total number of LN cells (A), numbers of leukocyte subsets (B) and proteins expressed by LN CD4 T cells (C) on Day 7 from mice dosed with 0% or 3% triclosan and co-treated with anti-TSLP (square) or isotype control (circle) (n=4–6 mice). Cytokine concentrations in supernatants collected from the LN cells stimulated for 24h (D). Fold changes in cytokine gene expression in LN cDNA relative to 0% control (E). Data are representative of two independent studies. Bars represent the mean ± SEM, with statistical significance indicated as P ≤ .05 (*), P ≤ .01 (**), P ≤ .001 (***), and P ≤ .0001 (****).
FIG. 9.
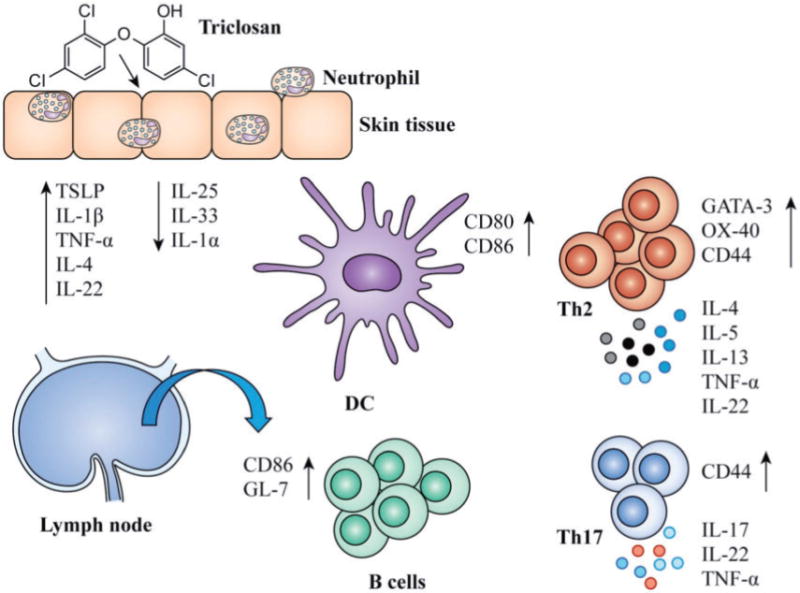
Summary of the effects of dermal triclosan exposure on the skin and LN. A schematic representation of the effects of repeated dermal triclosan exposure on gene expression and cellularity in the skin and LN.
DISCUSSION
As the prevalence of allergic disease continues to rise in Westernized countries (Graham-Rowe, 2011), the roles of lifestyle factors including exposures to chemicals in products that we use at home and the workplace are under increasing scrutiny. Triclosan is ubiquitous, detected in >75% of individuals in the United States (Calafat, et al., 2008) and over 50% of U.S. waterways (Kolpin et al., 2002). Although not classified as a chemical sensitizer, there have been increasing reports associating triclosan exposure and allergic disease (Anderson, et al., 2012; Bertelsen, et al., 2013; Clayton, et al., 2011; Savage, et al., 2014; Savage, et al., 2012; Spanier, et al., 2014). Here we show that topical application of triclosan induces expression of TSLP, IL-1β, and TNF-α in skin tissue of BALB/c mice. TSLP is expressed by different cell types including epithelial cells, keratinocytes and DCs (Ziegler et al., 2013) and is induced as an integral part of cellular and immune responses to skin barrier damage (Angelova-Fischer et al., 2010; Oyoshi et al., 2010). In primary human EpiDerm skin tissues, we also found increases in TSLP and IL1B transcripts with decreased expression of IL33 suggesting dermal triclosan exposure can act directly on keratinocytes to alter cytokine expression. Similar results were also obtained after treating EpiDerm skin tissues from a second donor (data not shown). In contrast with the intact mouse skin tissues, we identified a decrease in TNFA expression and an increase in IIL1A expression in the cultured tissues with triclosan exposure. The lack of inflammatory cell infiltrate in the EpiDerm tissue compared with the intact mouse skin tissue may account for these differences as infiltrating cells can produce and/or regulate cytokine expression in the skin. Curiously, there was a very small range of triclosan concentrations that produced measurable biological effects in the EpiDerm tissue system as little effects on gene expression were observed at 0.05% with marked toxicity at 0.2% by 24h. This observation, along with the potential for donor variability highlights the limitations of using this model system for studies of dermal triclosan exposure.
In vivo, TSLP was found to play an important role in augmenting allergic responses with dermal triclosan exposure. Through the use of in vivo antibody blockade, we found that TSLP promoted inflammatory responses in the skin tissue including IL-1β expression. In the LN, TSLP promoted the development and/or recruitment of activated DCs, B cells, and Th2 cells. OVA-specific KJ126+ CD4 T cells in the local LN were further skewed towards a Th2 phenotype with triclosan exposure as evidenced by dose-dependent increases in GATA-3 expression which may offer a potential mechanism for how triclosan augments allergic responses. The effects of triclosan on GATA-3 expression in KJ126+ cells in the LN was observed transiently on Day 2, whereas increases in GATA-3 expression in the endogenous polyclonal CD4 T cells was observed later on Day 4. Interestingly, the Th2 cells did not require sustained high levels of GATA-3 expression to later produce Th2 cytokines (IL-4 and IL-13) at Days 7 and 10.
The Th2 cell subset also expressed OX40 which is consistent with reports that TSLP activates DCs to prime Th2 cells (Soumelis et al., 2002) in part through OX40-OX40L interactions (Ito et al., 2005). OX40 is an important costimulatory molecule for promoting effector and memory T cell responses in allergic disease (Jember et al., 2001; Salek-Ardakani et al., 2003), including TSLP-mediated Th2 responses (Seshasayee et al., 2007). IL-4, IL-13, and TNF-α have also been shown to promote TSLP expression in mouse keratinocytes which may reinforce an allergic response feedback loop (Bogiatzi et al., 2007; Dewas et al., 2015). An IL-17A+ CD4 T cell subset was also identified in the LN that emerged early in the response. This subset was distinct from the IL-4+IL-13+ Th2 subset as determined by co-ICS staining. IL-17A production was not affected by antibody blockade of TSLP suggesting that the generation or recruitment of the IL-17A+ CD4 T cell subset is TSLP-independent and that other mechanisms could play a role in the early responses to dermal triclosan exposure.
TSLP also plays a pivotal role in promoting allergic responses to OVA in the lungs (Al-Shami et al., 2005; Zhou et al., 2005). For this reason, we were unable to use a systemic TSLP blockade approach to determine the role of TSLP in augmenting responses to OVA in the lung with dermal triclosan exposure as OVA-specific immune responses would be severely impaired in control mice. Treatment with anti-TSLP was recently shown to reduce allergen-induced bronchoconstriction and indexes of airway inflammation in asthmatic patients (Gauvreau et al., 2014) and responses in the lung to house dust mite antigen in mice (Chen et al., 2013). Intradermal administration of TSLP promoted the progression from atopic dermatitis to asthma (Han et al., 2012) and over-expression of TSLP in keratinocytes (Yoo et al., 2005) promotes allergic airway inflammation in mice (Demehri et al., 2009; Zhang et al., 2009). Thus increased TSLP expression in skin tissue induced by repeated dermal triclosan exposure may also promote augmented allergic responses in the lung.
Mice dosed with 3% triclosan exhibited skin irritation that peaked in severity after 9 days of exposure. Similarly, individuals that used 2% triclosan hand washing cream (Ayliffe et al., 1988) and 25% of subjects who used a 2% triclosan soap reported irritation of the skin (Bendig, 1990). Studies of repeated dermal triclosan exposure with B6C3F1 (B6) mice describe similar skin irritation that occurred as early as Day 4 (Fang et al., 2014) and resolved by Day 28 (Anderson et al., 2015), likely due in part to the protection provided by the repaired skin. With repeated application of 0.75% triclosan, we observed little skin irritation, however significant effects still occurred in the skin and LN including increased expression of Tslp and Tnfa in the skin tissue, increases in cellularity of the skin draining LN, increased IL-4, IL-17A, IL-22, IFN-γ, and GATA-3 expression by CD4 T cells and increases in CD80 and CD86 expression on LN DCs and B cells. Thus topical application of triclosan produces measurable immunomodulatory effects even in the absence of overt skin irritation which is important to consider as triclosan is incorporated into products within a range of 0.1–1%.
The mechanism of action of triclosan, particularly at lower concentrations, is targeted inhibition of the Fab I gene of the bacterial type II fatty acid synthesis pathway which reduces bacterial viability (Heath et al., 1999; Levy et al., 1999; McMurry et al., 1998). The effects of triclosan on host microbial flora (microbiome) has not yet been well described; however, data are emerging that suggest disruption of the microbiome can play a role in allergic disease (Hoskin-Parr et al., 2013; Kong et al., 2012). Interestingly, mice housed in a germ-free (GF) environment were found to express significantly higher levels of TSLP in their skin compared with those housed in specific pathogen-free conditions (Yockey et al., 2013). Asthma and allergies have a complex etiology determined by a combination of host genetic and environmental factors. TSLP could be a relevant biomarker in skin tissue for identifying chemicals with potential immunomodulatory health effects like triclosan. With increasing evidence of health effects resulting from exposures to antimicrobial chemicals, we must continue to carefully consider how best to balance infection control practices with the potential health risks associated with overuse of antimicrobial chemicals to protect healthcare workers and the general population.
Supplementary Material
Acknowledgments
The findings and conclusions in this report are those of the author and do not necessarily represent the views of the National Institute for Occupational Safety and Health, Centers for Disease Control and Prevention.
FUNDING:
This work was supported by National Institute for Occupational Safety and Health intramural funding (CAN number 927ZLCU).
Footnotes
SUPPLEMENTARY DATA
Supplementary data are available online at http://toxsci.oxfordjournals.org/.
References
- Al-Shami A, Spolski R, Kelly J, Keane-Myers A, Leonard WJ. A role for TSLP in the development of inflammation in an asthma model. J Exp Med. 2005;202:829–839. doi: 10.1084/jem.20050199. [DOI] [PMC free article] [PubMed] [Google Scholar]
- Anderson SE, Franko J, Kashon ML, Anderson KL, Hubbs AF, Lukomska E, Meade BJ. Exposure to Triclosan Augments the Allergic Response to Ovalbumin in a Mouse Model of Asthma. Toxicol Sci Off J Soc Toxicol. 2012;132:96–106. doi: 10.1093/toxsci/kfs328. [DOI] [PMC free article] [PubMed] [Google Scholar]
- Anderson SE, Meade BJ, Long CM, Lukomska E, Marshall NB. Investigations of immunotoxicity and allergic potential induced by topical application of triclosan in mice. J Immunotoxicol. 2015:1–8. doi: 10.3109/1547691x.2015.1029146. [DOI] [PMC free article] [PubMed] [Google Scholar]
- Angelova-Fischer I, Fernandez IM, Donnadieu MH, Bulfone-Paus S, Zillikens D, Fischer TW, Soumelis V. Injury to the stratum corneum induces in vivo expression of human thymic stromal lymphopoietin in the epidermis. J Invest Dermatol. 2010;130:2505–2507. doi: 10.1038/jid.2010.143. [DOI] [PubMed] [Google Scholar]
- Ayliffe GA, Babb JR, Davies JG, Lilly HA. Hand disinfection: a comparison of various agents in laboratory and ward studies. J Hospital Infect. 1988;11:226–243. doi: 10.1016/0195-6701(88)90101-6. [DOI] [PubMed] [Google Scholar]
- Bendig JW. Surgical hand disinfection: comparison of 4% chlorhexidine detergent solution and 2% triclosan detergent solution. J Hospital Infect. 1990;15:143–148. doi: 10.1016/0195-6701(90)90123-6. [DOI] [PubMed] [Google Scholar]
- Bertelsen RJ, Longnecker MP, Lovik M, Calafat AM, Carlsen KH, London SJ, Lodrup Carlsen KC. Triclosan exposure and allergic sensitization in Norwegian children. Allergy. 2013;68:84–91. doi: 10.1111/all.12058. [DOI] [PMC free article] [PubMed] [Google Scholar]
- Bogiatzi SI, Fernandez I, Bichet JC, Marloie-Provost MA, Volpe E, Sastre X, Soumelis V. J Immunol. Vol. 178. Baltimore, Md: 2007. 1950. Cutting Edge: proinflammatory and Th2 cytokines synergize to induce thymic stromal lymphopoietin production by human skin keratinocytes; pp. 3373–3377. [DOI] [PubMed] [Google Scholar]
- Calafat AM, Ye X, Wong LY, Reidy JA, Needham LL. Urinary concentrations of triclosan in the U.S. population: 2003–2004. Environ Health Perspect. 2008;116:303–307. doi: 10.1289/ehp.10768. [DOI] [PMC free article] [PubMed] [Google Scholar]
- Chen ZG, Zhang TT, Li HT, Chen FH, Zou XL, Ji JZ, Chen H. Neutralization of TSLP inhibits airway remodeling in a murine model of allergic asthma induced by chronic exposure to house dust mite. PloS One. 2013;8:e51268. doi: 10.1371/journal.pone.0051268. [DOI] [PMC free article] [PubMed] [Google Scholar]
- Clayton EM, Todd M, Dowd JB, Aiello AE. The impact of bisphenol A and triclosan on immune parameters in the U.S. population, NHANES 2003–2006. Environ Health Perspect. 2011;119:390–396. doi: 10.1289/ehp.1002883. [DOI] [PMC free article] [PubMed] [Google Scholar]
- Demehri S, Morimoto M, Holtzman MJ, Kopan R. Skin-derived TSLP triggers progression from epidermal-barrier defects to asthma. PLoS Biol. 2009;7:e1000067. doi: 10.1371/journal.pbio.1000067. [DOI] [PMC free article] [PubMed] [Google Scholar]
- Dewas C, Chen X, Honda T, Junttila I, Linton J, Udey MC, Porcella SF, Sturdevant DE, Feigenbaum L, Koo L, et al. TSLP Expression: Analysis with a ZsGreen TSLP Reporter Mouse. J Immunol. 2015;194:1372–1380. doi: 10.4049/jimmunol.1400519. [DOI] [PMC free article] [PubMed] [Google Scholar]
- Fang JL, Vanlandingham M, da Costa GG, Beland FA. Absorption and metabolism of triclosan after application to the skin of B6C3F1 mice. Environ Toxicol. 2014 doi: 10.1002/tox.22074. [DOI] [PubMed] [Google Scholar]
- Gauvreau GM, O’Byrne PM, Boulet LP, Wang Y, Cockcroft D, Bigler J, FitzGerald JM, Boedigheimer M, Davis BE, Dias C, et al. Effects of an anti-TSLP antibody on allergen-induced asthmatic responses. N Engl J Med. 2014;370:2102–2110. doi: 10.1056/NEJMoa1402895. [DOI] [PubMed] [Google Scholar]
- Graham-Rowe D. Lifestyle: When allergies go west. Nature. 2011;479:S2–S4. [Google Scholar]
- Han H, Xu W, Headley MB, Jessup HK, Lee KS, Omori M, Comeau MR, Marshak-Rothstein A, Ziegler SF. Thymic stromal lymphopoietin (TSLP)-mediated dermal inflammation aggravates experimental asthma. Mucosal Immunol. 2012;5:342–351. doi: 10.1038/mi.2012.14. [DOI] [PMC free article] [PubMed] [Google Scholar]
- Heath RJ, Rubin JR, Holland DR, Zhang E, Snow ME, Rock CO. Mechanism of triclosan inhibition of bacterial fatty acid synthesis. J Biol Chem. 1999;274:11110–11114. doi: 10.1074/jbc.274.16.11110. [DOI] [PubMed] [Google Scholar]
- Hoskin-Parr L, Teyhan A, Blocker A, Henderson AJ. Antibiotic exposure in the first two years of life and development of asthma and other allergic diseases by 7.5 yr: a dose-dependent relationship. Pediatric Allergy Immunol Off Publ Eur Soc Pediatric Allergy Immunol. 2013;24:762–771. doi: 10.1111/pai.12153. [DOI] [PMC free article] [PubMed] [Google Scholar]
- Ito T, Wang YH, Duramad O, Hori T, Delespesse GJ, Watanabe N, Qin FX, Yao Z, Cao W, Liu YJ. TSLP-activated dendritic cells induce an inflammatory T helper type 2 cell response through OX40 ligand. J Exp Med. 2005;202:1213–1223. doi: 10.1084/jem.20051135. [DOI] [PMC free article] [PubMed] [Google Scholar]
- Jember AG, Zuberi R, Liu FT, Croft M. Development of allergic inflammation in a murine model of asthma is dependent on the costimulatory receptor OX40. J Exp Med. 2001;193:387–392. doi: 10.1084/jem.193.3.387. [DOI] [PMC free article] [PubMed] [Google Scholar]
- Kolpin DW, Furlong ET, Meyer MT, Thurman EM, Zaugg SD, Barber LB, Buxton HT. Pharmaceuticals, hormones, and other organic wastewater contaminants in U.S. streams, 1999–2000: a national reconnaissance. Environ Sci Technol. 2002;36:1202–1211. doi: 10.1021/es011055j. [DOI] [PubMed] [Google Scholar]
- Kong HH, Oh J, Deming C, Conlan S, Grice EA, Beatson MA, Nomicos E, Polley EC, Komarow HD, Murray PR, et al. Temporal shifts in the skin microbiome associated with disease flares and treatment in children with atopic dermatitis. Genome Res. 2012;22:850–859. doi: 10.1101/gr.131029.111. [DOI] [PMC free article] [PubMed] [Google Scholar]
- Lachapelle JM, Tennstedt D. Low allergenicity of triclosan. Predictive testing in guinea pigs and in humans. Dermatologica. 1979;158:379–383. [PubMed] [Google Scholar]
- Levy CW, Roujeinikova A, Sedelnikova S, Baker PJ, Stuitje AR, Slabas AR, Rice DW, Rafferty JB. Molecular basis of triclosan activity. Nature. 1999;398:383–384. doi: 10.1038/18803. [DOI] [PubMed] [Google Scholar]
- MacIsaac JK, Gerona RR, Blanc PD, Apatira L, Friesen MW, Coppolino M, Janssen S. Health care worker exposures to the antibacterial agent triclosan. J Occupat Environ Med Am College Occupat Environ Med. 2014;56:834–839. doi: 10.1097/JOM.0000000000000183. [DOI] [PMC free article] [PubMed] [Google Scholar]
- McMurry LM, Oethinger M, Levy SB. Triclosan targets lipid synthesis. Nature. 1998;394:531–532. doi: 10.1038/28970. [DOI] [PubMed] [Google Scholar]
- Oyoshi MK, Larson RP, Ziegler SF, Geha RS. Mechanical injury polarizes skin dendritic cells to elicit a T(H)2 response by inducing cutaneous thymic stromal lymphopoietin expression. J Allergy Clin Immunol. 2010;126:976–984. 984 e1–5. doi: 10.1016/j.jaci.2010.08.041. [DOI] [PMC free article] [PubMed] [Google Scholar]
- Salek-Ardakani S, Song J, Halteman BS, Jember AG, Akiba H, Yagita H, Croft M. OX40 (CD134) controls memory T helper 2 cells that drive lung inflammation. J Exp Med. 2003;198:315–324. doi: 10.1084/jem.20021937. [DOI] [PMC free article] [PubMed] [Google Scholar]
- Savage JH, Matsui EC, Wood RA, Keet CA. Urinary levels of triclosan and parabens are associated with aeroallergen and food sensitization. J Allergy Clin Immunol. 2012;130:453–460 e7. doi: 10.1016/j.jaci.2012.05.006. [DOI] [PMC free article] [PubMed] [Google Scholar]
- Savage JH, Johns CB, Hauser R, Litonjua AA. Urinary triclosan levels and recent asthma exacerbations. Anna Allergy Asthma Immunol Off Publ Am College Allergy Asthma Immunol. 2014;112:179–181 e2. doi: 10.1016/j.anai.2013.11.017. [DOI] [PubMed] [Google Scholar]
- Seshasayee D, Lee WP, Zhou M, Shu J, Suto E, Zhang J, Diehl L, Austin CD, Meng YG, et al. In vivo blockade of OX40 ligand inhibits thymic stromal lymphopoietin driven atopic inflammation. J Clin Invest. 2007;117:3868–3878. doi: 10.1172/JCI33559. [DOI] [PMC free article] [PubMed] [Google Scholar]
- Soumelis V, Reche PA, Kanzler H, Yuan W, Edward G, Homey B, Gilliet M, Ho S, Antonenko S, Lauerma A, et al. Human epithelial cells trigger dendritic cell mediated allergic inflammation by producing TSLP. Nat Immunol. 2002;3:673–680. doi: 10.1038/ni805. [DOI] [PubMed] [Google Scholar]
- Spanier AJ, Fausnight T, Camacho TF, Braun JM. The associations of triclosan and paraben exposure with allergen sensitization and wheeze in children. Allergy Asthma Proc Off J Regional State Allergy Soc. 2014;35:475–481. doi: 10.2500/aap.2014.35.3803. [DOI] [PMC free article] [PubMed] [Google Scholar]
- Yockey LJ, Demehri S, Turkoz M, Turkoz A, Ahern PP, Jassim O, Manivasagam S, Kearney JF, Gordon JI, Kopan R. The absence of a microbiota enhances TSLP expression in mice with defective skin barrier but does not affect the severity of their allergic inflammation. J Invest Dermat. 2013;133:2714–2721. doi: 10.1038/jid.2013.228. [DOI] [PMC free article] [PubMed] [Google Scholar]
- Yoo J, Omori M, Gyarmati D, Zhou B, Aye T, Brewer A, Comeau MR, Campbell DJ, Ziegler SF. Spontaneous atopic dermatitis in mice expressing an inducible thymic stromal lymphopoietin transgene specifically in the skin. J Exp Med. 2005;202:541–549. doi: 10.1084/jem.20041503. [DOI] [PMC free article] [PubMed] [Google Scholar]
- Zhang Z, Hener P, Frossard N, Kato S, Metzger D, Li M, Chambon P. Thymic stromal lymphopoietin overproduced by keratinocytes in mouse skin aggravates experimental asthma. Proc Natl Acad Sci USA. 2009;106:1536–1541. doi: 10.1073/pnas.0812668106. [DOI] [PMC free article] [PubMed] [Google Scholar]
- Zhou B, Comeau MR, De Smedt T, Liggitt HD, Dahl ME, Lewis DB, Gyarmati D, Aye T, Campbell DJ, Ziegler SF. Thymic stromal lymphopoietin as a key initiator of allergic airway inflammation in mice. Nat Immunol. 2005;6:1047–1453. doi: 10.1038/ni1247. [DOI] [PubMed] [Google Scholar]
- Ziegler SF, Roan F, Bell BD, Stoklasek TA, Kitajima M, Han H. The biology of thymic stromal lymphopoietin (TSLP) Adv Pharmacol. 2013;66:129–155. doi: 10.1016/B978-0-12-404717-4.00004-4. [DOI] [PMC free article] [PubMed] [Google Scholar]
Associated Data
This section collects any data citations, data availability statements, or supplementary materials included in this article.