In a canine model, free-breathing three-dimensional radial ultrashort echo time imaging of the lungs yields both higher accuracy for pulmonary embolism detection and significantly better image quality for small vessels and lung parenchyma than does breath-hold three-dimensional MR angiography.
Abstract
Purpose
To demonstrate the feasibility of free-breathing three-dimensional (3D) radial ultrashort echo time (UTE) magnetic resonance (MR) imaging in the simultaneous detection of pulmonary embolism (PE) and high-quality evaluation of lung parenchyma.
Materials and Methods
The institutional animal care committee approved this study. A total of 12 beagles underwent MR imaging and computed tomography (CT) before and after induction of PE with autologous clots. Breath-hold 3D MR angiography and free-breathing 3D radial UTE (1.0-mm isotropic spatial resolution; echo time, 0.08 msec) were performed at 3 T. Two blinded radiologists independently marked and graded all PEs on a four-point scale (1 = low confidence, 4 = absolutely certain) on MR angiographic and UTE images. Image quality of pulmonary arteries and lung parenchyma was scored on a four-point-scale (1 = poor, 4 = excellent). Locations and ratings of emboli were compared with reference standard CT images by using an alternative free-response receiver operating characteristic curve (AFROC) method. Areas under the curve and image quality ratings were compared by using the F test and the Wilcoxon signed-rank test.
Results
A total of 48 emboli were detected with CT. Both readers showed higher sensitivity for PE detection with UTE (83% and 79%) than with MR angiography (75% and 71%). The AFROC area under the curve was higher for UTE than for MR angiography (0.95 vs 0.89), with a significant difference in area under the curve of 0.06 (95% confidence interval: 0.01, 0.11; P = .018). UTE image quality exceeded that of MR angiography for subsegmental arteries (3.5 ± 0.7 vs 2.9 ± 0.5, P = .002) and lung parenchyma (3.8 ± 0.5 vs 2.2 ± 0.2, P < .001). The apparent signal-to-noise ratio in pulmonary arteries and lung parenchyma was significantly higher for UTE than for MR angiography (41.0 ± 5.2 vs 24.5 ± 6.2 [P < .001] and 10.2 ± 1.8 vs 3.5 ± 0.8 [P < .001], respectively). The apparent contrast-to-noise ratio between arteries and PEs was higher for UTE than for MR angiography (20.3 ± 5.2 vs 15.4 ± 6.7, P = .055).
Conclusion
In a canine model, free-breathing 3D radial UTE performs better than breath-hold 3D MR angiography in the detection of PE and yields better image quality for visualization of small vessels and lung parenchyma. Free-breathing 3D radial UTE for detection of PE is feasible and warrants evaluation in human subjects.
© RSNA, 2015
Introduction
Pulmonary embolism (PE) is an important clinical problem with a high mortality rate, especially when left undiagnosed (1,2). The first-line imaging modality for PE detection is computed tomographic (CT) angiography; however, up to 24% of patients have one or more relative contraindications for CT angiography (3,4). Additionally, there is a growing awareness of potential risks associated with ionizing radiation and increased CT angiography use, especially in young patients (5). Contrast material–enhanced magnetic resonance (MR) angiography is emerging as an attractive nonionizing alternative with which to detect PE (4,6–11).
However, because of the low proton density and fast signal decay in the lung parenchyma, breath-hold three-dimensional (3D) contrast-enhanced MR angiographic techniques have been unsuccessful in the simultaneous assessment of pulmonary vasculature and parenchyma and have yielded images of insufficient quality (12). MR angiography may be limited for diagnoses other than PE that may explain the patient’s symptoms.
Furthermore, the findings of the multicenter Prospective Investigation of Pulmonary Embolism Diagnosis III (or PIOPED III) study, which were published in 2010, showed sufficient image quality in only 75% of patients, mainly due to dyspnea, coughing, or faulty timing of contrast material administration (4). These problems were due to the breath-hold MR angiographic techniques; these require a long breath hold, which is particularly problematic for patients with dyspnea.
Ultrashort echo time (UTE) MR imaging has been used successfully for isotropic high-spatial-resolution morphologic lung imaging in small-animal studies (13–18). Previous studies in human subjects have used relatively thick-section two-dimensional UTE breath-hold sequences with limited spatial coverage (19–21). However, 3D radial UTE has several potential advantages over the two-dimensional approach. The 3D radial UTE technique can be used to obtain isotropic high-spatial-resolution images with full chest coverage and reduced sensitivity to motion due to repeated sampling of the center of k-space (22). In addition, respiratory gating obviates breath holding. For example, a recently developed free-breathing 3D radial UTE pulse sequence has shown great promise in the visualization of lung tissue in humans with full chest coverage, high signal-to-noise ratio (SNR), and isotropic high spatial resolution (23).
Evaluation of the free-breathing 3D radial UTE technique in both the detection of PE and the simultaneous evaluation of lung parenchyma has not been performed to date. The purpose of this study was to demonstrate the feasibility of using free-breathing 3D radial UTE MR imaging to simultaneously detect PE and perform high-quality evaluation of lung parenchyma.
Materials and Methods
Animal Model
Our institutional animal care committee approved the study. Twelve beagles (11 male, one female; mean weight, 9.7 kg ± 1.0 [standard deviation]) were examined with MR imaging and CT both before and after induction of PE. On day 1, thrombi were made by drawing 8 mL of blood, mixing it with bovine thrombin (King Pharmaceuticals, Bristol, Tenn), and allowing it to clot at 4°C in separate 1-mL syringes. On day 2, between three and six thrombi were injected into the right external jugular vein. On each day, CT imaging was performed before MR imaging. The animals were anesthetized and placed on mechanical ventilation prior to CT. The animals were euthanized after completion of the imaging experiments.
CT Angiography
CT angiography was performed by using a 64-section multidetector CT scanner (Discovery STE; GE Healthcare, Waukesha, Wis) within one breath hold with the following scanning parameters: 64 × 0.625 mm collimation, 100 kV, 69 mAs (effective), 0.5-second rotation time, and 1.4 pitch. Animals were placed in the supine position. Image acquisition was started manually by using fluoroscopic triggering when the contrast material arrived in the right ventricle. A total of 20 mL of iohexol (300 mg of iodine per milliliter) (Omnipaque 300; GE Healthcare, London, England) were injected by using a power injector (Stellant; MedRad, Warrendale, Pa) at a rate of 1.6 mL/sec followed by a 20-mL saline flush.
MR Imaging
MR imaging was performed with a 3-T imager (MR750; GE Healthcare) using 20 coils of a 32-channel chest phased-array receiver coil (NeoCoil, Pewaukee, Wis) centered on the thorax of each animal in the supine position.
Breath-hold contrast-enhanced 3D MR angiography was performed by using a heavily T1-weighted Cartesian spoiled gradient-echo acquisition with the following parameters: repetition time msec/echo time msec, 3.2/1.1; 28° flip angle; two-dimensional parallel acceleration factor, 3.72; 24 × 19 × 24 field of view; 1.3 × 1.8 × 2.0 mm spatial resolution; and 23-second total imaging time. This sequence was performed three times. It was performed first during contrast material injection and then twice more during delayed phase imaging. The last acquisition was performed at a lower flip angle of 15° (7). We used gadofosveset trisodium (0.03 mmol per kilogram of body weight, Ablavar; Lantheus Medical Imaging, North Billerica, Mass) diluted to a total volume of 30 mL with saline and injected at a rate of 1.5 mL/sec with a power injector (Spectris Solaris; MedRad). MR angiographic images were interpolated to 0.7 × 0.7 × 1.0 mm voxels through zero-filling prior to image analysis. Imaging time for each of the three breath-hold 3D MR angiographic acquisitions was 23 seconds. For brevity, we will use the term MR angiography to refer to this sequence.
The 3D radial UTE acquisition was performed immediately after MR angiography with the following parameters: 2.9/0.08, 1.32-msec readout time, 10° flip angle, 32-cm spherical field of view, 1.0-mm isotropic spatial resolution, and 50 000 total projections. A slab-selective radiofrequency excitation with a limited field of view, a variable-density readout gradient, and sampling during the readout at twice the Nyquist rate were used to improve image quality of the lung parenchyma (23). We used an adaptive respiratory gating method with a respiratory bellows signal (23,24). Total imaging time was 5–6 minutes, depending on respiratory rate. For brevity, we will use the term UTE to refer to this sequence.
Reference Method
CT angiography served as the reference standard in the detection of PE. Two radiologists (P.B., U.M.; 8 and 14 years of experience, respectively) localized PEs in consensus. These radiologists did not act as readers of MR angiographic or UTE images.
Detection of PEs
Two radiologists (C.J.F., M.L.S.; 14 and 33 years of experience, respectively) performed individual reading of MR angiography and UTE images. Images were read in a randomized blinded fashion in two separate reading sessions. Two weeks elapsed between reading of MR angiographic and UTE images of the same case to avoid recall bias.
Readers first scored each complete data set (MR angiography or UTE) as positive or negative for PE and ranked their confidence in the diagnosis on a four-point scale: a score of 1 indicated low confidence; a score of 2, moderate confidence; a score of 3, high confidence; and a score of 4, absolutely certain. Next, the readers identified all individual PEs and graded their confidence for each PE on the same four-point scale. Continuous filling defects that extended into branching vessels were regarded as a single embolus at the most proximal location (25).
The locations and ratings of the individual emboli given by the readers were compared with the true locations defined at the consensus CT angiography reading. Each marked embolus was classified as either a true-positive or a false-positive finding.
Qualitative Image Analyses
The same two readers (C.J.F., M.L.S.) also assessed image quality of the pulmonary arteries and lung parenchyma and the presence of artifacts. They scored the pulmonary arteries separately on lobar, segmental, and subsegmental levels with a four-point scale: a score of 1 indicated poor image quality (nondiagnostic); a score of 2, fair image quality (limited diagnostic value); a score of 3, good image quality (diagnostic); and a score of 4, excellent image quality (diagnostic with a high degree of confidence). The image quality of lung parenchyma was also graded on a four-point scale: a score of 1 indicated poor image quality, with no signal intensity (indistinguishable from air); a score of 2, fair image quality, with minimal signal intensity (barely distinguishable from air); a score of 3, good image quality (clearly distinguishable from air but lung fissures not visible); and a score of 4, excellent image quality (lung fissures were visible). The presence of artifacts that limited the detection of emboli was scored on a four-point scale: a score of 1 indicated severe artifacts (nondiagnostic); a score of 2, moderate artifacts (limited diagnosis); a score of 3, mild artifacts (little or no effect on diagnosis); and a score of 4, no artifacts.
Quantitative Image Analyses
Absolute SNRs and contrast-to-noise ratios (CNRs) could not be calculated because spatially varying noise due to parallel imaging (MR angiography) and radial undersampling (UTE) compromise accurate measurement of absolute SNR. Thus, we calculated apparent SNR and CNR, which provide a mixed metric of both stochastic noise and image artifacts.
To estimate apparent SNR, one blinded radiologist with 8 years of experience drew regions of interest in the left main pulmonary artery, adjacent lung parenchyma, and trachea for each MR angiographic (arterial phase) and UTE image data set. To minimize the influence from coil sensitivity, all regions of interest were placed equidistant to the anterior and posterior coil arrays. The signal intensity of the pulmonary arteries (SIartery) and lung parenchyma (SIparenchyma) along with the standard deviation of the signal intensity of air (SDair) were used to calculate the apparent SNR of pulmonary arteries (SNRarteries) and lung parenchyma (SNRparenchyma) as follows: SNRarteries = SIartery/SDair and SNRparenchyma = SIparenchyma/SDair.
To estimate apparent CNR between pulmonary arteries and PEs, the same radiologist drew additional regions of interest in the largest embolus (SIembolus) and an adjacent nonoccluded pulmonary artery (SInonoccluded artery) for each MR angiographic (arterial phase) and UTE image data set with PE. Both regions of interest were placed equidistant to the anterior and posterior coil arrays to minimize the influence from coil sensitivity. The apparent CNR was calculated as follows: CNR = (SInonoccluded artery – SIembolus)/SDair.
Statistical Analyses
To compare the diagnostic performance of UTE and MR angiography in the detection of PE, alternative free-response receiver operating characteristic curve (AFROC) analysis was performed (26–30). AFROC is a modified receiver operating characteristic curve technique that allows multiple responses and incorporates the location of lesions (28,30). Conventional receiver operating characteristic curve methods do not allow recording of multiple responses per image or differentiation between lesions on an image. AFROC curves for UTE and MR angiography were calculated by using the average of both readers’ scores and plotting the true-positive lesion localization fraction against the false-positive fraction. The AFROC area under the curve was used to compare the performance of UTE and MR angiography by calculating the difference between curves with 95% confidence intervals (CIs). These data were analyzed by using an analysis of variance model.
The per-embolus sensitivity for each observer and each technique was calculated by dividing the number of correctly identified emboli with high confidence (grade 3 or 4) by the total number of emboli. The positive predictive value for each reader was calculated. We were unable to calculate the specificity (percentage of true-negative findings) on a per-embolus basis because the number of vessel locations in the pulmonary vasculature that were negative for PE were uncountable.
Means and standard deviations of subjective image quality scoring were calculated for MR angiographic and UTE images for both readers and for the average of both readers. Differences in the subjective ratings between MR angiography and UTE were assessed by using the Wilcoxon signed-rank test. A κ value was calculated to assess interobserver variability. A κ value of 0.81–1.00 indicated excellent agreement; a κ value of 0.61–0.80, substantial agreement; a κ value of 0.41–0.60, moderate agreement; a κ value of 0.21–0.40, fair agreement; and a κ value of 0.00–0.20, slight agreement (31). Means and standard deviations of apparent SNR and CNR measurements were calculated, and differences were assessed by using a paired t test.
A P value of less than .05 indicated a significant difference. Statistical software (JAFROC 4.2.1; http://www.devchakraborty.com) was used to perform AFROC analyses. Other statistical computations and graphics were performed with MedCalc Statistical Software, version 12.7.5 (MedCalc Software, Ostend, Belgium).
Results
All CT and MR examinations were completed successfully. The time between CT and MR imaging was 30–50 minutes for all animals.
Reference Standard CT Angiographic Results
CT angiography revealed no PE in any of the animals on day 1 (preembolization). On day 2, after injection of clots, CT angiography revealed PE in 11 of 12 animals. In one animal, no PE was detected even though clots had been injected. Hence, 13 (52%) of 24 examinations yielded negative findings and 11 (46%) of 24 examinations yielded positive findings. A total of 48 PEs were detected in the 11 examinations with positive findings. The mean number of emboli in an animal with PE was 4.4 ± 1.4 (n = 1–7 emboli). The 48 emboli were located in proximal (n = 18, 38%), segmental (n = 21, 44%), and subsegmental (n = 9, 19%) pulmonary arteries.
Detection of PE with UTE and MR Angiography
Diagnostic accuracy on a per-subject basis.—Reader 1 correctly identified a PE in all 11 examinations with positive findings and correctly excluded PE in all 13 examinations with negative findings with both MR angiography and UTE. Hence, reader 1 had a sensitivity of 100% (11/11) and a specificity of 100% (13/13) for PE detection on a per-subject basis for both MR angiography and UTE.
Reader 2 detected a PE in all 11 UTE examinations with positive findings but missed a PE in one of the MR angiographic examinations with positive findings, resulting in one false-negative finding with MR angiography. Reader 2 correctly excluded PE in 12 of the 13 examinations negative for PE with both MR angiography and UTE, resulting in one false-positive finding with each method. Hence, for reader 2, sensitivity and specificity were 91% (10 of 11) and 92% (12 of 13), respectively, for MR angiography and 100% (11 of 11) and 92% (12 of 13), respectively, for UTE. The reader-averaged confidence score of UTE (3.8 ± 0.5) was higher than that for MR angiography (3.6 ± 0.6) (P = .034). The κ agreement of reader confidence scoring was moderate (0.47; 95% CI: 0.20, 0.73).
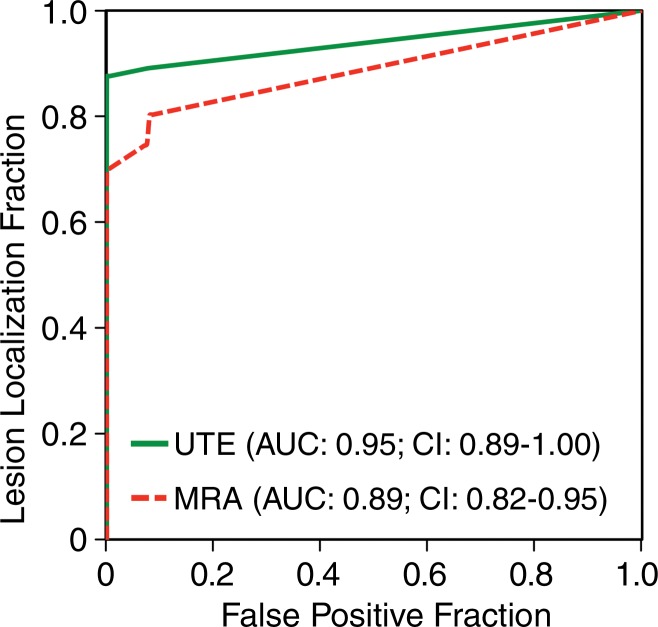
Sensitivity for PE on a per-embolus basis.—Figure 1 shows a PE that was detected by both readers on both MR angiographic and UTE studies. The observer-averaged AFROC curves for MR angiography and UTE are shown in Figure 2. The area under the curve was higher for UTE (0.95; 95% CI: 0.89, 1.00) than for MR angiography (0.89; 95% CI: 0.82, 0.95), with a significant difference in mean AUC of 0.06 (95% CI: 0.01, 0.11) (P = .018). At a confidence level of 3 or 4, both readers correctly identified more individual emboli with UTE (sensitivity, 83% [40 of 48] and 79% [38 of 48] for readers 1 and 2, respectively) than with MR angiography (sensitivity, 75% [36 of 48] and 71% [34 of 48], respectively).
Figure 1a:
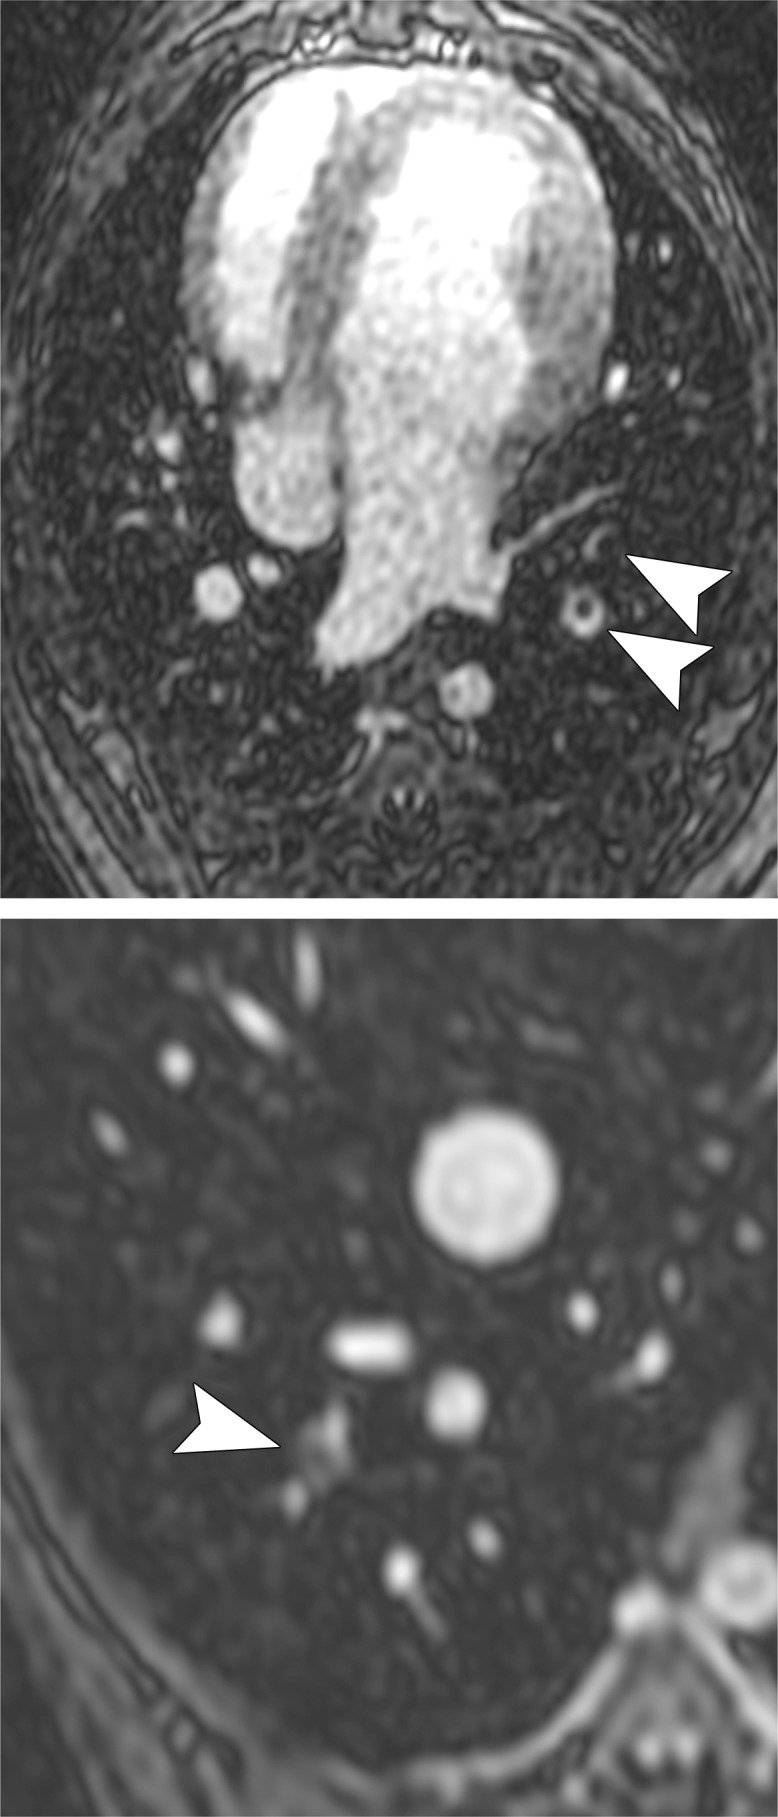
MR angiographic and UTE images used to detect PEs. (a) Breath-hold 3D MR angiographic, (b) free-breathing 3D radial UTE, and (c) CT images after induction of PE. Two segmental emboli (arrowheads in upper row) in the left caudal lobe and one subsegmental embolus (arrowheads in lower row) in the right caudal lobe were detected by both readers with both MR angiography and UTE imaging. UTE imaging shows high-resolution artifact-free depiction of the embolus and the lung parenchyma, including small bronchi within the same window setting.
Figure 2:
Graph shows AFROC analyses of UTE and MR angiography for correct identification of PEs. Reader-averaged areas under the curve of AFROC analyses of MR angiography and UTE served as the figure of merit. The area under the curve is significantly higher for UTE than for MR angiography, with a mean difference of 0.06 (95% CI: 0.01, 0.11) (P = .018).
Figure 1b:
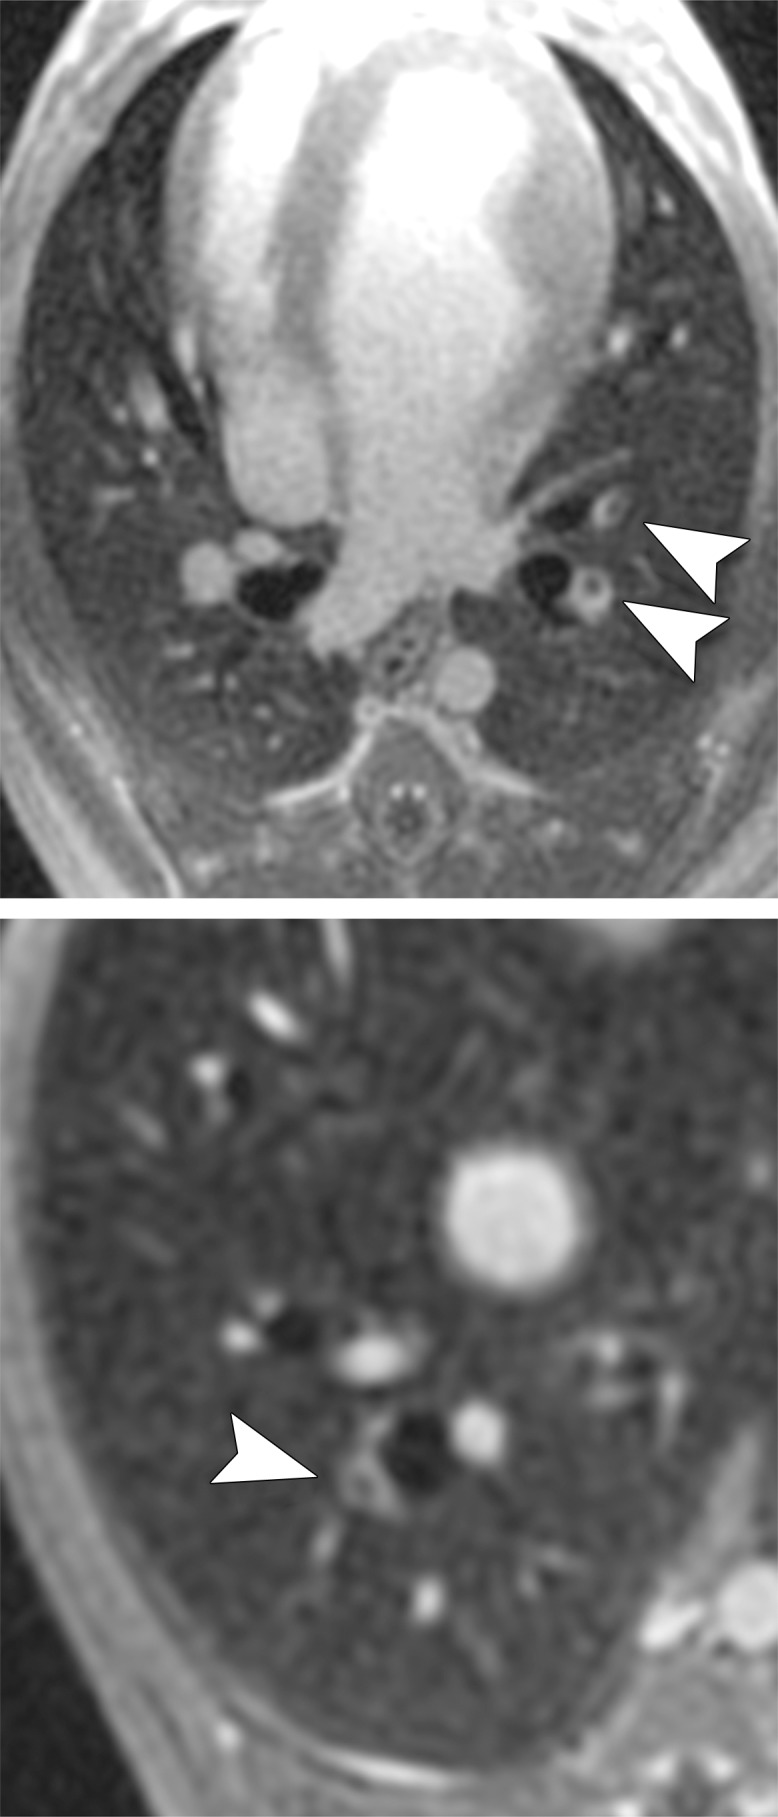
MR angiographic and UTE images used to detect PEs. (a) Breath-hold 3D MR angiographic, (b) free-breathing 3D radial UTE, and (c) CT images after induction of PE. Two segmental emboli (arrowheads in upper row) in the left caudal lobe and one subsegmental embolus (arrowheads in lower row) in the right caudal lobe were detected by both readers with both MR angiography and UTE imaging. UTE imaging shows high-resolution artifact-free depiction of the embolus and the lung parenchyma, including small bronchi within the same window setting.
Figure 1c:
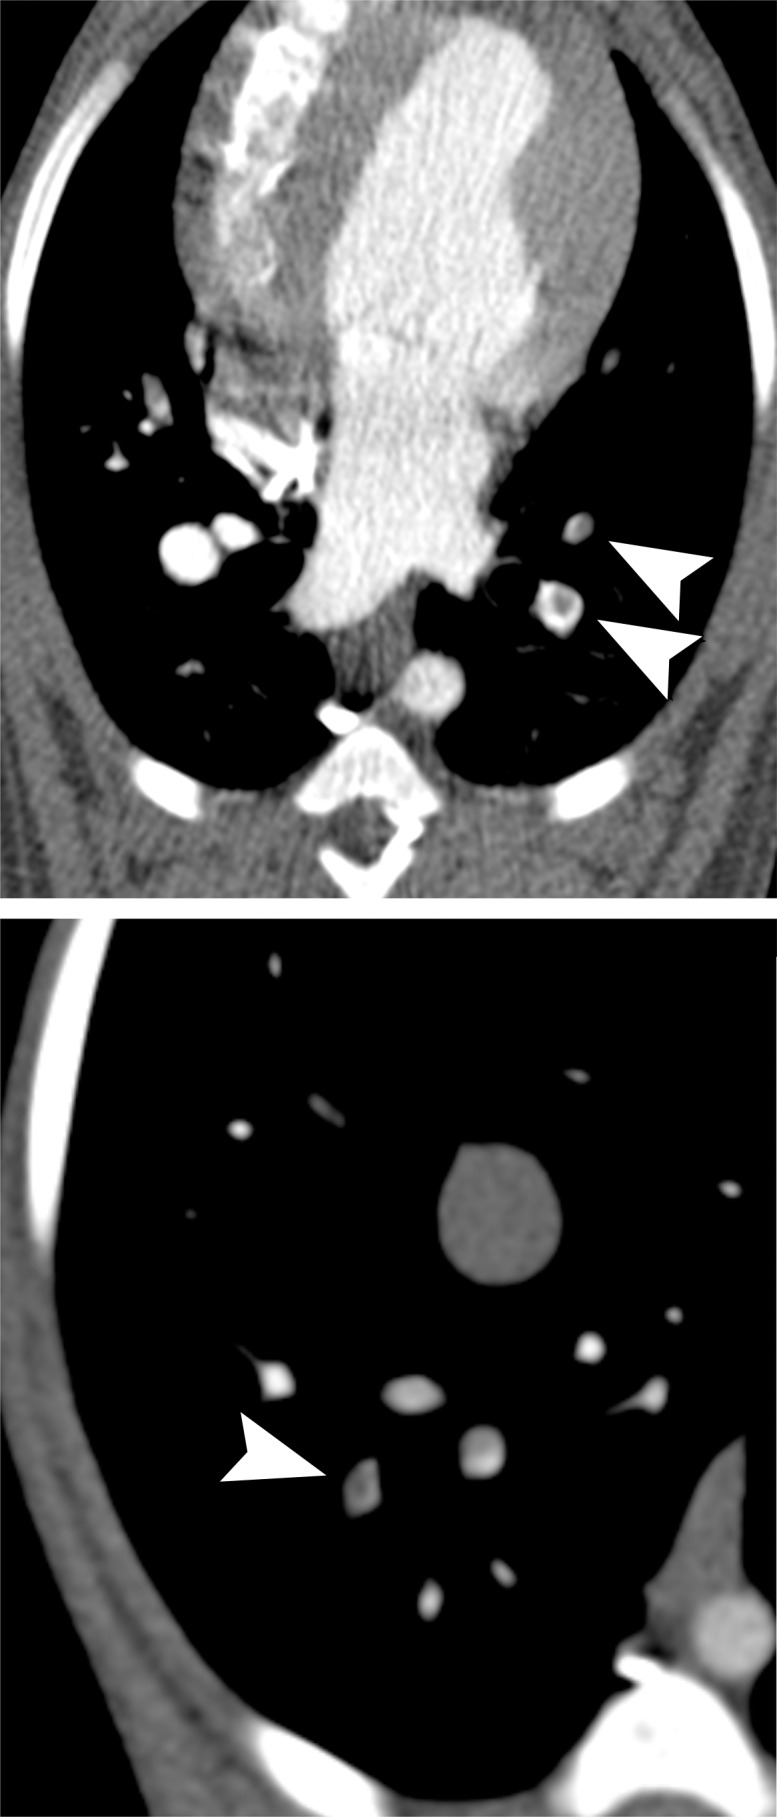
MR angiographic and UTE images used to detect PEs. (a) Breath-hold 3D MR angiographic, (b) free-breathing 3D radial UTE, and (c) CT images after induction of PE. Two segmental emboli (arrowheads in upper row) in the left caudal lobe and one subsegmental embolus (arrowheads in lower row) in the right caudal lobe were detected by both readers with both MR angiography and UTE imaging. UTE imaging shows high-resolution artifact-free depiction of the embolus and the lung parenchyma, including small bronchi within the same window setting.
At a confidence level of 3 or 4, reader 1 had no false-positive ratings with either imaging technique (positive predictive value: 100% [36 of 36] for MR angiography, 100% [40 of 40] for UTE). Reader 2 had no false-positive ratings with UTE (positive predictive value: 100% [38 of 38]) but identified four false-positive emboli with MR angiography (positive predictive value: 89% [34 of 38]).
Qualitative Image Analyses and Artifact Grading
None of the examinations were rated as nondiagnostic with regard to diagnostic image quality of pulmonary arteries or lung parenchyma. A breakdown of all image ratings is provided in the Table.
Qualitative Diagnostic Image Quality Scores of MR Angiographic and UTE Images
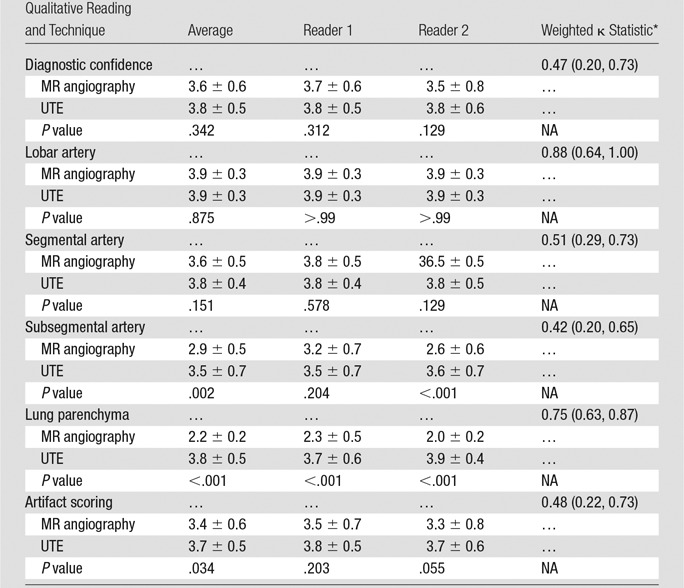
Note.—Unless otherwise indicated, data are mean ± standard deviation. P < .05 indicates a significant difference between MR angiography and UTE. NA = not applicable.
*Data in parenthesis are 95% CIs.
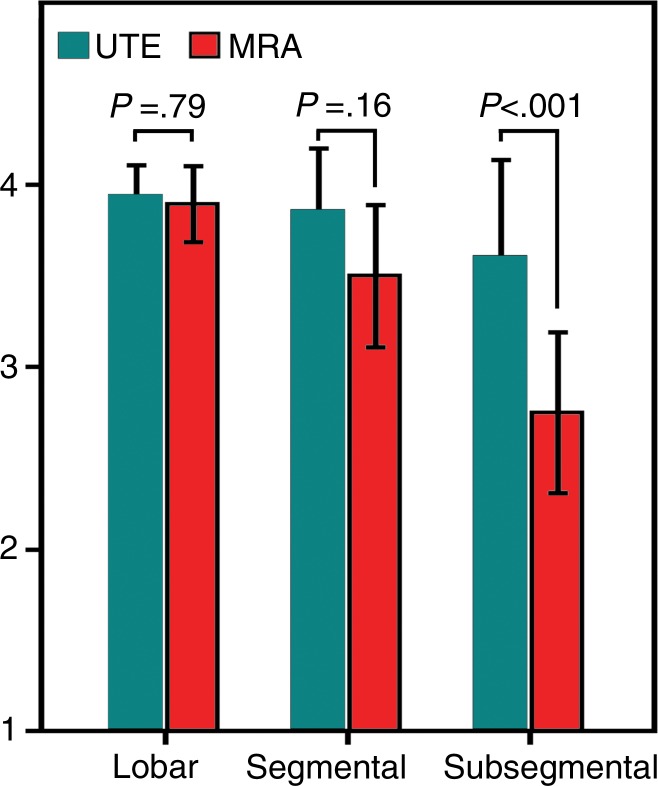
The image quality of pulmonary arteries did not differ significantly between UTE and MR angiographic images for lobar (3.9 ± 0.3 vs 3.9 ± 0.3, P = .875) or segmental (3.8 ± 0.4 vs 3.6 ± 0.5, P = .151) vessels. For subsegmental arteries, image quality was significantly better for UTE than for MR angiography (3.5 ± 0.7 vs 2.9 ± 0.5, P = .002). A comparison of image quality ratings for the pulmonary arteries is shown in Figure 3.
Figure 3:
Bar graph shows image quality ratings of pulmonary arteries for UTE and MR angiography. While the reader-averaged image quality of lobar and segmental arteries was rated similarly for UTE and MR angiography, the image quality of subsegmental arteries was rated significantly better for UTE than for MR angiography. Bars represent mean values, and error bars indicate standard deviations. Image quality was graded as follows: 1, poor; 2, fair; 3, good; 4, excellent.
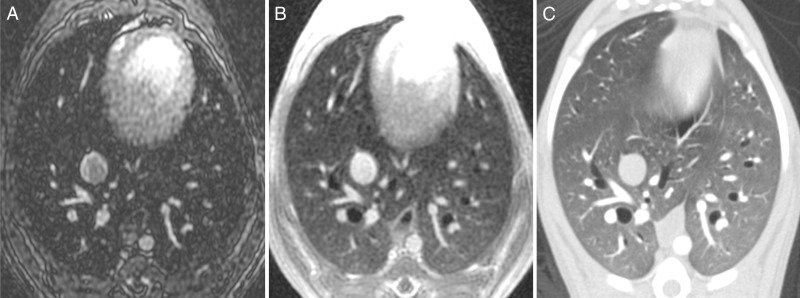
Image quality of the lung parenchyma was significantly better for UTE (3.8 ± 0.5) than for MR angiography (2.2 ± 0.2) (P < .001). Figure 4 shows the visibility of lung parenchyma was better on UTE images than on MR angiographic images. Figure 5 shows a subsegmental embolus that both readers missed on MR angiographic images but successfully detected on high-soft-tissue-contrast UTE images. Image artifacts that may interfere with detection of PEs were significantly lower for UTE (mean artifact score, 3.7 ± 0.5) than for MR angiography (mean artifact score, 3.4 ± 0.6) (P = .034).
Figure 4:
Comparison of MR angiography and UTE for imaging of lung parenchyma. Axial, A, breath-hold MR angiographic, B, free-breathing UTE, and, C, CT images in a subject without embolism. UTE imaging enabled artifact-free and high-resolution depiction of the parenchymal lung structures, including small bronchi. Image quality (ie, visibility) of the lung parenchyma was rated by both readers as fair for MR angiography and as excellent for UTE.
Figure 5a:
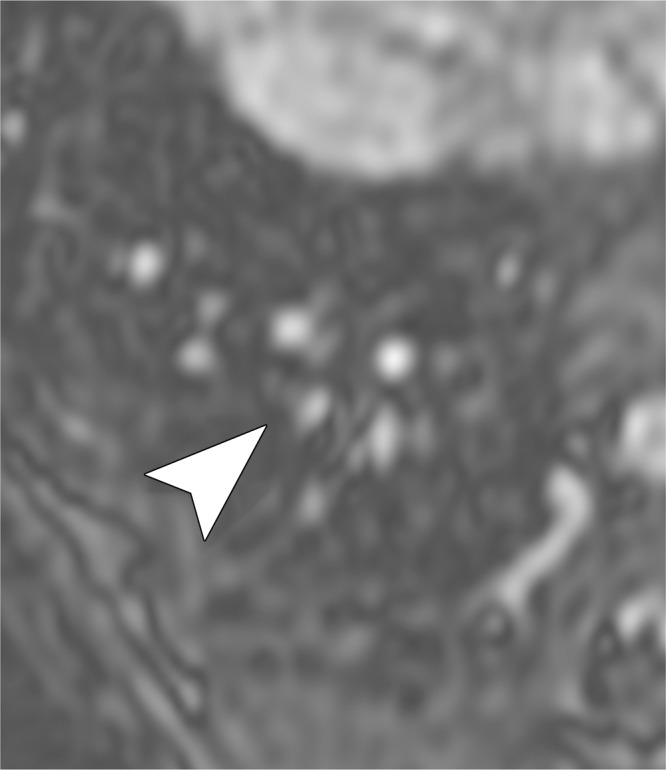
Examples of a subsegmental pulmonary embolus that was detected with UTE but not MR angiography. Axial (a) breath-hold MR angiographic, (b) free-breathing UTE, and (c, d) CT images displayed by using soft-tissue (c) and lung (d) window settings after induction of PE. Both readers detected a subsegmental embolus (arrowhead) in the right caudal lobe with UTE but did not detect the thrombus with MR angiography. Note the high-resolution and improved soft-tissue contrast of the lung parenchyma with UTE, allowing for depiction of the distal bronchus adjacent to the occluded artery.
Figure 5b:
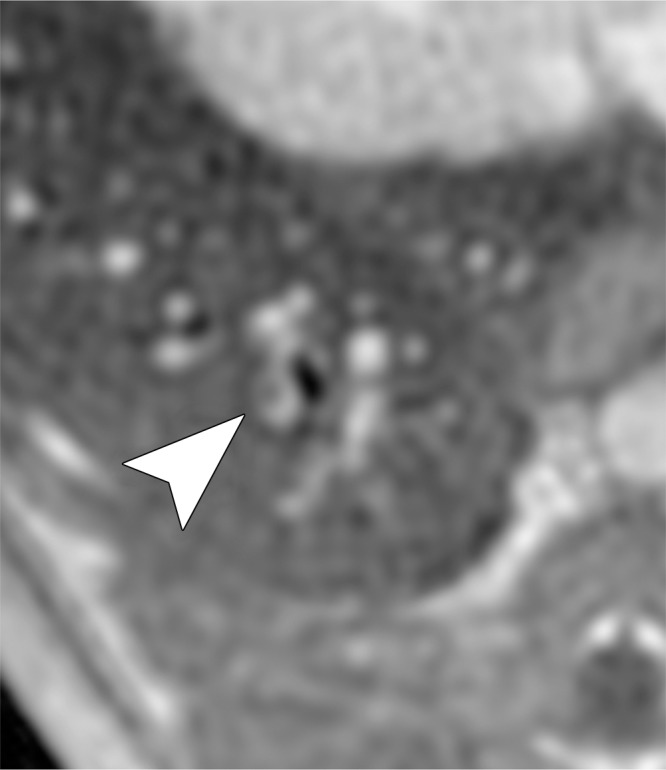
Examples of a subsegmental pulmonary embolus that was detected with UTE but not MR angiography. Axial (a) breath-hold MR angiographic, (b) free-breathing UTE, and (c, d) CT images displayed by using soft-tissue (c) and lung (d) window settings after induction of PE. Both readers detected a subsegmental embolus (arrowhead) in the right caudal lobe with UTE but did not detect the thrombus with MR angiography. Note the high-resolution and improved soft-tissue contrast of the lung parenchyma with UTE, allowing for depiction of the distal bronchus adjacent to the occluded artery.
Figure 5c:
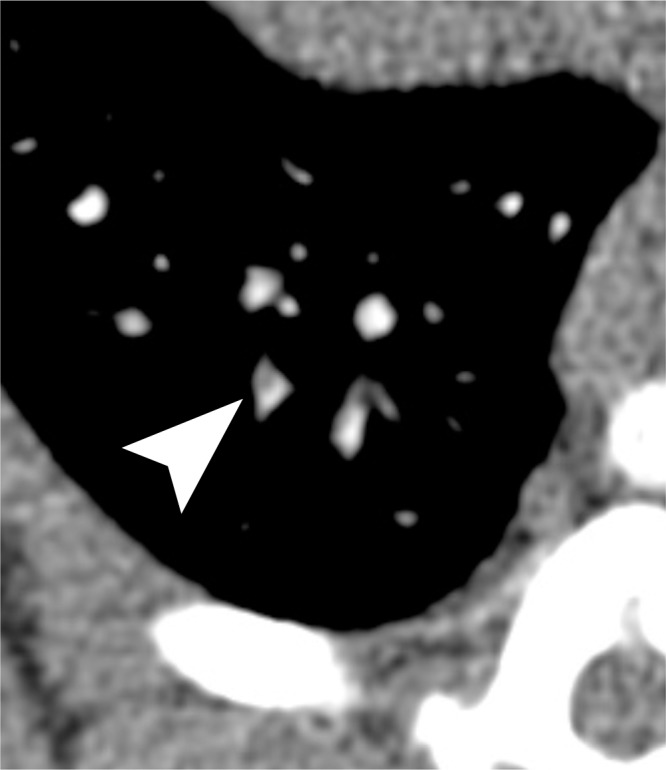
Examples of a subsegmental pulmonary embolus that was detected with UTE but not MR angiography. Axial (a) breath-hold MR angiographic, (b) free-breathing UTE, and (c, d) CT images displayed by using soft-tissue (c) and lung (d) window settings after induction of PE. Both readers detected a subsegmental embolus (arrowhead) in the right caudal lobe with UTE but did not detect the thrombus with MR angiography. Note the high-resolution and improved soft-tissue contrast of the lung parenchyma with UTE, allowing for depiction of the distal bronchus adjacent to the occluded artery.
Figure 5d:
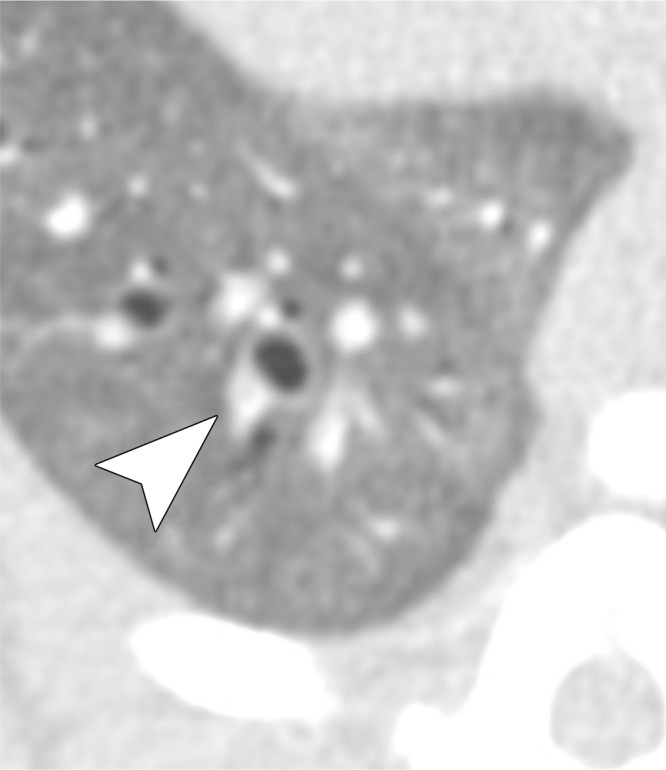
Examples of a subsegmental pulmonary embolus that was detected with UTE but not MR angiography. Axial (a) breath-hold MR angiographic, (b) free-breathing UTE, and (c, d) CT images displayed by using soft-tissue (c) and lung (d) window settings after induction of PE. Both readers detected a subsegmental embolus (arrowhead) in the right caudal lobe with UTE but did not detect the thrombus with MR angiography. Note the high-resolution and improved soft-tissue contrast of the lung parenchyma with UTE, allowing for depiction of the distal bronchus adjacent to the occluded artery.
The κ agreement between observers was moderate for image quality rating of pulmonary arteries (κ = 0.48; 95% CI: 0.34, 0.61) and artifact scoring (κ = 0.48; 95% CI: 0.22, 0.73); whereas the ratings for the image quality of the lung parenchyma showed substantial agreement (κ = 0.75; 95% CI: 0.63, 0.87).
Quantitative Image Analyses
The apparent SNR was significantly higher for UTE than for MR angiography both in pulmonary arteries (41.0 ± 5.2 vs 24.5 ± 6.2, P < .001) and in lung parenchyma (10.2 ± 1.8 vs 3.5 ± 0.8, P < .001). The apparent CNR between pulmonary arteries and PEs was higher for UTE than for MR angiography (20.3 ± 5.2 vs 15.4 ± 6.7); however, this difference was not significant (P = .055).
Discussion
We have successfully demonstrated the feasibility of isotropic high-spatial-resolution free-breathing 3D radial UTE imaging in the simultaneous detection of PE and high-quality evaluation of lung parenchyma in a canine model. In fact, free-breathing 3D radial UTE performed better than breath-hold 3D MR angiography in the detection of individual emboli. Thus, UTE compares favorably with MR angiography in the detection of PE and warrants evaluation in future human studies.
We have also shown that free-breathing 3D radial UTE imaging yields superior image quality for small vessels and lung parenchyma when compared with breath-hold 3D MR angiography. The higher image quality of small vessels may be explained by the higher true spatial resolution (1.0-mm isotropic) that can be achieved with the free-breathing UTE technique. The high image quality of the lung parenchyma can be explained by the short echo times (<0.100 msec) of 3D radial UTE. UTE image quality was further improved by the use of variable-density readout gradients, which have previously been shown to increase SNR by up to 67% (23). Thus, the high SNR contributes to improved soft-tissue contrast and enables discrimination of lung parenchyma, bronchi, and small (subsegmental) vessels. Indeed, the UTE technique yielded a significantly higher apparent SNR of pulmonary arteries and lung parenchyma when compared with MR angiography. UTE also resulted in a higher apparent CNR between pulmonary arteries and PEs when compared with MR angiography, albeit without reaching statistical significance.
The increased quality of lung visualization may indirectly have improved diagnostic performance in the detection of small emboli. This is exemplified in Figure 5, where the embolus is easily identified with UTE but not with MR angiography. The embolus on MR angiographic images cannot be differentiated from lung parenchyma or a nearby bronchus. Embolism conspicuity may also be increased by the visibility of a bronchus, which suggests that there should be an adjacent artery.
The image quality of lung parenchyma in our study is consistent with that in a previous study in which the authors described the optimization of the free-breathing 3D radial UTE technique for imaging the lung structure in human subjects (23). The authors reported excellent visibility of small bronchi, lung parenchyma, and lung fissures and even reported visualization of fibrotic changes in a patient with interstitial fibrosis (23).
Previous studies have reported varying diagnostic performance with current MR angiography methods (4,7–11). The recent multicenter PIOPED III study showed a sensitivity and specificity for acute PE of only 78% and 99%, respectively (4). Although sensitivity on a per-subject basis was higher in our study (92%–100%), it is likely that the diagnostic accuracy of our MR angiographic and UTE techniques is in the range of the previously reported values, as indicated by the confidence intervals. The high sensitivity on a per-subject basis in our study may also be related to the rather small sample size and the fact that most of the animals had several clots injected, increasing the likelihood of at least one clot being detected. It should be noted that extracellular contrast agents were used in the PIOPED III study, whereas we used a blood-pool contrast agent in our study. Because the UTE technique required data collection over approximately 5 minutes, it is possible that the use of an extracellular contrast agent would diminish the performance of UTE due to some washout of contrast material during the examination.
The UTE technique used in this study previously has been shown to be feasible for whole-lung imaging in humans (23). Thus, this study has important clinical implications. First, the free-breathing technique avoids the need for long breath holds in patients with dyspnea who are suspected of having PE. Second, the 3D radial UTE method depicts the lung parenchyma with high image quality. This is advantageous because presenting symptoms of PE are nonspecific, and it is important to evaluate the lung parenchyma for other causes of the patient’s symptoms. The free-breathing UTE technique could potentially depict small areas of consolidation, edema, or metastases, as well as structural parenchymal changes, such as fibrosis or emphysema, that cannot be detected with breath-hold MR angiographic techniques. Thus, use of such an MR-based imaging technique without radiation exposure could lead to a change in the paradigm of using CT as a first-line imaging modality in the diagnosis of PE. However, further studies in human subjects are needed to assess whether UTE will be sufficient to visualize structures usually seen with CT, such as pulmonary edema, lung nodules, air trapping, or early stage interstitial fibrosis.
Our study had several limitations. First, this was a pilot study in a limited number of animals. Despite the small study size, the fact that UTE outperformed MR angiography is very promising. A second limitation was the fact that the animals were mechanically ventilated. This likely improved the quality of both breath-hold MR angiography and free-breathing UTE acquisitions. We suspect that breath-hold MR angiography will be more compromised than free-breathing UTE when imaging patients with dyspnea. Prospective evaluation of the relative performance of the methods in a clinical setting will be an important next step.
In summary, in a canine model, free-breathing 3D radial UTE imaging of the lungs yields both higher accuracy for PE detection and significantly better image quality for small vessels and the lung parenchyma than breath-hold MR angiography. Use of 3D radial UTE in the detection of PE is feasible and worth evaluating in human subjects.
Advances in Knowledge
■ Free-breathing three-dimensional (3D) radial ultrashort echo time (UTE) imaging yields higher accuracy in the detection of pulmonary embolism (PE) in a canine model when compared with the accuracy of breath-hold 3D MR angiography (P = .018).
■ Free-breathing 3D radial UTE imaging provides significantly better subjective image quality for subsegmental arteries and lung parenchyma in a canine model when compared with breath-hold 3D MR angiography (P = .002 and P < .001, respectively).
Implications for Patient Care
■ Free-breathing 3D radial UTE imaging allows for combined MR imaging of pulmonary vasculature and lung parenchyma and has the potential to obviate breath holding in patients with dyspnea who are suspected to have a PE.
■ Free-breathing 3D radial UTE MR imaging enables radiation-free free-breathing cross-sectional lung imaging with high soft-tissue contrast and has the potential to contribute to MR imaging as a first-line imaging test for PE.
Received March 12, 2015; revision requested April 27; revision received May 18; accepted June 12; final version accepted June 18.
Supported by the University of Wisconsin–Madison R&D fund.
Funding: This research was supported by the National Institutes of Health (grants K24 DK102595, R01NS066982, UL1TR000427, and KL2TR000428).
Current addresses: Department of Radiology, University Hospital Hamburg-Eppendorf, Hamburg, Germany.
Current addresses: Department of Radiology, University of Yamanashi, Yamanashi, Japan.
Disclosures of Conflicts of Interest: P.B. disclosed no relevant relationships. L.C.B. disclosed no relevant relationships. K.M.J. Activities related to the present article: disclosed no relevant relationships. Activities not related to the present article: received research support from GE Healthcare. Other relationships: disclosed no relevant relationships. M.L.S. disclosed no relevant relationships. C.J.F. disclosed no relevant relationships. U.M. disclosed no relevant relationships. D.C. disclosed no relevant relationships. S.B.R. Activities related to the present article: disclosed no relevant relationships. Activities not related to the present article: received research support from Bracco Diagnostics and GE Healthcare. Other relationships: disclosed no relevant relationships. S.K.N. Activities related to the present article: disclosed no relevant relationships. Activities not related to the present article: received research support from GE Healthcare. Other relationships: disclosed no relevant relationships.
Abbreviations:
- AFROC
- alternative free-response receiver operating characteristic curve
- CI
- confidence interval
- CNR
- contrast-to-noise ratio
- PE
- pulmonary embolism
- SNR
- signal-to-noise ratio
- 3D
- three-dimensional
- UTE
- ultrashort echo time
References
- 1.Mozaffarian D, Benjamin EJ, Go AS, et al. Heart disease and stroke statistics–2015 update: a report from the American Heart Association. Circulation 2015;131(4):e29–e322. [DOI] [PubMed] [Google Scholar]
- 2.Jaff MR, McMurtry MS, Archer SL, et al. Management of massive and submassive pulmonary embolism, iliofemoral deep vein thrombosis, and chronic thromboembolic pulmonary hypertension: a scientific statement from the American Heart Association. Circulation 2011;123(16):1788–1830. [DOI] [PubMed] [Google Scholar]
- 3.Stein PD, Fowler SE, Goodman LR, et al. Multidetector computed tomography for acute pulmonary embolism. N Engl J Med 2006;354(22):2317–2327. [DOI] [PubMed] [Google Scholar]
- 4.Stein PD, Chenevert TL, Fowler SE, et al. Gadolinium-enhanced magnetic resonance angiography for pulmonary embolism: a multicenter prospective study (PIOPED III). Ann Intern Med 2010;152(7):434–443, W142–W143. [DOI] [PMC free article] [PubMed] [Google Scholar]
- 5.Brenner DJ, Hall EJ. Computed tomography: an increasing source of radiation exposure. N Engl J Med 2007;357(22):2277–2284. [DOI] [PubMed] [Google Scholar]
- 6.François CJ, Hartung MP, Reeder SB, Nagle SK, Schiebler ML. MRI for acute chest pain: current state of the art. J Magn Reson Imaging 2013;37(6):1290–1300. [DOI] [PubMed] [Google Scholar]
- 7.Kalb B, Sharma P, Tigges S, et al. MR imaging of pulmonary embolism: diagnostic accuracy of contrast-enhanced 3D MR pulmonary angiography, contrast-enhanced low-flip angle 3D GRE, and nonenhanced free-induction FISP sequences. Radiology 2012;263(1):271–278. [DOI] [PubMed] [Google Scholar]
- 8.Schiebler ML, Nagle SK, François CJ, et al. Effectiveness of MR angiography for the primary diagnosis of acute pulmonary embolism: clinical outcomes at 3 months and 1 year. J Magn Reson Imaging 2013;38(4):914–925. [DOI] [PMC free article] [PubMed] [Google Scholar]
- 9.Meaney JF, Weg JG, Chenevert TL, Stafford-Johnson D, Hamilton BH, Prince MR. Diagnosis of pulmonary embolism with magnetic resonance angiography. N Engl J Med 1997;336(20):1422–1427. [DOI] [PubMed] [Google Scholar]
- 10.Ohno Y, Higashino T, Takenaka D, et al. MR angiography with sensitivity encoding (SENSE) for suspected pulmonary embolism: comparison with MDCT and ventilation-perfusion scintigraphy. AJR Am J Roentgenol 2004;183(1):91–98. [DOI] [PubMed] [Google Scholar]
- 11.Oudkerk M, van Beek EJ, Wielopolski P, et al. Comparison of contrast-enhanced magnetic resonance angiography and conventional pulmonary angiography for the diagnosis of pulmonary embolism: a prospective study. Lancet 2002;359(9318):1643–1647. [DOI] [PubMed] [Google Scholar]
- 12.Wielpütz M, Kauczor HU. MRI of the lung: state of the art. Diagn Interv Radiol 2012;18(4):344–353. [DOI] [PubMed] [Google Scholar]
- 13.Kuethe DO, Adolphi NL, Fukushima E. Short data-acquisition times improve projection images of lung tissue. Magn Reson Med 2007;57(6):1058–1064. [DOI] [PubMed] [Google Scholar]
- 14.Togao O, Tsuji R, Ohno Y, Dimitrov I, Takahashi M. Ultrashort echo time (UTE) MRI of the lung: assessment of tissue density in the lung parenchyma. Magn Reson Med 2010;64(5):1491–1498. [DOI] [PubMed] [Google Scholar]
- 15.Zurek M, Bessaad A, Cieslar K, Crémillieux Y. Validation of simple and robust protocols for high-resolution lung proton MRI in mice. Magn Reson Med 2010;64(2):401–407. [DOI] [PubMed] [Google Scholar]
- 16.Strobel K, Hoerr V, Schmid F, Wachsmuth L, Löffler B, Faber C. Early detection of lung inflammation: exploiting T1-effects of iron oxide particles using UTE MRI. Magn Reson Med 2012;68(6):1924–1931. [DOI] [PubMed] [Google Scholar]
- 17.Takahashi M, Togao O, Obara M, et al. Ultra-short echo time (UTE) MR imaging of the lung: comparison between normal and emphysematous lungs in mutant mice. J Magn Reson Imaging 2010;32(2):326–333. [DOI] [PMC free article] [PubMed] [Google Scholar]
- 18.Togao O, Ohno Y, Dimitrov I, Hsia CC, Takahashi M. Ventilation/perfusion imaging of the lung using ultra-short echo time (UTE) MRI in an animal model of pulmonary embolism. J Magn Reson Imaging 2011;34(3):539–546. [DOI] [PMC free article] [PubMed] [Google Scholar]
- 19.Yu J, Xue Y, Song HK. Comparison of lung T2* during free-breathing at 1.5 T and 3.0 T with ultrashort echo time imaging. Magn Reson Med 2011;66(1):248–254. [DOI] [PMC free article] [PubMed] [Google Scholar]
- 20.Bergin CJ, Pauly JM, Macovski A. Lung parenchyma: projection reconstruction MR imaging. Radiology 1991;179(3):777–781. [DOI] [PubMed] [Google Scholar]
- 21.Schmidt MA, Yang GZ, Keegan J, et al. Non-breath-hold lung magnetic resonance imaging with real-time navigation. MAGMA 1997;5(2):123–128. [DOI] [PubMed] [Google Scholar]
- 22.Barger AV, Block WF, Toropov Y, Grist TM, Mistretta CA. Time-resolved contrast-enhanced imaging with isotropic resolution and broad coverage using an undersampled 3D projection trajectory. Magn Reson Med 2002;48(2):297–305. [DOI] [PubMed] [Google Scholar]
- 23.Johnson KM, Fain SB, Schiebler ML, Nagle S. Optimized 3D ultrashort echo time pulmonary MRI. Magn Reson Med 2013;70(5):1241–1250. [DOI] [PMC free article] [PubMed] [Google Scholar]
- 24.François CJ, Lum DP, Johnson KM, et al. Renal arteries: isotropic, high-spatial-resolution, unenhanced MR angiography with three-dimensional radial phase contrast. Radiology 2011;258(1):254–260. [DOI] [PMC free article] [PubMed] [Google Scholar]
- 25.Tang CX, Zhang LJ, Han ZH, et al. Dual-energy CT based vascular iodine analysis improves sensitivity for peripheral pulmonary artery thrombus detection: an experimental study in canines. Eur J Radiol 2013;82(12):2270–2278. [DOI] [PubMed] [Google Scholar]
- 26.Chakraborty DP, Breatnach ES, Yester MV, Soto B, Barnes GT, Fraser RG. Digital and conventional chest imaging: a modified ROC study of observer performance using simulated nodules. Radiology 1986;158(1):35–39. [DOI] [PubMed] [Google Scholar]
- 27.Chakraborty DP. Maximum likelihood analysis of free-response receiver operating characteristic (FROC) data. Med Phys 1989;16(4):561–568. [DOI] [PubMed] [Google Scholar]
- 28.Chakraborty DP, Winter LH. Free-response methodology: alternate analysis and a new observer-performance experiment. Radiology 1990;174(3 Pt 1):873–881. [DOI] [PubMed] [Google Scholar]
- 29.Coxson HO, Baile EM, King GG, Mayo JR. Diagnosis of subsegmental pulmonary emboli: a multi-center study using a porcine model. J Thorac Imaging 2005;20(1):24–31. [DOI] [PubMed] [Google Scholar]
- 30.Ward J, Naik KS, Guthrie JA, Wilson D, Robinson PJ. Hepatic lesion detection: comparison of MR imaging after the administration of superparamagnetic iron oxide with dual-phase CT by using alternative-free response receiver operating characteristic analysis. Radiology 1999;210(2):459–466. [DOI] [PubMed] [Google Scholar]
- 31.Kundel HL, Polansky M. Measurement of observer agreement. Radiology 2003;228(2):303–308. [DOI] [PubMed] [Google Scholar]


