Multiregion quantitative analysis of multiparametric MR imaging can provide a more comprehensive characterization of intratumor heterogeneity and has the potential to reveal more prognostic and predictive imaging biomarkers.
Abstract
Purpose
To develop and independently validate prognostic imaging biomarkers for predicting survival in patients with glioblastoma on the basis of multiregion quantitative image analysis.
Materials and Methods
This retrospective study was approved by the local institutional review board, and informed consent was waived. A total of 79 patients from two independent cohorts were included. The discovery and validation cohorts consisted of 46 and 33 patients with glioblastoma from the Cancer Imaging Archive (TCIA) and the local institution, respectively. Preoperative T1-weighted contrast material–enhanced and T2-weighted fluid-attenuation inversion recovery magnetic resonance (MR) images were analyzed. For each patient, we semiautomatically delineated the tumor and performed automated intratumor segmentation, dividing the tumor into spatially distinct subregions that demonstrate coherent intensity patterns across multiparametric MR imaging. Within each subregion and for the entire tumor, we extracted quantitative imaging features, including those that fully capture the differential contrast of multimodality MR imaging. A multivariate sparse Cox regression model was trained by using TCIA data and tested on the validation cohort.
Results
The optimal prognostic model identified five imaging biomarkers that quantified tumor surface area and intensity distributions of the tumor and its subregions. In the validation cohort, our prognostic model achieved a concordance index of 0.67 and significant stratification of overall survival by using the log-rank test (P = .018), which outperformed conventional prognostic factors, such as age (concordance index, 0.57; P = .389) and tumor volume (concordance index, 0.59; P = .409).
Conclusion
The multiregion analysis presented here establishes a general strategy to effectively characterize intratumor heterogeneity manifested at multimodality imaging and has the potential to reveal useful prognostic imaging biomarkers in glioblastoma.
© RSNA, 2015
Introduction
Glioblastoma multiforme (GBM) is the most common malignant primary brain tumor in adults (1). Despite aggressive treatment, the prognosis of patients with GBM remains poor, with a median survival of 12–14 months (2,3). This poor prognosis is partly due to the fact that GBM is a genetically heterogeneous disease across patients, tumors, and even within a single tumor (4–6). While this characteristic poses large challenges for targeted therapies on the basis of a single biopsy, it provides unique opportunities for the use of imaging to obtain a holistic view of the tumor in a noninvasive and repeatable manner, which may complement molecular characterization (7,8).
Magnetic resonance (MR) imaging is routinely used for initial diagnosis and monitoring of treatment response in patients with GBM. Several imaging characteristics, such as preoperative tumor volume, extent of edema, degree of necrosis, and degree of contrast enhancement, have also shown certain prognostic value (7,9,10). Recently, there was a multi-institutional effort to standardize the assessment of imaging features by using controlled terminology (11). Many of these features are qualitatively or semiquantitatively assessed. Methods that rely on fully quantitative objective evaluation of the imaging features improve reproducibility and can potentially complement visual assessment by radiologists.
To date, most studies have focused on characterizing the classic tumor compartments, such as contrast enhancement, necrosis, and edema, in a GBM (12–14). While undoubtedly useful, these regions largely derive from visual appearances and may not fully capture the complexity of the various sub clones within a heterogeneous tumor. Additionally, although multiple methods, such as T1-weighted contrast material–enhanced and T2-weighted fluid-attenuation inversion recovery (FLAIR) MR imaging, are being used to characterize tumors, the imaging features are separately derived for each modality. The differential contrast afforded by multiparametric MR imaging has not been exploited to its full potential. Several preliminary studies have begun to address these issues, and initial results appear promising (15–17).
In this work, we perform quantitative, multiregion tumor analysis with multiparametric MR imaging. Instead of relying on a priori–defined tumor compartments, we adopted a data-driven approach for automated intratumor segmentation, which divides the tumor volume into several spatially distinct regions that demonstrate coherent signal intensity patterns across multiparametric MR imaging. Within each subregion, comprehensive, quantitative imaging features are extracted, including those that capture the inherent covariance structures of signal intensity at multiparametric MR imaging. The purpose of this study was to develop quantitative imaging biomarkers for GBM on the basis of multiregion, quantitative analysis of multiparametric MR imaging and assess their prognostic value for predicting overall survival (OS) in an independent cohort.
Materials and Methods
Study Population
A total of 79 patients with pathologically proved GBM from two independent cohorts were analyzed. The inclusion criteria were that patients have treatment-naïve GBM and that survival information and preoperative MR images (including both T1-weighted postcontrast and T2-weighted FLAIR) be available, and exclusion criteria were missing survival information and a history of surgery and/or chemoradiation therapy. For the discovery cohort, we obtained 70 patients’ images from the Cancer Imaging Archive (TCIA) (18). Fifteen (21%) patients were excluded due to unknown survival, and nine (13%) patients were excluded due to prior surgery, resulting in 46 (66%) patients eligible for the study. Because all patient data in TCIA were deidentified, institutional review board approval was waived. The validation cohort consisted of patients with GBM who underwent surgery at the local institution between August 2004 and February 2014. We included 33 (92%) of 36 patients with GBM for this study with local institutional review board approval. Three (8%) patients were excluded due to missing survival information. Table 1 shows the summary of the study population.
Table 1.
Summary of Study Population
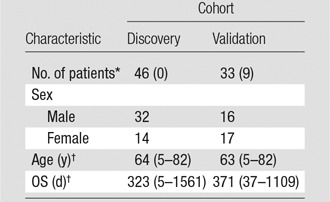
Note.—Unless otherwise noted, data are numbers of patients. The discovery cohort is from TCIA, and the validation cohort is from the local institution.
*Data in parentheses are the number of censored patients.
†Data are the median, and data in parentheses are the range.
Imaging Parameters
All MR images were acquired in axial sections with a 1.5-T (n = 64, or 81%) or 3.0-T (n = 14, or 18%) imager with the exception of one patient (1%), in whom images were acquired with a 0.4-T imager. T1-weighted postcontrast images were acquired with a spin- or gradient-echo sequence with the following range of parameters: repetition time msec/echo time msec, 250–210/4.2–20; intrasection pixel spacing, 0.39–1.02 mm; section thickness, 2.5–6.0 mm; intersection gap, 0–2.0 mm. FLAIR images were acquired with the following range of parameters: 5000–11000/94.424–155; inversion time, 1900–2850 msec; intrasection pixel spacing, 0.39–1.02 mm; section thickness, 2.5–7.0 mm; intersection spacing, 0–2.0 mm. χ2 tests showed no dependency of the imaging parameters on the patient groups divided by the median survival (P > .1 for all comparisons).
Image Preprocessing
In light of the different imaging parameters, we preprocessed the MR images to standardize data analysis across patients. For each patient, we first coregistered the T1-weighted postcontrast and FLAIR images on the basis of rigid transformation and mutual information. The open-source software elastix was used for this task (19). Then we normalized both images by the mean intensity of the contralateral healthy-appearing cerebral white matter, which was manually selected by two neuroradiologists (K.K. and K.K.T., with 18 and 15 years of experience in neuroradiology, respectively), thereby compensating the effect of magnetic field strength on image contrast (20). The diameter of the selected region of interest ranged from 10 to 15 mm. Finally, we resampled the two coregistered images into a uniform intrasection pixel spacing of 0.5 × 0.5 mm2 across all patients. To avoid aliasing artifacts, we did not resample the image along the z-axis because of the considerable section thickness and/or intersection spacing. Our algorithm took into account the variations in these parameters such that the bias in image feature calculation would be eliminated. In addition, although the image preprocessing steps did not compensate for the differing signal-to-noise ratio introduced by different magnetic field strengths, this effect is largely mitigated by the fact that all the signal intensity–based features derived from ensemble or cumulative statistics of many pixels (Table 2).
Table 2.
Summary of Quantitative Imaging Features
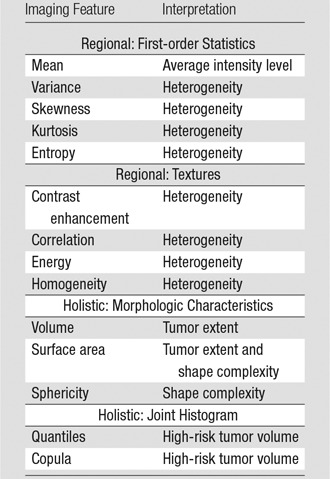
Note.—Regional features denote subregions 1–4, and holistic features denote the entire tumor.
Tumor Delineation and Intratumor Segmentation
The ring-like hyperintense mass with central necrosis or cysts on T1-weighted postcontrast images (hereafter referred to as tumor) was semiautomatically delineated section by section. First, this procedure involved manually drawing (K.K. and K.K.T.) polygons with five to ten vertices both inside and outside the tumor. Then, the tumor was automatically segmented with a cell automaton and level-set evolution algorithm (21,22). The peripheral nonenhancing region with hyperintensity on FLAIR images was also similarly obtained. To assess the interobserver variability of the semiautomatic tumor delineation process, we calculated the degree of overlap, or Dice index, between the tumor regions of interest obtained from the initialization of the two neuroradiologists for five randomly selected patients (23).
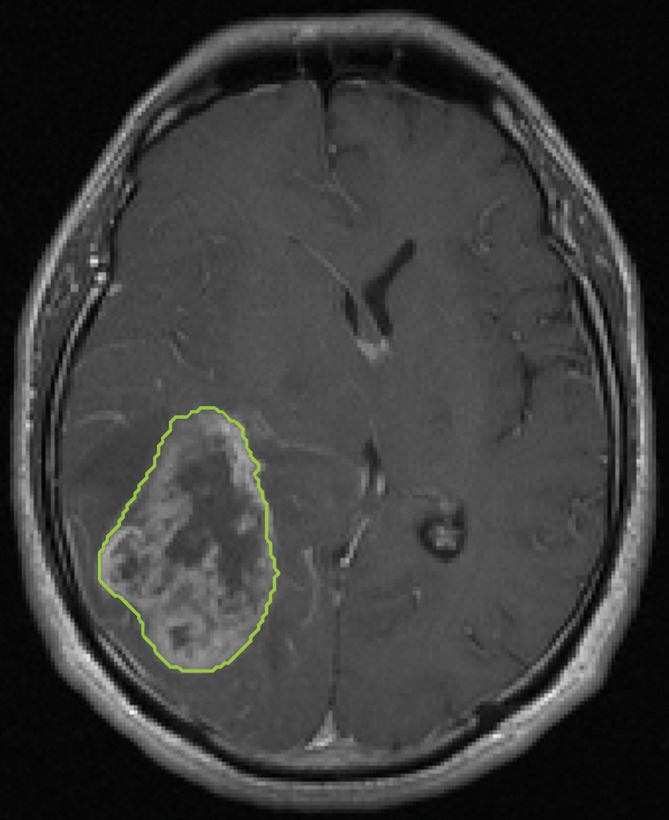
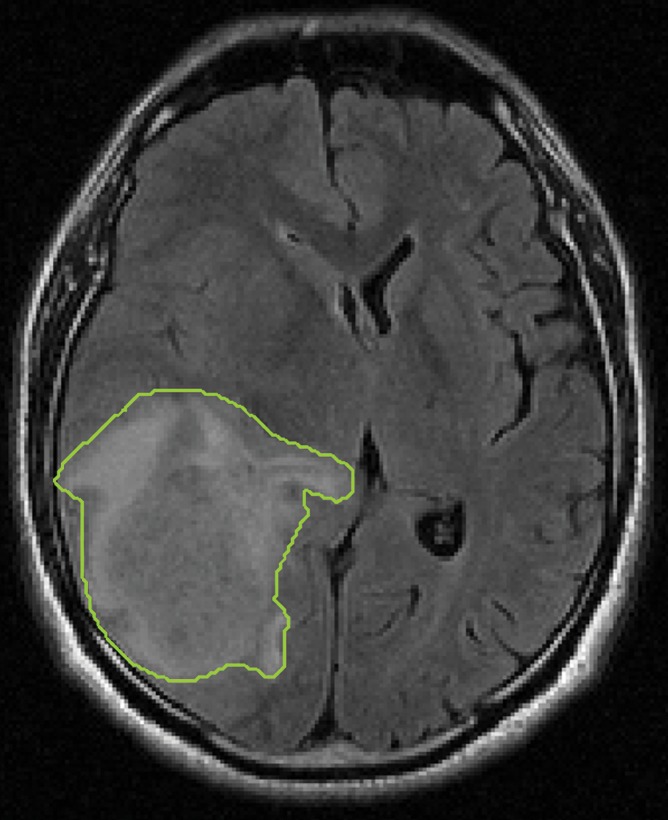
To fully capture the intrinsic intratumor heterogeneity reflected on MR images, we further segmented the delineated tumor into multiple spatially distinct subregions (Fig 1). Here, we adapted a segmentation method on the basis of the hidden Markov random field (MRF) model and the expectation-maximization algorithm (24). By adding spatial regularization, this method enables voxels with similar signal intensity patterns and spatial proximity to be grouped together. Therefore, it can effectively avoid the formation of numerous disconnected small islands in the segmentation and retain useful spatial information for multiregion image analysis. Moreover, instead of separately segmenting postcontrast T1-weighted and FLAIR images, we generalized this method to multiple dimensions, which ensures the joint homogeneity for both postcontrast T1-weighted and FLAIR signal intensities in each subregion.
Figure 1a:
Segmentation of the delineated tumor. Delineation results in creation of (a) postcontrast T1-weighted and (b) FLAIR images. (c) Color-coded image shows tumor and peripheral nonenhancing regions. (d) Color-coded image shows the result of intratumor segmentation. Blue areas = hypointense to mildly hyperintense, green areas = moderately hyperintense, orange areas = strongly hyperintense.
Figure 1b:
Segmentation of the delineated tumor. Delineation results in creation of (a) postcontrast T1-weighted and (b) FLAIR images. (c) Color-coded image shows tumor and peripheral nonenhancing regions. (d) Color-coded image shows the result of intratumor segmentation. Blue areas = hypointense to mildly hyperintense, green areas = moderately hyperintense, orange areas = strongly hyperintense.
Figure 1c:
Segmentation of the delineated tumor. Delineation results in creation of (a) postcontrast T1-weighted and (b) FLAIR images. (c) Color-coded image shows tumor and peripheral nonenhancing regions. (d) Color-coded image shows the result of intratumor segmentation. Blue areas = hypointense to mildly hyperintense, green areas = moderately hyperintense, orange areas = strongly hyperintense.
Figure 1d:
Segmentation of the delineated tumor. Delineation results in creation of (a) postcontrast T1-weighted and (b) FLAIR images. (c) Color-coded image shows tumor and peripheral nonenhancing regions. (d) Color-coded image shows the result of intratumor segmentation. Blue areas = hypointense to mildly hyperintense, green areas = moderately hyperintense, orange areas = strongly hyperintense.
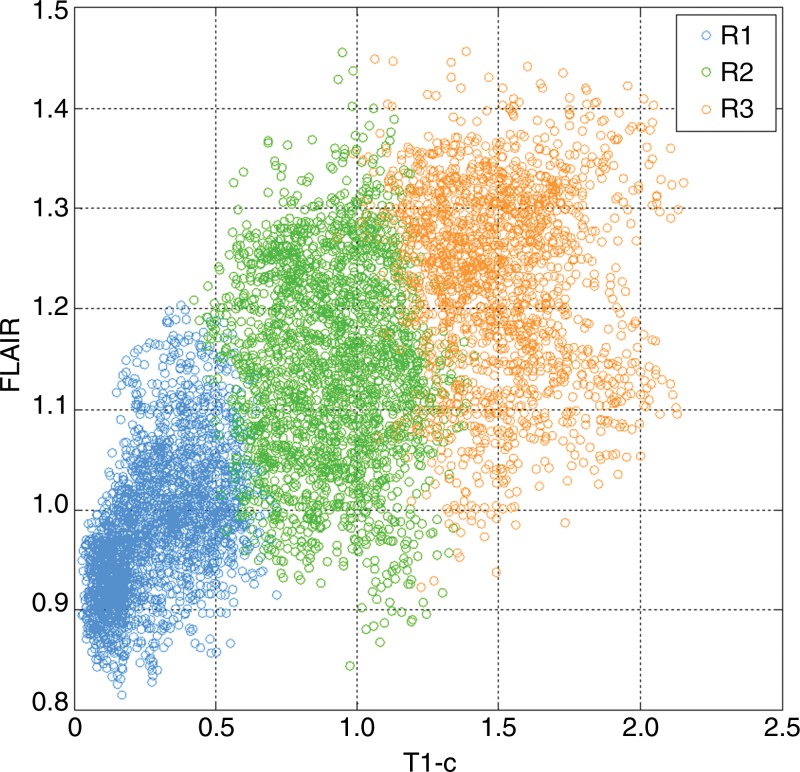
The optimal number of subregions into which the tumor should be segmented was determined with a data-driven approach (Appendices E1, E2 [online]). On the basis of TCIA data, we determined this number to be three. Therefore, in this study, we consistently segmented each patient’s tumor into three subregions. When ranked by the mean postcontrast T1-weighted signal intensity levels, these subregions heuristically represented hypointense to mildly hyperintense (R1), moderately hyperintense (R2), and strongly hyperintense (R3) tumor compartments (Fig 2). In total, this led to four distinct regions (R1, R2, R3, and peripheral nonenhancing) from which regional features were extracted.
Figure 2:
Graph shows the distributions of postcontrast T1-weighted and FLAIR signal intensity within a tumor, with each voxel color-coded by the subregion to which it belongs according to intratumor segmentation. Regions are ordered by their mean T1-weighted postcontrast signal intensity level. Blue = low signal intensity, green = medium signal intensity, orange = high signal intensity.
Imaging Feature Extraction
We extracted two types of imaging features: regional and holistic (Table 2). For regional features, we computed five first-order statistics and four texture features for each of the four regions (three tumor subregions and one surrounding nonenhancing region) and the two imaging modalities (T1-weighted postcontrast and FLAIR), giving us 72 features (9 × 4 × 2) (25). For holistic features, we calculated three morphologic features and 45 joint histogram features for the whole tumor (Appendix E2 [online]). In total, we extracted 110 quantitative imaging features.
Feature Robustness and Redundancy Analysis
Since calculation of the imaging features depends on the tumor contour, to build reliable models, we selected the subset of imaging features that are robust against tumor delineation uncertainties. To do this, we randomly chose 20 patients from the TCIA data set and drew different polygons inside and outside the tumor. Then, an automatic segmentation algorithm was separately run with these different initial boundaries to obtain multiple tumor delineations. The features extracted from these multiple delineations were assessed with intraclass correlation (26). Features with an intraclass correlation score of less than 0.8 were discarded from subsequent analysis.
After feature robustness analysis, we further removed highly correlated features to reduce the computational burden of model training. Specifically, we calculated the correlation coefficient between each pair of features and removed one if its correlation coefficient was greater than 0.95.
Statistical Analysis
On the basis of the extracted imaging features, we aimed to build a prognostic model for predicting survival in patients with GBM. A multivariate Cox regression model was trained on the basis of data from TCIA. Because the number of imaging features was relatively large compared with the number of patients, special care is needed to reduce the potential risk for over-fitting or false discovery. Here, we adopted the regularization method on the basis of the least absolute shrinkage and selection operator (LASSO) (27). LASSO works by shrinking irrelevant variables to zero and only retains useful features, effectively reducing the number of variables for model fitting. We used cross-validation to find the optimal regularization parameter for LASSO. We then repeated this procedure with 100 bootstraps and obtained the final weights as the average of the bootstrap estimates.
To validate our prognostic model, we fixed it as previously described and applied it to an independent cohort of 33 patients from the local institution. The concordance index score between the predicted hazard and true OS was computed to evaluate the performance of the model (28). Concordance index ranged from 0 to 1, with 1 indicating a perfect model (a random guess would give a concordance index of 0.5). The predictive value of our imaging features was compared with established prognostic factors such as age, tumor volume, and extent of resection (9,29,30).
Results
Imaging Biomarker Discovery on the Basis of TCIA Data
Tumor delineation showed excellent agreement between the two observers (Dice index range, 0.988–0.991). After the robustness test and redundancy removal were performed, 95 out of the initial 110 imaging features remained. These remaining features were normalized and then used to train a sparse Cox regression model based on the TCIA cohort. The optimal model parameters were obtained with 100 repetitions of bootstrapping. To predict OS, only five imaging features remained in the final Cox regression model (ie, they had nonzero weights) (Table 3). The five features with prognostic significance were: (a) surface area, (b) 40% quantile of the postcontrast T1-weighted MR image signal intensity, (c) skewness of the FLAIR image signal intensity in the hypointense to mildly hyperintense subregion, (d) kurtosis of the postcontrast T1-weighted MR image signal intensity in the moderately hyperintense subregion, and (e) copula bin of the two-dimensional joint histogram (2,5). In particular, tumor surface area ranked as the most dominant feature affecting OS, with the risk for decease increasing by 29.3% per unit increase.
Table 3.
Imaging Features Selected by Cox Model with LASSO and Corresponding Weights and Ranked by their Dominance in the Model

Note.—Data are the mean plus or minus standard deviation. R1 = subregion of hypointense to mildly hyperintense T1-weighted signal intensity, R2 = subregion of moderately hyperintense T1-weighted signal intensity.
In the training TCIA cohort, our model had a concordance index score of 0.749, which means that, on average, it could correctly order the survival of two randomly selected patients three out of four times. The Kaplan-Meier plot of the two groups divided by the median-predicted hazard indicates that their survival difference was significant (log-rank test, P < .0001; hazard ratio, 0.743) (Fig 3).
Figure 3:
Graph shows Kaplan-Meier survival estimates for the training TCIA cohort, which were determined with the log-rank test (P < .0001; hazard ratio, 0.743).
Independent Validation
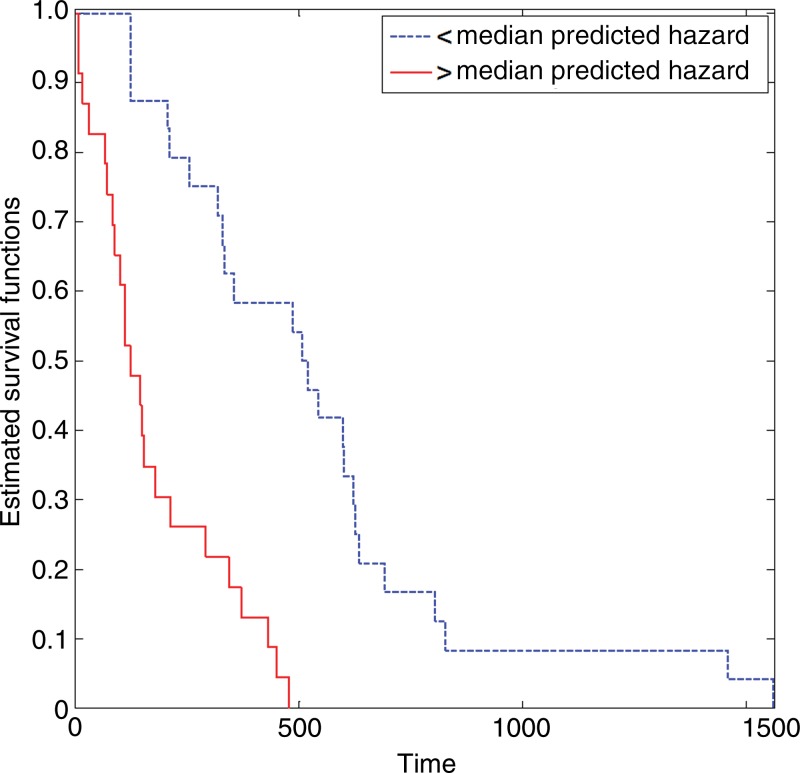
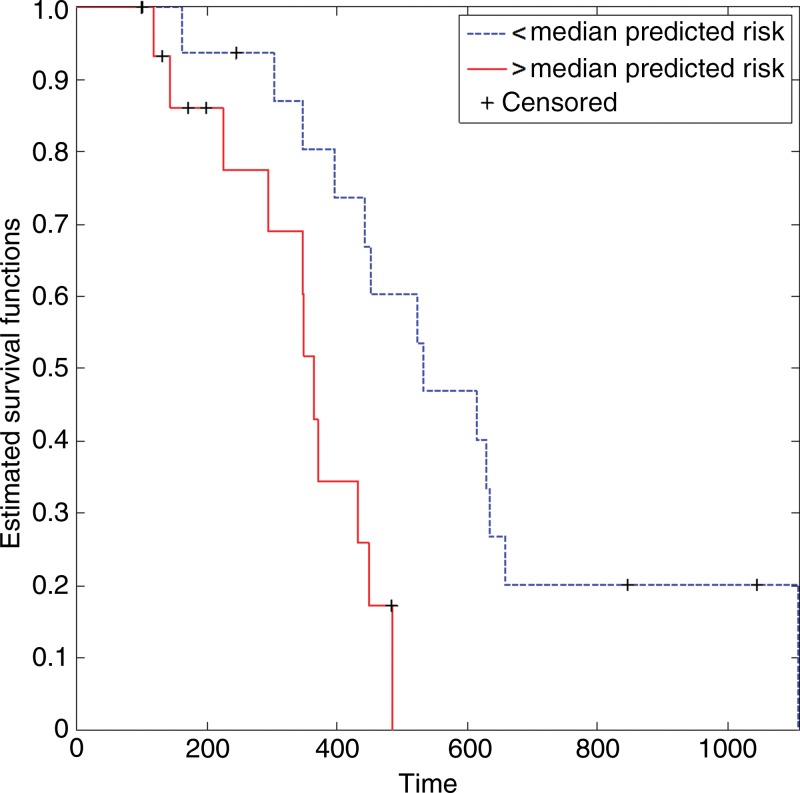
In the independent validation cohort, our prognostic model achieved a concordance index score of 0.674, meaning that it correctly predicted the order of survival of two randomly selected patients approximately two out of three times. This finding compared favorably with established prognostic factors, including age, tumor volume, and extent of resection (Table 4). After dividing the validation cohort into two equal-sized groups by the median-predicted hazard, results of the log-rank test revealed that the difference in OS distributions of these two groups were significant (P = .018; hazard ratio, 0.240), whereas separation based on conventional prognostic factors was not (Table 4) (Fig 4).
Table 4.
Prognostic Value of the Sparse Cox Model and Conventional Factors in the Validation Cohort

Note.—Data in parentheses are 95% confidence intervals.
Figure 4:
Graph shows Kaplan-Meier survival estimates for the independent validation cohort, which were determined with the log-rank test (P = .018; hazard ratio, 0.240).
When nine patients with unknown survival were excluded from the validation cohort (ie, they were still alive and censored at the last follow-up), our prognostic model achieved a slightly higher concordance index score of 0.698 and significant stratification of OS (P = .012) in the remaining 24 patients with known survival. Again, this outperformed age (concordance index, 0.545; P = .476), tumor volume (concordance index, 0.622; P = .201), and extent of resection (P = .591).
Discussion
In the current study, we identified several new imaging biomarkers that had prognostic value in predicting OS in patients with glioblastoma. The most dominant imaging feature was surface area, which quantifies both tumor extent and morphologic characteristics, as large tumors with spiculated surfaces tend to have large surface areas. Other imaging features characterize the statistical distributions of signal intensity pattern within the tumor and its subregions. When tested on an independent cohort, our model significantly improved upon known prognostic factors.
Our study represents several methodologic advances in analyzing GBM tumors at multiparametric MR imaging. First, a general method is presented for intratumor segmentation, which divides the tumor volume into spatially distinct regions that demonstrate coherent signal intensity patterns across multiparametric MR imaging. Because the segmentation is data driven rather than based on an a priori assumption of the compartments (eg, contrast enhancement, edema, and necrosis), these intratumor subregions may provide a more reliable representation of the microenvironmental selection forces that drive clonal evolution in a tumor (31). While similar data-driven approaches have been proposed, they usually rely on simple thresholding or clustering techniques that are solely based on signal intensity patterns and, consequently, yield nonintuitive results with widely dispersed and intermingled subregions (15–17). These approaches are also limited by technical factors, such as image noise and artifacts. By taking spatial constraints into consideration, our approach provides intratumor segmentations that are amenable to subsequent extraction of imaging features and high-throughput analysis. Another advancement of our work is an effective use of the differential contrast of multiparametric MR imaging. Here, the inherent covariance structure of multiparametric MR imaging is captured by the joint distribution or histograms of the multidimensional signal intensities, which, by definition, provide more information than do marginal histograms (ie, when imaging features are separately derived for each modality, as was done in previous studies).
Our study had a number of limitations. It was retrospective, and MR imaging data were acquired on a variety of imaging platforms with variable protocols and sequence parameters. It also consisted of two relatively small cohorts. Given the small number of patients in the discovery set, our analysis was limited to a moderate size of imaging features. Although we were able to validate the prognostic imaging biomarkers in a small independent cohort, this obviously needs to be further tested and confirmed in larger prospective cohorts.
Future studies may benefit from the combined use of anatomic and functional MR imaging. Several studies have demonstrated the prognostic importance of functional imaging biomarkers (eg, those derived from perfusion or diffusion-weighted MR imaging) (8,32). As more imaging modalities become routinely available, higher dimensional data pose important challenges for human interpretation solely on the basis of visual observation. The data-driven tools for multiregion segmentation presented here are designed to handle the complexity of high-dimensional data and should be valuable in future studies.
Advances in Knowledge
■ Multiregion quantitative analysis of multiparametric magnetic resonance (MR) imaging identified new prognostic imaging biomarkers in glioblastoma, which quantified tumor surface area and intensity distributions of the tumor and its subregions.
■ A prognostic model built on these five imaging biomarkers achieved a concordance index of 0.67 and significant stratification of overall survival with the log-rank test hh(P = .018) in an independent validation cohort, which outperformed conventional prognostic factors, such as age (concordance index, 0.57; P = .389) and tumor volume (concordance index, 0.59; P = .409).
Implication for Patient Care
■ Multiparametric MR imaging may be used to identify patients with aggressive glioblastoma and poor survival.
APPENDIX
SUPPLEMENTAL FIGURES
Acknowledgments
Acknowledgment
Part of the data used in this research were obtained from The Cancer Imaging Archive (TCIA), which is sponsored by the Cancer Imaging Program, DCTD/NCI/NIH.
Received February 20, 2015; revision requested April 20; revision received June 2; accepted June 12; final version accepted June 18.
Supported by the Global Institution for Collaborative Research and Education (GI-CoRE), Hokkaido University, funded by the Ministry of Education, Culture, Sports, Science and Technology, Japan.
Funding: This research was supported by the National Institutes of Health (grant 4R00CA166186).
Disclosures of Conflicts of Interest: Y.C. disclosed no relevant activities. K.K.T. disclosed no relevant activities. S.T. disclosed no relevant activities. S.Y. disclosed no relevant activities. J.W. disclosed no relevant activities. K.K. Activities related to the present article: disclosed no relevant activities. Activities not related to the present article: JSPS KAKENHI grant in aid for scientific research and personal fees from GE Healthcare, Hitachi Medical Systems, Philips Medical Systems, Toshiba Medical Systems, Canon Marketing Japan, and Bayer Healthcare. Other activities: disclosed no relevant activities. L.X. Activities related to the present article: disclosed no relevant activities. Activities not related to the present article: research grant from Varian Medical Systems. Other activities: disclosed no relevant activities. H.S. disclosed no relevant activities. R.L. disclosed no relevant activities.
Abbreviations:
- FLAIR
- fluid-attenuation inversion recovery
- GBM
- glioblastoma multiforme
- LASSO
- least absolute shrinkage and selection operator
- OS
- overall survival
- TCIA
- the Cancer Imaging Archive
References
- 1.Louis DN, Ohgaki H, Wiestler OD, et al. The 2007 WHO classification of tumours of the central nervous system. Acta Neuropathol (Berl) 2007;114(2):97–109. [DOI] [PMC free article] [PubMed] [Google Scholar]
- 2.Dolecek TA, Propp JM, Stroup NE, Kruchko C. CBTRUS statistical report: primary brain and central nervous system tumors diagnosed in the United States in 2005–2009. Neuro-oncol 2012;14(Suppl 5):v1–v49. [DOI] [PMC free article] [PubMed] [Google Scholar]
- 3.Stupp R, Mason WP, van den Bent MJ, et al. Radiotherapy plus concomitant and adjuvant temozolomide for glioblastoma. N Engl J Med 2005;352(10):987–996. [DOI] [PubMed] [Google Scholar]
- 4.Bonavia R, Inda MM, Cavenee WK, Furnari FB. Heterogeneity maintenance in glioblastoma: a social network. Cancer Res 2011;71(12):4055–4060. [DOI] [PMC free article] [PubMed] [Google Scholar]
- 5.Sottoriva A, Spiteri I, Piccirillo SG, et al. Intratumor heterogeneity in human glioblastoma reflects cancer evolutionary dynamics. Proc Natl Acad Sci U S A 2013;110(10):4009–4014. [DOI] [PMC free article] [PubMed] [Google Scholar]
- 6.Patel AP, Tirosh I, Trombetta JJ, et al. Single-cell RNA-seq highlights intratumoral heterogeneity in primary glioblastoma. Science 2014;344(6190):1396–1401. [DOI] [PMC free article] [PubMed] [Google Scholar]
- 7.Pope WB, Sayre J, Perlina A, Villablanca JP, Mischel PS, Cloughesy TF. MR imaging correlates of survival in patients with high-grade gliomas. AJNR Am J Neuroradiol 2005;26(10):2466–2474. [PMC free article] [PubMed] [Google Scholar]
- 8.Jain R, Poisson L, Narang J, et al. Genomic mapping and survival prediction in glioblastoma: molecular subclassification strengthened by hemodynamic imaging biomarkers. Radiology 2013;267(1):212–220. [DOI] [PMC free article] [PubMed] [Google Scholar]
- 9.Park JK, Hodges T, Arko L, et al. Scale to predict survival after surgery for recurrent glioblastoma multiforme. J Clin Oncol 2010;28(24):3838–3843. [DOI] [PMC free article] [PubMed] [Google Scholar]
- 10.Hammoud MA, Sawaya R, Shi W, Thall PF, Leeds NE. Prognostic significance of preoperative MRI scans in glioblastoma multiforme. J Neurooncol 1996;27(1):65–73. [DOI] [PubMed] [Google Scholar]
- 11.Gutman DA, Cooper LA, Hwang SN, et al. MR imaging predictors of molecular profile and survival: multi-institutional study of the TCGA glioblastoma data set. Radiology 2013;267(2):560–569. [DOI] [PMC free article] [PubMed] [Google Scholar]
- 12.Gevaert O, Mitchell LA, Achrol AS, et al. Glioblastoma multiforme: exploratory radiogenomic analysis by using quantitative image features. Radiology 2014;273(1):168–174. [DOI] [PMC free article] [PubMed] [Google Scholar]
- 13.Zinn PO, Mahajan B, Sathyan P, et al. Radiogenomic mapping of edema/cellular invasion MRI-phenotypes in glioblastoma multiforme. PLoS One 2011;6(10):e25451. [DOI] [PMC free article] [PubMed] [Google Scholar]
- 14.Zinn PO, Sathyan P, Mahajan B, et al. A novel volume-age-KPS (VAK) glioblastoma classification identifies a prognostic cognate microRNA-gene signature. PLoS One 2012;7(8):e41522. [DOI] [PMC free article] [PubMed] [Google Scholar]
- 15.Zhou M, Hall L, Goldgof D, et al. Radiologically defined ecological dynamics and clinical outcomes in glioblastoma multiforme: preliminary results. Transl Oncol 2014;7(1):5–13. [DOI] [PMC free article] [PubMed] [Google Scholar]
- 16.Caulo M, Panara V, Tortora D, et al. Data-driven grading of brain gliomas: a multiparametric MR imaging study. Radiology 2014;272(2):494–503. [DOI] [PubMed] [Google Scholar]
- 17.O’Connor JP, Rose CJ, Waterton JC, Carano RA, Parker GJ, Jackson A. Imaging intratumor heterogeneity: role in therapy response, resistance, and clinical outcome. Clin Cancer Res 2015;21(2):249–257. [DOI] [PMC free article] [PubMed] [Google Scholar]
- 18.Clark K, Vendt B, Smith K, et al. The Cancer Imaging Archive (TCIA): maintaining and operating a public information repository. J Digit Imaging 2013;26(6):1045–1057. [DOI] [PMC free article] [PubMed] [Google Scholar]
- 19.Klein S, Staring M, Murphy K, Viergever MA, Pluim JP. Elastix: a toolbox for intensity-based medical image registration. IEEE Trans Med Imaging 2010;29(1):196–205. [DOI] [PubMed] [Google Scholar]
- 20.Maubon AJ, Ferru JM, Berger V, et al. Effect of field strength on MR images: comparison of the same subject at 0.5, 1.0, and 1.5 T. RadioGraphics 1999;19(4):1057–1067. [DOI] [PubMed] [Google Scholar]
- 21.Hamamci A, Kucuk N, Karaman K, Engin K, Unal G. Tumor-cut: segmentation of brain tumors on contrast enhanced MR images for radiosurgery applications. IEEE Trans Med Imaging 2012;31(3):790–804. [DOI] [PubMed] [Google Scholar]
- 22.Menze B, Reyes M, Van Leemput K. The multimodal brain tumor image segmentation benchmark (BRATS). IEEE Trans Med Imaging 2014 Dec 4. [Epub ahead of print] [DOI] [PMC free article] [PubMed]
- 23.Dice LR. Measures of the amount of ecologic association between species. Ecology 1945;26(3):297–302. [Google Scholar]
- 24.Zhang Y, Brady M, Smith S. Segmentation of brain MR images through a hidden Markov random field model and the expectation-maximization algorithm. IEEE Trans Med Imaging 2001;20(1):45–57. [DOI] [PubMed] [Google Scholar]
- 25.Haralick RM, Shanmugam K, Dinstein I. Textural features for image classification. IEEE Trans Syst Man Cybern 1973;SMC-3(6):610–621. [Google Scholar]
- 26.Shrout PE, Fleiss JL. Intraclass correlations: uses in assessing rater reliability. Psychol Bull 1979;86(2):420–428. [DOI] [PubMed] [Google Scholar]
- 27.Tibshirani R. The lasso method for variable selection in the Cox model. Stat Med 1997;16(4):385–395. [DOI] [PubMed] [Google Scholar]
- 28.Harrell FE. Regression modeling strategies: with applications to linear models, logistic regression, and survival analysis. Springer Series in Statistics. New York, NY: Springer-Verlag, 2001. [Google Scholar]
- 29.Lacroix M, Abi-Said D, Fourney DR, et al. A multivariate analysis of 416 patients with glioblastoma multiforme: prognosis, extent of resection, and survival. J Neurosurg 2001;95(2):190–198. [DOI] [PubMed] [Google Scholar]
- 30.Yamaguchi S, Kobayashi H, Terasaka S, et al. The impact of extent of resection and histological subtype on the outcome of adult patients with high-grade gliomas. Jpn J Clin Oncol 2012;42(4):270–277. [DOI] [PubMed] [Google Scholar]
- 31.Gatenby RA, Grove O, Gillies RJ. Quantitative imaging in cancer evolution and ecology. Radiology 2013;269(1):8–15. [DOI] [PMC free article] [PubMed] [Google Scholar]
- 32.Akbari H, Macyszyn L, Da X, et al. Pattern analysis of dynamic susceptibility contrast-enhanced MR imaging demonstrates peritumoral tissue heterogeneity. Radiology 2014;273(2):502–510. [DOI] [PMC free article] [PubMed] [Google Scholar]
Associated Data
This section collects any data citations, data availability statements, or supplementary materials included in this article.


