Abstract
Health care workers are exposed to potentially infectious airborne particles while providing routine care to coughing patients. However, much is not understood about the behavior of these aerosols and the risks they pose. We used a coughing patient simulator and a breathing worker simulator to investigate the exposure of health care workers to cough aerosol droplets, and to examine the efficacy of face shields in reducing this exposure. Our results showed that 0.9% of the initial burst of aerosol from a cough can be inhaled by a worker 46 cm (18 inches) from the patient. During testing of an influenza-laden cough aerosol with a volume median diameter (VMD) of 8.5 μm, wearing a face shield reduced the inhalational exposure of the worker by 96% in the period immediately after a cough. The face shield also reduced the surface contamination of a respirator by 97%. When a smaller cough aerosol was used (VMD = 3.4 μm), the face shield was less effective, blocking only 68% of the cough and 76% of the surface contamination. In the period from 1 to 30 minutes after a cough, during which the aerosol had dispersed throughout the room and larger particles had settled, the face shield reduced aerosol inhalation by only 23%. Increasing the distance between the patient and worker to 183 cm (72 inches) reduced the exposure to influenza that occurred immediately after a cough by 92%. Our results show that health care workers can inhale infectious airborne particles while treating a coughing patient. Face shields can substantially reduce the short-term exposure of health care workers to large infectious aerosol particles, but smaller particles can remain airborne longer and flow around the face shield more easily to be inhaled. Thus, face shields provide a useful adjunct to respiratory protection for workers caring for patients with respiratory infections. However, they cannot be used as a substitute for respiratory protection when it is needed.
[Supplementary materials are available for this article. Go to the publisher's online edition of Journal of Occupational and Environmental Hygiene for the following free supplemental resource: tables of the experiments performed, more detailed information about the aerosol measurement methods, photographs of the experimental setup, and summaries of the experimental data from the aerosol measurement devices, the qPCR analysis, and the VPA.]
Keywords: airborne particulate matter, health care workers, infectious disease transmission, protective devices, respiratory infections/prevention, universal precautions
INTRODUCTION
Sprays and splashes of fluids containing infectious microorganisms present an occupational hazard for health care workers. Droplets of these fluids can be inhaled, land on broken skin, or deposit on mucus membranes in the mouth, nose, or eyes. Once there, the pathogens they carry may infect workers and cause illness. For this reason, the U.S. Health care Infection Control Practices Advisory Committee (HICPAC) recommends that a mask and eye protection be worn “during procedures and patient care activities likely to generate splashes or sprays of blood, body fluids, [or] secretions….”(1) However, although the requirement to wear a face shield or goggles while performing aerosol-generating procedures is well established, the need for such equipment to protect health care workers during routine care of patients with respiratory infections is the subject of debate. The current HICPAC guidelines explicitly recommend wearing a face shield or goggles during all patient care for certain illnesses such as severe acute respiratory syndrome (SARS) and avian influenza.(1) For other infections that may be spread by respiratory aerosol droplets, HICPAC recommends wearing a face mask but states that it has “no recommendation for routinely wearing eye protection (e.g., goggle or face shield), in addition to a mask, for close contact with patients who require Droplet Precautions. [This is an] unresolved issue.”(1)
One reason for the controversy surrounding a recommendation to wear goggles or a face shield while treating patients with respiratory infections is that little is known about the potential exposure to pathogen-laden droplets from these patients and the efficacy of different types of protective measures. This is particularly true for aerosols produced during coughing, which is one of the most common symptoms of respiratory tract infections. Coughing helps clear the airways of mucus and remove excess fluids from the lungs, especially when normal mechanisms of mucociliary clearance are impaired.(2) During a cough, droplets of airway secretions can become airborne and be expelled from the mouth in a high-velocity aerosol plume. The aerosol droplets generated during coughing span a broad size range, from tens of nanometers to hundreds of micrometers, and the dispersion of these droplets in the environment depends to a large degree upon their size.(3,4) Small aerosol droplets from a coughing patient can remain airborne and spread throughout a room, and can easily be inhaled by a health care worker.(5,6)
The potential for larger droplets to settle onto surfaces, impact on the face or eyes, or to be inhaled is not as well studied, and many questions remain. In early work, Wells estimated that droplets with a diameter of 100 μm or more will tend to settle rapidly to the ground before evaporating, while smaller droplets will evaporate and become “droplet nuclei,” remaining airborne much longer.(7) Nicas et al. later revised this with newer data on the composition of respiratory fluids and concluded that particles needed to have initial diameters less than 20 μm to become droplet nuclei.(4) In an early photographic study, Jennison found that the majority of visible droplets produced during coughing and sneezing travel only 2 to 3 feet from the mouth, but that some were able to travel much farther.(8) Using a numerical model, Xie et al. calculated that droplets as large as 200 μm could travel 1.5 m from a coughing patient before settling.(9) In an experimental study, Hamburger and Robertson showed that most bacteria from human sneezes were detected in droplets that settled within 1.5 feet of the test subject, but that some droplets settled as far as 9.5 feet away.(10) Bischoff et al. collected aerosol samples in hospital rooms with influenza patients; they found that influenza-laden particles with diameters greater than 4.7 μm could be found 6 feet away from the patient, but that the amount of virus detected was much lower than at closer distances.(11)
Face shields are one option for protecting the face from pathogen-laden droplets. Although they are more bulky than goggles or safety glasses, face shields offer the advantage of guarding the entire face from contamination.(12) Some workers also may find face shields more comfortable or find that they fit better over eyeglasses or respirators. Several studies have examined face shields after use during surgeries or other aerosol-generating medical and dental procedures as a way of demonstrating that an exposure risk exists and that face shields provide protection. These studies found that many or most of the face shields worn by the health care workers had splatters of blood or other fluids and that this contamination frequently went un-noticed.(13–17)
However, although these studies clearly demonstrate that face shields can intercept droplets traveling toward the face, they do not indicate which sizes of aerosol droplets are blocked and which are able to travel around the shield to be inhaled or deposited on the face. In addition, the studies all examined procedures in which significant droplet generation was expected, but none looked at potential exposure to aerosols from coughing patients with respiratory infections, about which less is known. During the 2009 H1N1 influenza pandemic, the Centers for Disease Control and Prevention (CDC) recommended that health care workers consider using face shields to reduce the surface contamination of respirators.(18) However, no data have been published showing how much exterior deposition of pathogens occurs or how effectively face shields decrease it. In its 2011 report on preventing transmission of pandemic influenza, the Institute of Medicine (IOM) urged the National Institute for Occupational Safety and Health (NIOSH) and other organizations to “investigate the effectiveness of face masks and face shields in preventing transmission of viral respiratory diseases.”(19)
The purpose of this study was to quantify the exposure of health care workers to cough aerosol droplets while working close to a patient and to examine the efficacy of face shields in reducing this exposure. Our results provide a better understanding of the health risks posed by infectious droplets produced by coughing patients and of the appropriate protective equipment in these situations. This work should assist the occupational and public health communities in providing research-based recommendations for effective strategies for the protection of workers in health care settings.
METHODS
Influenza Virus Culture
Madin-Darby canine kidney (MDCK) cells (ATCC CCL-34) and influenza strain A/WS/33 (H1N1, ATCC VR-825) were purchased from the American Type Culture Collection (ATCC, Manassas, Va.) and maintained as described previously.(20) The influenza virus was propagated in Complete Dulbecco's Modified Eagle Medium (CDMEM) consisting of Dulbecco's Modified Eagle medium, 100 U/ml penicillin G, 100 μg/ml streptomycin, 2 mM L-glutamine, 0.2% bovine serum albumin, and 25 mM HEPES buffer (Life Technologies, Grand Island, N.Y.).
Exposure Simulation Chamber
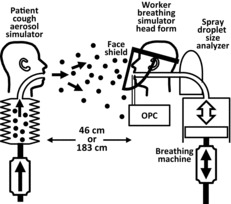
A schematic of the experimental setup is shown in Figure 1. Experiments to simulate the exposure of a health care worker to the aerosol droplets produced by a coughing patient were conducted in a 3.2 m long × 3.2 m wide × 2.3 m high environmental chamber.(6) The room included a HEPA filtration system to remove airborne particles before and after testing and an ultraviolet germicidal irradiation system to disinfect the chamber after influenza virus was used. During the experiments, the chamber was sealed and the filtration system was off, so that no air exchange or filtration occurred. The cough aerosol simulator, breathing simulator, and aerosol particle measurement instruments were controlled from outside the exposure chamber. During the aerosol particle measurement experiments, the chamber temperature was 24°C (SD 1.4°C) and the relative humidity was 21% (SD 5.9%). During the experiments using influenza virus, the chamber temperature was 24°C (SD 1.3°C) and the relative humidity was 23% (SD 3.3%).
FIGURE 1. Schematic of the experiment using particle spectrometers. The mouth of the cough aerosol simulator and the mouth of the breathing simulator were 152 cm (60 inches) above the floor and 46 cm (18 inches) or 183 cm (72 inches) apart. For experiments using influenza virus, the optical particle counters (OPCs) and the droplet size analyzer were not used, and a respirator was sealed to the breathing head form to act as a filter to collect the virus that was inhaled.
Cough Aerosol Simulator
The cough aerosol simulator used in these experiments has been described in detail previously.(21) The test aerosol was generated by aerosolizing CDMEM alone for the aerosol particle measurement experiments, and CDMEM containing influenza virus for the influenza virus experiments. For some experiments, an air brush (Model 200, Badger Air-Brush Co., Franklin, Ill.) was used to produce a cough aerosol with a volume median diameter (VMD) of 8.5 μm and a geometric standard deviation (GSD) of 2.9 (referred to here as the “large-particle cough aerosol”). For other experiments, a micropump nebulizer (Aeroneb AG-AL7000SM, Aerogen, Galway, Ireland) was used to produce an aerosol with a VMD of 3.4 μm and a GSD of 2.3 (“small-particle cough aerosol”). For both aerosol generators, the total volume of the aerosol expelled during each cough was approximately 68 μl. As described previously, the cough volume and amount of influenza virus expelled in each cough are considerably larger than those reported for human coughs.(21) This is necessary to allow detection of the airborne particles and influenza virus after the particles have dispersed in the test chamber. The cough airflow was produced by a metal bellows driven by a computer-controlled linear motor. It was based on coughs recorded from influenza patients and had a volume of 4.2 l and a peak flow rate of 11.4 liters per second (l/sec). The coughing and breathing simulators were synchronized so that each cough was initiated at the start of an inhalation by the breathing simulator.
Breathing Simulator
A digital breathing machine (Warwick Technologies Ltd., Warwick, U.K.) with a standard medium-sized head form (Sheffield model 189003, ISI, Lawrenceville, Ga.) was used to simulate a respiring health care worker. The breathing waveform was sinusoidal, with a flow rate of 32 liters per minute (l/min). For experiments using influenza virus in the cough aerosol, a N95 respirator was used as a collection filter for virus-laden particles that were inhaled by the breathing simulator. When a respirator collection filter was used, it was sealed to the head form with adhesive, and the respirator was tested for leaks with a standard respirator fit-testing device (Model 8038 PortaCount Pro Plus, TSI, Shoreview, Minn.). The head form was cleaned after experiments with influenza virus to disinfect it and to prevent transfer of residual virus to subsequent respirators.
Aerosol Particle Concentration Measurements
Two different types of instruments were used to measure aerosol concentrations. A spray droplet size analyzer (Spraytec Analyzer with a 300-mm lens and an Inhalation Cell, Malvern Instruments Ltd., Worcestershire, UK) was attached behind the breathing head form so that the concentration of aerosol particles inhaled during breathing could be measured (Figure 1). In addition, two optical particle counters (OPCs; Model 1.108, Grimm Technologies, Inc., Douglasville, Ga.) drew aerosol samples through vertical 16 cm × 3 mm inner-diameter stainless-steel tubes with inlets located 4.4 cm to the left and right of the mouth of the breathing simulator (Figure 1). When face shields were tested, the tube inlets were behind the face shield (that is, between the face shield and the head form). A more detailed discussion of the capabilities and limitations of these instruments in our experiments is given in the supplemental material.
Detection of Influenza Virus
For experiments using influenza virus, when the cough exposure and collection portion of the experiment was completed, the respirator collection filter was removed and four round 25-mm coupons were punched from it. The coupon locations were distributed across the front and side of the respirator to accommodate any variations in virus distribution on the respirator. The outermost layer of each coupon (referred to here as the “outer layer”) was separated from the middle and inner layers (referred to collectively as the “inner layers”) and the influenza virus was eluted from each coupon layer by overnight incubation in 2 ml of supplemented Hank's Balanced Salt Solution (HBSS) (Life Technologies, Grand Island, NY).(20) Virus was eluted from the face shields by cutting each shield into 8 sections, rolling the pieces into cylinders, placing the eight pieces sequentially in a 50-ml centrifuge tube with 5 ml of modified HBSS, and vortexing vigorously. Viral RNA was isolated from an aliquot of the elution medium, and the number of copies of the virus present in each sample was determined with quantitative real-time polymerase chain reaction (qPCR).(20) For the short range experiments with the large particle cough aerosol, viral plaque assays (VPAs) were performed to determine the amount of viable influenza virus recovered (Table S2 in the supplemental information).(20)
Data Analysis
For the experiments performed with the aerosol particle measurement instruments, the parameters studied were the presence or absence of a face shield, the distance between the simulators (46 cm or 183 cm), and the cough aerosol particle size distribution (large or small). The experiments performed with influenza virus had the same experimental parameters, with the addition of the collection time (5 minutes or 30 minutes). Lists of the experiments performed are shown in Tables S1 and S2 in the supplemental information.
For the data from the spray analyzer, the volume of aerosol inhaled by the breathing simulator was estimated by integrating the aerosol volume concentration and the breathing flow rate for 1.4 sec after the cough (corresponding to the inhalation part of the first breathing cycle after the cough). The mean and standard deviation of six experiments were calculated for each particle size bin, and the results were also summed over all of the size bins to get the total volume of inhaled aerosol. The volumes of particles inhaled during use of a large-particle cough aerosol versus a small-particle cough aerosol were compared by means of Student's t-test.
Since the OPCs measure the optical diameter and the number of airborne particles, the optical diameter was used to calculate an estimated particle volume based on the center diameter of each size bin, and the particle count data were then used to estimate the total volume of the aerosol in each size bin. The volume of aerosol inhaled by the breathing simulator from 1 min to 30 min after each cough was determined by integrating the volume concentration and the breathing rate (32 l/min) over time. For the OPC results, the effects of the use of a face shield, the cough aerosol particle size distribution, and the distance from the coughing to the breathing simulator on the total volume of particles inhaled were compared by means of an analysis of variance (ANOVA), with these three parameters treated as fixed effects. All main effects and two-factor interactions were tested. This procedure was also used to evaluate the OPC results for the VMD of the inhaled particles.
For the experiments using influenza virus, an N95 respirator was used as a collection filter for inhaled particles. Thus, we assumed that the simulated worker would have been exposed to any influenza virus found on the respirator if the respirator had not been worn. The four coupons taken from each respirator had an area of 4.9 cm2 each, whereas the entire respirator had an area of 137 cm2. Thus, the number of influenza virus copies found on the respirator coupons was multiplied by 6.98 to estimate the amount of virus on the entire respirator. Similarly, the area of the face shield was 548 cm2, of which 442 cm2 was used in the analyses, and so the number of virus copies found on the face shield sections was multiplied by 1.24. The qPCR results for the number of viruses inhaled and the amount of virus deposited in the different layers of the respirator were analyzed by means of an ANOVA, in which the use of a face shield, the distance, the cough particle size, the collection time, and the amount of virus deposited on each layer were treated as fixed effects. All main effects and the interaction between the use of a face shield and the layer deposition were tested. Differences were considered significant at a p value of ≤0.05.
RESULTS
Initial Exposure to Cough Aerosol Droplets
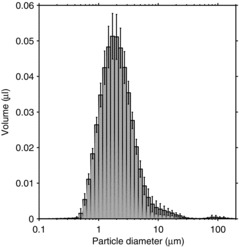
The size distribution of the aerosol inhaled during the first 1.4 sec after a cough when the simulators were 46 cm apart and a face shield was not worn is shown in Figure 2 for the large-particle cough aerosol. The inhaled aerosol particles had a total volume of 0.58 μl, a VMD of 9.5 μm, and a GSD of 3.4. For the small-particle cough aerosol, the size distribution of the inhaled particles is shown in Figure 3. In this case, the total volume of the inhaled particles was 0.52 μl, with a VMD of 2.1 and a GSD of 2.0. The difference in the total inhaled volume approached statistical significance (p = 0.069). However, although the volume of small-particle cough aerosol inhaled during the first 1.4 sec was lower than that of the large-particle aerosol, the concentration of the inhaled small-particle aerosol cloud typically remained high enough to be in the detection range of the spray analyzer for several seconds longer than did the large-particle aerosol. Therefore, it is likely that the difference in the total volume of aerosol inhaled was not significant.
FIGURE 2. Volume size distribution of the particles inhaled by the breathing simulator in 1.4 sec after a single large-particle cough. The mouths of the coughing and breathing simulators were 46 cm apart, and the breathing simulator was not wearing a face shield. The plot is the average of 6 coughs. The error bars show the standard deviation (SD).
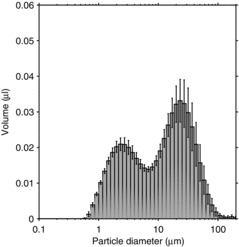
FIGURE 3. Volume size distribution of the particles inhaled by the breathing simulator in 1.4 sec after a single small-particle cough. The mouths of the coughing and breathing simulators were 46 cm apart, and the breathing simulator was not wearing a face shield. The plot is the average ±SD of 6 coughs.
The inhaled aerosol concentration was within the detection range of the spray analyzer only during those experiments in which the coughing and breathing simulators were 46 cm apart and no face shield was worn by the breathing simulator, and only during the first few seconds after a cough. For all other experiments, the concentration was below the detection threshold for the entire cough, and thus it was not possible to use the results from the spray analyzer to compare the effects of wearing or not wearing a face shield or increasing the distance between the simulators.
Long-Term Exposure to Cough Aerosol Droplets
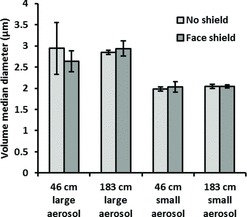
During use of the OPCs, the aerosol particle concentration exceeded the upper aerosol concentration limit of the instruments for up to 50 sec after each cough. For this reason, the first minute of aerosol concentration data from these instruments could not be used, and the analysis was limited to data collected from 1 min to 30 min after each cough. Exposure to the cough aerosol was characterized by an initial spike in concentration, followed by lower levels as the aerosol particles dispersed and settled over time. This can be seen in Figure 4 for the large-particle cough aerosol and in Figure 5 for the small-particle cough aerosol. The total volume of the aerosol particles inhaled by the breathing simulator under each test condition during the period from 1 min to 30 min after the cough can be seen in Figure 6. Wearing a face shield significantly reduced the amount of cough aerosol that was inhaled by the breathing simulator, while increasing the distance between the coughing and breathing simulators increased the aerosol inhalation during the 1 to 30 min time period (p < 0.001 for both). A greater volume of cough aerosol particles was inhaled during experiments using the small-particle aerosol than those using the large-particle aerosol (p < 0.001). Significant interactions occurred between face shield use and distance (p = 0.017), face shield use and cough aerosol particle size (p = 0.007), and particle size and distance (p = 0.006). The VMD of the inhaled aerosol is shown in Figure 7. Donning a face shield or increasing the distance between the simulators did not have a significant effect on the VMD (p = 0.702 and 0.505), and none of the interactions between factors were significant.
FIGURE 4. Volume concentration of airborne particles at the mouth of the breathing simulator from 1 to 30 min after a single large-aerosol particle cough. The plots are restricted to 1 min to 30 min after the cough because the aerosol concentration exceeded the upper limit of the instrument during the first 50 sec. Each line is the average of 3 tests. The lines were smoothed with a 61-point running average. Every 300th point is marked with a symbol to aid in distinguishing the lines.
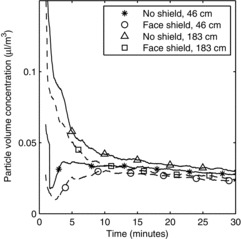
FIGURE 5. Volume concentration of airborne particles at the mouth of the breathing simulator from 1 to 30 min after a single small-aerosol particle cough. Each line is the average of 3 tests. The lines were smoothed with a 61-point running average. Every 300th point is marked with a symbol to aid in distinguishing the lines.
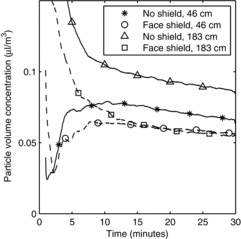
FIGURE 6. Volume of aerosol particles inhaled by the breathing simulator from 1 min to 30 min after a single cough. Each bar is the average ±SD of 3 experiments.
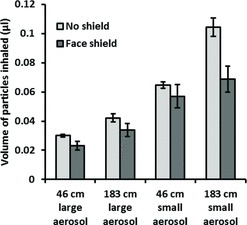
FIGURE 7. Volume median diameter of aerosol particles inhaled by the breathing simulator from 1 min to 30 min after a single cough. Each bar is the average ±SD of 3 experiments.
Exposure to Influenza Virus
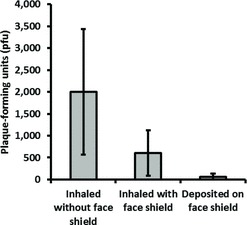
The amount of influenza virus that was inhaled by the breathing simulator and deposited on the face shield under the different test conditions is shown in Figure 8. Wearing a face shield and increasing the distance from the coughing to the breathing simulator both significantly reduced the amount of inhaled virus (p < 0.001 and p = 0.009), whereas changing the cough aerosol particle size or the collection time did not (p = 0.520 and 0.412). When the face shield was worn, the total amount of virus that was deposited on both the respirator and the face shield combined was also significantly less than the amount deposited on the respirator alone when the face shield was not worn (p = 0.001). The fraction of the influenza virus that was detected on the inner layers of the respirator compared to the total collected in all layers is shown in Figure 9. Employing a face shield significantly decreased the amount of virus that was deposited on the outer layer relative to the inner layers of the respirator (p < 0.001). The amount of viable influenza virus recovered from the respirator and the face shield is shown in Figure 10. The use of a face shield reduced the amount of viable virus on the respirator by 70%, although the difference was not statistically significant (p = 0.189).
FIGURE 8. Number of influenza virus copies inhaled by the breathing simulator or deposited on the face shield after a single cough. Each bar is the average ±SD of 3 experiments.
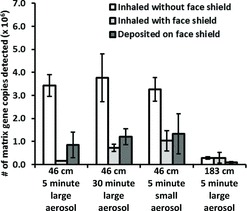
FIGURE 9. Amount of influenza virus that was detected in the inner layers of the respirator, compared to the total amount detected in all layers. These results are plotted as a ratio for ease of interpretation, but the absolute amount of virus collected at 183 cm was significantly less than collected at 46 cm (see Figure 8). Each bar is the average ±SD of 3 experiments.
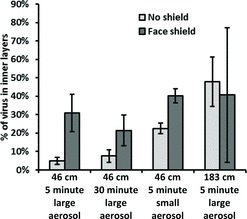
FIGURE 10. Amount of viable influenza virus inhaled by the breathing simulator or deposited on the face shield 5 min after a single large-aerosol particle cough. The coughing and breathing simulators were 46 cm apart. Each bar is the average ±SD of 3 experiments.
DISCUSSION
The exposure of health care workers to aerosol droplets while performing routine care of patients with respiratory infections is not well characterized. The efficacy of different types of personal protective equipment such as face shields against these aerosols when working at close range is also unclear. The purpose of this study is to gain a better understanding of the behavior of short-range cough aerosols, the potential risks they pose to health care workers, and the efficacy of face shields in reducing exposure.
The large-particle and small-particle cough aerosols from the cough simulator have a total particle volume of about 68 μl.(21) Using the spray analyzer on the breathing simulator, we found that about 0.9% of the large-particle cough aerosol and 0.8% of the small-particle cough aerosol was inhaled by the breathing simulator immediately after a cough when no face shield was worn and the simulators were 46 cm apart. The situation modeled here is a “worst-case” scenario, since it assumes a patient is coughing directly into the face of a health care worker at close range while the worker is inhaling. Nevertheless, these results do demonstrate the risk that a substantial exposure to respiratory fluid aerosols can occur very quickly when the caregiver is close to the patient.
The exposure measurements immediately after the cough were made while the cough aerosol particles were moving rapidly (the air velocity at the mouth of the coughing simulator peaks at about 32 m/sec). This aerosol included particles up to 100 μm in diameter, many of which would be expected to settle quickly after leaving the mouth (a 50-μm particle with a density of 1 g/cm2 will fall 1 m in about 13 sec). On the other hand, the long-term exposure measurements were made during the period from 1 min to 30 min after the cough, when the cough airflow had dissipated and the aerosol included mainly smaller particles that were able to remain airborne for an extended time and could flow more easily around a face shield. Consequently, using the face shield only caused a modest decrease in the inhalation of airborne particles over the long term (Figure 6). The results also indicate that the long-term exposure to the cough aerosol particles was actually somewhat higher when the breathing simulator was farther from the coughing simulator than when it was closer (183 cm vs. 46 cm). This may seem counterintuitive, especially given the results from the spray analyzer, but in fact this outcome reflects the dynamics of the movement of the cough aerosol over a longer time frame and the fact that the long-term exposure measurement does not include the first minute of the cough. When the coughing and breathing simulators are close together, the cough aerosol is concentrated in a fast-moving plume that quickly sweeps past the breathing simulator and is replaced by cleaner entrained air from the surrounding environment. On the other hand, when the coughing and breathing simulators are farther apart, the cough aerosol plume broadens and slows down before reaching the breathing simulator and thus remains in the vicinity longer. The difference in concentration decreases over time as the aerosol disperses more evenly throughout the room (Figure 4 and Figure 5).
It is interesting to compare the volume of the particles that were inhaled immediately after a cough to those inhaled from 1 min to 30 min after the cough, although three important caveats must be noted: First, the two instruments use different measurement methods. Second, the spray analyzer directly measures a region within the aerosol cloud, whereas the OPC draws a sample of the aerosol. Third, the spray analyzer measured the aerosol immediately after the cough, when many of the droplets were still wet, while the OPC measured particles that had time for evaporation and thus may have been smaller and more concentrated. Because of these limitations, the measurements must be compared cautiously, but they do suggest that the volume of aerosol inhaled during the first few seconds was about an order of magnitude larger than the quantity inhaled over the next 29 min.
The amount of influenza virus inhaled by the breathing simulator was substantially reduced by the use of a face shield. This effect was most pronounced for the large-particle cough aerosol when the simulators were 46 cm apart and the virus was collected for 5 min after a cough. In this case, the amount of virus on the respirator was 96% lower when a face shield was worn. Similar results for the inhalation of viable influenza virus were seen with the viral plaque assays, although the lower sensitivity of the VPA relative to PCR produced results that were less conclusive. After 30 min, the amount of virus collected when a face shield was worn was reduced by 81%, which suggests that over the long term the face shield has less of a protective effect because smaller particles are able to flow around it and accumulate over time. Similarly, the face shield also was less effective against the small-particle cough aerosol; virus deposition was reduced by only 68%, again because small particles are better able to travel around the face shield and be inhaled.
Extending the collection time from 5 min to 30 min increased the virus collection without a face shield by only 10%, which demonstrates that most of the virus deposition occurred immediately after the cough. This is consistent with findings from comparing the volumes of inhaled particles with use of the spray analyzer and OPCs, as discussed earlier. Increasing the distance between the simulators to 183 cm decreased the amount of virus inhaled by 92%, and the amount of virus collected was virtually the same with or without a face shield. These results indicate that, over the longer distance, the larger particles tended to slow down and fall toward the ground before they could reach the breathing simulator, while the smaller particles were able to traverse this distance and be inhaled. Note that the influenza virus collection occurred from 0 min to 5 min after each cough, when large particles were still airborne and could be collected. On the other hand, the particle counter results discussed above covered the time from 1 min to 30 min after a cough, when the large particles were no longer airborne. This difference in large particle collection explains why the particle counter results showed an increase in particle inhalation when the distance increased, while the influenza virus results showed a decrease in virus collection when the distance increased. An examination of the amount of virus deposited on the different layers of the respirator also shows that smaller particles are better able to evade a face shield. Larger aerosol particles are more likely to deposit on the outer layer of the respirator, while smaller particles are more likely to reach the inner layers. The use of a face shield reduced the fraction of the virus that deposited in the outer layer relative to the inner layers, which suggests that the aerosol reaching the respirator had a smaller average size.
As noted in the Introduction, during the 2009 H1N1 influenza pandemic the CDC recommended that health care workers consider using face shields to reduce the surface contamination of respirators.(18) Our results suggest that this would in fact be an effective strategy. In the large-particle cough experiments where the simulators were 46 cm apart and collection occurred for 5 min, the amount of influenza virus that was deposited on the outer mask layer was reduced by 97% when a face shield was worn. In fact, because our cough simulations were limited to aerosol particles up to 100 μm, the reduction in external contamination would likely be much greater in cases where patients were producing coughs or sneezes with larger spray droplets. For the small-particle cough aerosol, the surface contamination was reduced by 76%, again showing that face shields are most protective against larger particles.
Finally, the limitations of this study need to be acknowledged. First, aerosol measurements of human coughs show tremendous variation from person to person in the quantity and size distribution of the aerosol particles and the amount of pathogens that are expelled.(3,22–25) For this reason, it is impossible to define any particular cough aerosol profile as being representative of a human cough. Although the cough simulator generates aerosol outputs that are similar to human coughs,(21) they are only two possibilities among a multitude of potential human cough aerosol expulsions, and other cough profiles may produce different results. Second, the concentration of influenza virus in the cough aerosol from the simulator is likely to be about the same for droplets of all sizes, since the virus is dispersed in the test medium. This is unlikely to be the case for human cough aerosols because pathogens such as influenza are not uniformly distributed through the respiratory tract, and this distribution probably also varies with different microorganisms.
Third, it is not clear why a bimodal distribution (double peak) was seen in the inhaled large-particle cough aerosol results from the spray analyzer. The bimodal distribution was consistently present in the results for all coughs; the peak at the larger particle size generally dominated during the initial part of the cough and inhalation, while the peak at the smaller size dominated later in the cough (data not shown). Until this aspect of the results is better understood, it should be interpreted with caution. Fourth, the test chamber was sealed so that no air exchange or filtration occurred during the experiments. Air filtration or exchange would be expected to reduce the long-term exposure to airborne particles, and room airflow patterns could also affect exposure.(5) Finally, these experiments were conducted with the breathing simulator and the face shield facing directly toward the coughing simulator. Although this is probably the most common situation, it is not difficult to imagine scenarios where, for example, the head of a health care worker might be tilted up or sideways, away from a supine patient, to examine a monitor or adjust an IV bag. In that case, a cough could easily enter below or from the side of the face shield and impinge more directly on the face of the worker.
CONCLUSION
The possible risks to health care workers from exposure to cough-generated aerosols during routine patient care are not well characterized. Although it is agreed that workers need respiratory protection while treating patients with certain diseases that are known to be transmitted by airborne particles, the utility of protective devices such as face shields under these conditions is less clear. Our results show that considerable exposures of workers to potentially infectious material can occur over very short time frames when they examine or treat a coughing patient at close range. The use of face shields can substantially reduce the short-term exposure of health care workers to larger infectious aerosol particles and can reduce contamination of their respirators. They are less effective against smaller particles, which can remain airborne for extended periods and can easily flow around a face shield to be inhaled. Thus, face shields can provide a useful adjunct to respiratory protection for workers caring for patients with respiratory infections. However, they cannot be used as a substitute for respiratory protection when it is needed.
ACKNOWLEDGMENT
The authors thank David H. Edgell of the National Institute for Occupational Safety and Health (NIOSH) for manufacturing parts for the cough aerosol simulator.
DISCLAIMER
The findings and conclusions in this report are those of the authors and do not necessarily represent the views of the National Institute for Occupational Safety and Health. This article is not subject to US copyright law.
Supplementary Material
REFERENCES
- Siegel J.D., Rhinehart E., Jackson M., and Chiarello L.: 2007. Guideline for isolation precautions: Preventing transmission of infectious agents in health care settings. Am. J. Infect. Control 35(10 Suppl 2):S65–164 (2007). [DOI] [PMC free article] [PubMed] [Google Scholar]
- McCool F.D.: Global physiology and pathophysiology of cough: ACCP evidence-based clinical practice guidelines. Chest 129(1 Suppl):48S–53S (2006). [DOI] [PubMed] [Google Scholar]
- Gralton J., Tovey E., McLaws M.L., and Rawlinson W.D.: The role of particle size in aerosolised pathogen transmission: A review. J. Infect. 62(1):1–13 (2011). [DOI] [PMC free article] [PubMed] [Google Scholar]
- Nicas M., Nazaroff W.W., and Hubbard A.: Toward understanding the risk of secondary airborne infection: Emission of respirable pathogens. J. Occup. Environ. Hyg. 2(3):143–154 (2005). [DOI] [PMC free article] [PubMed] [Google Scholar]
- Lindsley W.G., King W.P., Thewlis R.E., et al. : Dispersion and exposure to a cough-generated aerosol in a simulated medical examination room. J. Occup. Environ. Hyg. 9(12):681–690 (2012). [DOI] [PMC free article] [PubMed] [Google Scholar]
- Noti J.D., Lindsley W.G., Blachere F.M., et al. : Detection of infectious influenza virus in cough aerosols generated in a simulated patient examination room. Clin. Infect. Dis. 54(11):1569–1577 (2012). [DOI] [PMC free article] [PubMed] [Google Scholar]
- Wells W.F.: On Air-borne infection: Study II. Droplets and droplet nuclei. Am. J. Hyg. 20(3):611–618 (1934). [Google Scholar]
- Jennison M.W.: Atomizing of Mouth and Nose Secretions into the Air as Revealed by High-Speed Photography. In Aerobiology, Moulton F.R. (ed.). Washington, D.C.: American Association for the Advancement of Science, 1942. pp. 106–128. [Google Scholar]
- Xie X., Li Y., Chwang A.T., Ho P.L., and Seto W.H.: How far droplets can move in indoor environments—Revisiting the Wells evaporation-falling curve. Indoor Air 17(3):211–225 (2007). [DOI] [PubMed] [Google Scholar]
- Hamburger M., Jr., and Robertson O.H.: Expulsion of group a hemolytic streptococci in droplets and droplet nuclei by sneezing, coughing and talking. Am. J. Med. 4(5):690–701 (1948). [DOI] [PubMed] [Google Scholar]
- Bischoff W.E., Swett K., Leng I., and Peters T.R.: Exposure to influenza virus aerosols during routine patient care. J. Infect. Dis. 207(7):1037–1046 (2013). [DOI] [PubMed] [Google Scholar]
- National Institute of Occupational Health and Safety(NIOSH) : "Eye Safety. Eye Protection for Infection Control.” Available at http://www.cdc.gov/niosh/topics/eye/eye-infectious.html (accessed March 18, 2013). [Google Scholar]
- Kouri D.L., and Ernest J.M.: Incidence of perceived and actual face shield contamination during vaginal and cesarean delivery. Am. J. Obstet. Gynecol. 169(2 Pt 1):312–315; . discussion 315–316 (1993). [DOI] [PubMed] [Google Scholar]
- Collins D., Rice J., Nicholson P., and Barry K.: Quantification of facial contamination with blood during orthopaedic procedures. J. Hosp. Infect. 45(1):73–75 (2000). [DOI] [PubMed] [Google Scholar]
- Endo S., Kanemitsu K., Ishii H., et al. : Risk of facial splashes in four major surgical specialties in a multicentre study. J. Hosp. Infect. 67(1):56–61 (2007). [DOI] [PubMed] [Google Scholar]
- Ishihama K., Iida S., Koizumi H.,: High incidence of blood exposure due to imperceptible contaminated splatters during oral surgery. J. Oral Maxillofac. Surg. 66(4):704–710 (2008). [DOI] [PubMed] [Google Scholar]
- Wines M.P., Lamb A., Argyropoulos A.N., Caviezel A., Gannicliffe C., and Tolley D.: Blood splash injury: An underestimated risk in endourology. J. Endourol. 22(6):1183–1187 (2008). [DOI] [PubMed] [Google Scholar]
- Centers for Disease Control and Prevention(CDC) : "Questions & Answers Regarding Respiratory Protection for Infection Control Measures for 2009 H1N1 Influenza among Health care Personnel". Available at http://www.cdc.gov/h1n1flu/guidance/ill-hcp_qa.htm (accessed March 20, 2013). [Google Scholar]
- Institute of Medicine(IOM) : Preventing Transmission of Pandemic Influenza and Other viral Respiratory Diseases: Personal Protective Equipment for Health care Personnel. Update 2010., Larson E.L. and Liverman C.T. (eds.),Institute of Medicine, 2011. [PubMed] [Google Scholar]
- Blachere F.M., Cao G., Lindsley W.G., Noti J.D., and Beezhold D.H.: Enhanced detection of infectious airborne influenza virus. J. Virol. Methods 176(1–2):120–124 (2011). [DOI] [PubMed] [Google Scholar]
- Lindsley W.G., Reynolds J.S., Szalajda J.V., Noti J.D., and Beezhold D.H.: A cough aerosol simulator for the study of disease transmission by human cough-generated aerosols. Aerosol Sci. Technol. 47(8):937–944 (2013). [DOI] [PMC free article] [PubMed] [Google Scholar]
- Lindsley W.G., Pearce T.A., Hudnall J.B., et al. : Quantity and size distribution of cough-generated aerosol particles produced by influenza patients during and after illness. J. Occup. Environ. Hyg. 9(7):443–449 (2012). [DOI] [PMC free article] [PubMed] [Google Scholar]
- Lindsley W.G., Blachere F.M., Thewlis R.E., et al. : Measurements of airborne influenza virus in aerosol particles from human coughs. PLoS ONE 5(11):e15100 (2010). [DOI] [PMC free article] [PubMed] [Google Scholar]
- Escombe A.R., Moore D.A., Gilman R.H., et al. : The infectiousness of tuberculosis patients coinfected with HIV. PLoS Med. 5(9):e188 (2008). [DOI] [PMC free article] [PubMed] [Google Scholar]
- Jones-Lopez E.C., Namugga O., Mumbowa F., et al. : Cough aerosols of Mycobacterium tuberculosis predict new infection: A household contact study. Am. J. Respir. Crit. Care Med. 187(9):1007–1015 (2013). [DOI] [PMC free article] [PubMed] [Google Scholar]
Associated Data
This section collects any data citations, data availability statements, or supplementary materials included in this article.


