Abstract
The alloy Au–Ag system is an important noble bimetallic phase, both historically (as “Electrum”) and now especially in nanotechnology, as it is applied in catalysis and nanomedicine. To comprehend the structural characteristics and the thermodynamic stability of this alloy, a knowledge of its phase diagram is required that considers explicitly its size and shape (morphology) dependence. However, as the experimental determination remains quite challenging at the nanoscale, theoretical guidance can provide significant advantages. Using a regular solution model within a nanothermodynamic approach to evaluate the size effect on all the parameters (melting temperature, melting enthalpy, and interaction parameters in both phases), the nanophase diagram is predicted. Besides an overall shift downward, there is a “tilting” effect on the solidus–liquidus curves for some particular shapes exposing the (100) and (110) facets (cube, rhombic dodecahedron, and cuboctahedron). The segregation calculation reveals the preferential presence of silver at the surface for all the polyhedral shapes considered, in excellent agreement with the latest transmission electron microscopy observations and energy dispersive spectroscopy analysis. By reviewing the nature of the surface segregated element of different bimetallic nanoalloys, two surface segregation rules, based on the melting temperatures and surface energies, are deduced. Finally, the optical properties of Au–Ag nanoparticles, calculated within the discrete dipole approximation, show the control that can be achieved in the tuning of the local surface plasmon resonance, depending of the alloy content, the chemical ordering, the morphology, the size of the nanoparticle, and the nature of the surrounding environment.
Keywords: nanothermodynamics, phase diagram, surface segregation, thermal properties, optical properties, aberration corrected electron microscopy, noble metals, polyhedra
The term “Electrum” denotes the native gold–silver alloy that provided humanity with some of its first experiences with metallurgy. Its surface abundance in prominent locations of antiquity, mainly in the Upper Nile River Valley, is reflected in archeological findings pertaining to the earliest civilizations, beginning in the third millennium BC in ancient Egypt.1 In early Western Civilization, Electrum was mentioned already in Homeric Poems (Iliad)2 describing the Trojan war between Greeks and the defenders of the city of Troy in Lydia (modern western part of Turkey). The Lydians were the first people to mint coins fashioned from Electrum during the reign of Croesus. Primary uses of Electrum were naturally jewelry as well as other adornments for decorative arts3 and coinage for financial transactions and storage of wealth.4,5 Its eminent suitability for such applications derives from its availability at the earth’s surface (minimal mining required), its facile workability (minimal metallurgical treatment, no smelting required), and its high nobility. Remarkably, its high silver content was then considered important to its value, as the scarcity of accessible silver in Asia Minor6 meant that one part of gold was equal in value to two and one-half parts of silver.7
Nowadays, the interest in ancient bimetallic materials such as Tumbaga(8) and Electrum still remains since those alloys have different physical and chemical properties compared to their individual constitutive metallic elements. Beside this composition dependence, we have three additional knobs of freedom at the nanoscale, that is, size,9 morphology,10 and segregation/ordering,11 playing a major role in the properties of the nanoalloy.12,13 To fully understand the behavior of bimetallic nanomaterials, a knowledge of the phase diagram is required.14 In fact, the phase diagram is a fundamental starting point when performing materials research in such fields as nanotechnology because it undergoes modifications compared to its bulk counterpart due essentially to the importance of the surface in the nanoscale regime. Bulk phase diagrams were previously determined by costly experimental procedure; nevertheless, this method cannot be pursued for nanoalloys because calorimetry is still challenging at the nanoscale.15,16 Consequently, a theoretical approach is required. Bulk alloys were adequately described within the frame of classical thermodynamics and statistical physics in which the number of atoms and the volume are very large. However, the situation is different for nanoalloys in which the number of atoms is small. In fact, changes in the volume only affects extensive properties while intensive properties remain unchanged, consequently small systems are no longer extensive due to surface effects. Thus, we cannot use classical thermodynamics at the nanoscale for which the extensive state functions are no longer linearly proportional to the number of particles.17,18 Therefore, considering the size of the system as a variable is central to applying thermodynamics at the nanoscale (named as “nano-thermodynamics”) and this initiative was launched by Hill in the sixties.19,20 Nowadays, nanothermodynamics18 is recognized as a fundamental approach to predict the phase diagrams of nanoalloys over the entire composition range since other methods such as Density Functional Theory (DFT),21,22 Molecular Dynamics, (MD)23,24 and Metropolis Monte Carlo (MMC)25 simulations are restricted to a limited number of atoms.26 Therefore, nanothermodynamics appears as a complementary approach to determine some fundamental issues in the behavior of nanoalloys.8,18,27 Although, experimentally, the final properties of nanoparticles synthesized chemically are mainly governed by kinetic considerations; their binary phase diagram, obtained from the temperature state function versus the alloy composition, describes an equilibrium situation and therefore does not depend on the way to reach the equilibrium. Kinetics will favor the growth of one shape over another but as soon as the equilibrium shape is reached, its properties are described by the corresponding binary phase diagram.
Among bimetallic materials, noble metals play a major role.28,29 The noble metals consist of 4d (Ag, Pd, Rh, Ru) and 5d (Au, Pt, Ir, Os) elements. The increasing filling of d orbitals going from the left to the right in the periodic table and the increasing cohesive energy value down a group of the periodic table determine silver and gold as the noblest metals.30 At the nanoscale, as the surface to volume ratio increases, a greater amount of the material can come into contact with the surroundings, moreover more atoms are present at the edges and corners of the structure, thus presenting a lower coordination number and then a higher reactivity.9 Indeed, at this scale, the cohesive energy is reduced and the electrons’ motion is confined, making then gold and silver more sensible to interactions.9 Under the action of an electromagnetic field, the electron cloud of these nanoparticles can undergo a coherent collective oscillation movement called plasmon, particularly attractive for optical applications.31,32 The synergy between these two metals is also highly desirable to enhance the functionality and potential applications of those metals in catalysis and medicine.29 In fact, it is used to catalyze the CO oxidation,33,34 as well as to probe cancer cells.35
A first paper considering the size effect on the Au–Ag phase diagram of a spherical nanoparticle has already been published by Park et al.36 by using the CALPHAD method. The first goal of the present paper is to build on this work by considering size, shape, and segregation effects on the phase diagrams of various Au–Ag polyhedral nanoparticles, namely, the tetrahedron, cube, octahedron, decahedron, dodecahedron, rhombic dodecahedron, truncated octahedron, cuboctahedron, and icosahedron at different sizes (10 and 4 nm). The second goal is to present two new segregation rules to determine the nature of the segregated element at the surface of bimetallic nanoalloys. Finally, the third goal is to predict the optical properties of the Au–Ag nanoalloy for various sizes, shapes, compositions, chemical ordering, and surrounding environments.
Results and Discussion
At the bulk scale, the Au–Ag system forms a totally miscible alloy in the solid phase according to the Hume–Rothery rules;37 that is, the atomic radius, crystal structure, valence, and electronegativity of gold and silver are similar (Table 1). Consequently, this system (called isomorphous) forms the simplest possible binary phase diagram, exhibiting a lens-shape in the temperature–composition plot. The diagram consists then of three regions. At high temperature, there is a liquid solution while at low temperature, there is a solid solution. Within the lens region, there is a mixture of solid and liquid phases. The liquidus is defined as the curve above which the system is fully liquid while the solidus is defined as the curve below which the system is fully solid. The liquidus and solidus curves have to meet each other at the two ends of the phase diagram, corresponding to the two pure elements of the considered system, gold and silver. Using a regular solution model to explicitly consider a nonzero enthalpy of mixing, the solidus–liquidus curves are calculated by the following set of equations:38,39
 |
1 |
Here xsolidusA (xliquidus) denote the compositions of the solid (liquid) phases of silver (A) at given temperature T; TmA and Tm denote the size-dependent melting temperatures of silver (A) and gold (B); ΔHmA and ΔHm denote their respective size-dependent melting enthalpies; Ωl and Ωs are the respective size-dependent interactions parameters in the liquid and solid phases; and R is the characteristic ideal gas constant.
Table 1. Material Properties Used to Calculate the Phase Diagrams at the Nanoscale.
| material properties | Au | Ag |
|---|---|---|
| crystal structure61 | fcc | fcc |
| Tm,∞ (K)61 | 1337 | 1235 |
| ΔHm,∞ (kJ/mol)61 | 12.552 | 11.297 |
| γl (J/m2)61 | 1.128 | 0.923 |
| γs,111 (J/m2)62 | 1.283 | 1.172 |
| γs,100 (J/m2)62 | 1.627 | 1.200 |
| γs,101 (J/m2)62 | 1.700 | 1.238 |
| Ωl (kJ/mol)41 | –15.599 | |
| Ωs (kJ/mol)41 | –16.402 | |
| atomic radius (pm)61 | 134 | 134 |
| electronic affinity (eV)61 | 2.31 | 1.30 |
| 1st ionization energy (eV)61 | 9.23 | 7.58 |
| χ, Mulliken electronegativity (eV)* | 5.77 | 4.44 |
| ΔHv,∞, molar heat of vaporization (kJ/mol)61 | 334.400 | 250.600 |
The Mulliken electronegativity is defined as the mean value between the electronic affinity and the first ionization energy.
To calculate the phase diagram at the nanoscale, the size-dependent parameters TmA, Tm, ΔHmA, ΔHm, Ωl, and Ωs are calculated through eq 2(40) which considers the internal structure of the material, in this case the face centered cubic (fcc) structure of both elements, gold and silver, as well as the external structure (shape and surface properties) of the particle.
| 2 |
Here X(hkl) denotes a set of factors equal to {1/2, √2/4, √3/3} in the fcc case, for the {100, 110, 111} faces, respectively. γl and γs are the respective surface energies in the liquid and solid state; a is the bulk lattice parameter; and Nsurf/Ntot is the ratio of surface to total atoms.
The bulk Au–Ag phase diagram is calculated from the set of eqs 1 and presented in Figure 1. It is clear that the phase diagram is very well described at the bulk scale by a regular solution model meaning that the parameters Ωl and Ωs describing the interactions inside the liquid and solid states, respectively, are adequate.41 To the best of our knowledge, no more recent Ωl and Ωs values describing the interactions between silver and gold in both states have been published in the literature since 1988. Both interaction parameters have negative values, meaning that the formation of the alloy between both elements, silver and gold, is favored. The topological changes on the phase diagram due to different values of interaction parameters have been discussed in detail by Tanaka et al.42 and Lee et al.43
Figure 1.
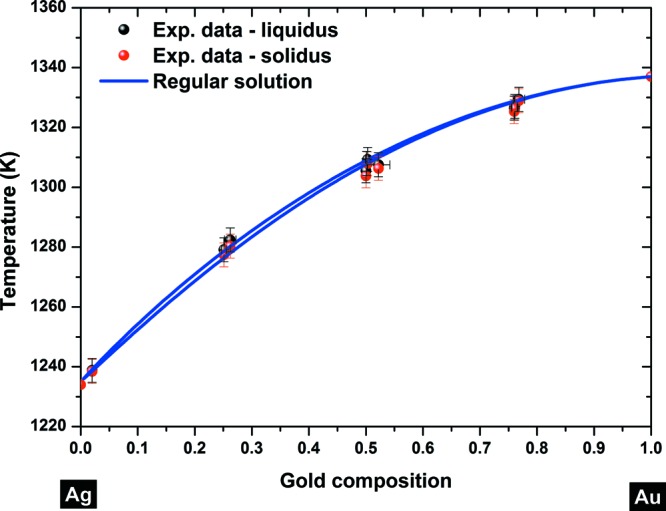
Bulk phase diagram of the gold–silver alloy. Experimental points are taken from ref (63). The liquidus–solidus curves are plotted using the regular solution model (eq 1).
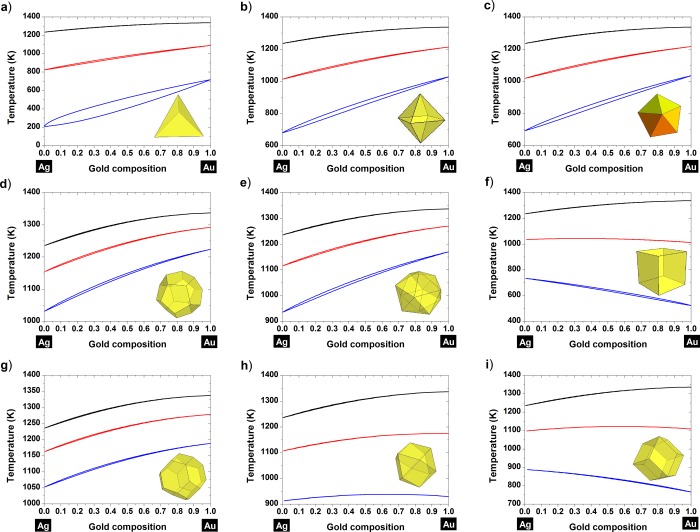
To plot the Au–Ag phase diagram at the nanoscale for various polyhedral shapes (Figure 2), the size and shape effects on the following set of parameters {TmA, Tm, ΔHmA, ΔHm, Ωl, Ωs} have to be evaluated through eq 2 and inserted into eq 1. From Figure 2, it is evident that the entire phase diagram is shifted down with size for each investigated shape; that is, the liquid phase region of the phase diagram is enlarged as the size of the particle becomes smaller. Moreover, we demonstrate the existence of a “tilting” effect for some particular shapes , that is, cube (Figure 2f), rhombic dodecahedron (Figure 2i), and cuboctahedron (Figure 2h). The tilting effect observed on those shapes can be understood by looking at the facets involved. In fact, the stronger size effect observed for gold compared to silver is due to a higher surface energy difference between the facets involved in the cube (all (100) facets), the rhombic dodecahedron (all (110) facets) and the cuboctahedron (mix of (111) and (100) facets) compared to the liquid state (Table 1). However, the tilting effect is not apparent for the truncated dodecahedron due to a higher proportion of (111) facets compared to (100) facets. It is very interesting to note that the tilting behavior has also been noticed by Chen et al.44 when they investigated the melting behavior of a 55-atom Au–Ag cluster by MD using a Gupta many-body potential. In fact, they revealed a decreasing melting temperature with increasing Au content in the case of an icosahedral morphology. It has also been noticed by Nanda et al.45 that gold exhibits an anomalous behavior compared to silver. In fact, they noticed that the temperature of evaporation of gold nanoparticles was lower compared to the ones of silver nanoparticles investigated under the same conditions. Melting and evaporation being both a measurement of thermal stability, it is now possible to link this observation to our investigation concluding that the tilting effect observed on the phase diagram is responsible for the observed behavior.
Figure 2.
Nanophase diagrams of gold–silver for various shapes of polyhedra: (a) tetrahedron, (b) octahedron, (c) decahedron, (d) dodecahedron, (e) icosahedron, (f) cube, (g) truncated octahedron, (h) cuboctahedron, and (i) rhombic dodecahedron. The black, red, and blue curves indicate the bulk, 10 and 4 nm behavior of the alloy, respectively.
To consider the segregation at the surface of binary nanoalloys, the Williams–Nason’s model46 is used since it is based on the knowledge of the thermodynamic properties of the bulk rather than on the surface. Actually, it is constructed on a bond-breaking concept allowing the nonequivalence of different sites at the surface and in the bulk. The solidus and liquidus curves at the surface of the alloy are given by the following equations:
 |
3a |
 |
3b |
Here xsoliduscore and xliquidus are the bulk solidus and liquidus composition given by the set of eqs 1; that is, when segregation is not considered. ΔHvap = |ΔHv,A – ΔHv,B| is the absolute difference in the enthalpy of vaporization of the two pure elements. ΔHsub = |ΔHs,A – ΔHs,B| is the absolute difference in the enthalpy of sublimation of the two pure elements. z1v/zv is the fraction of nearest neighbor atoms missing for atoms in the first layer (for atoms belonging to a (111) face in a fcc structure, z1v/zv = 0.25).
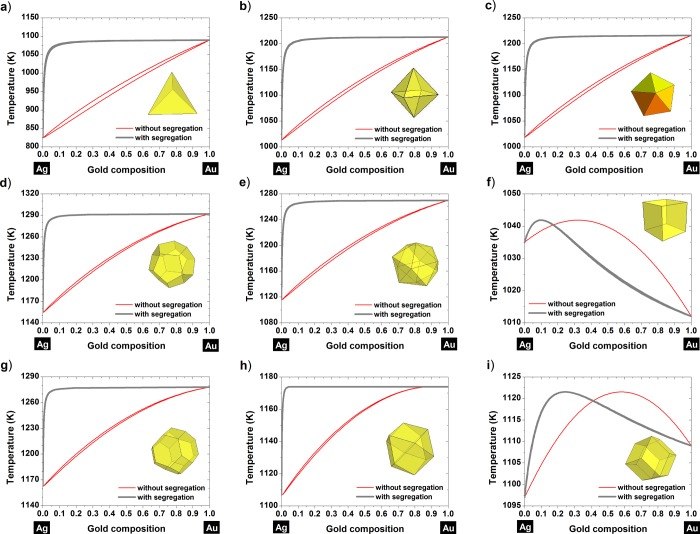
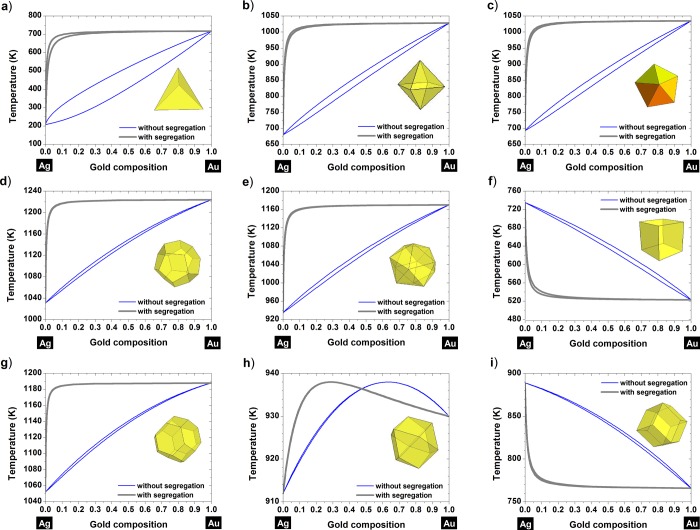
It is clear from Figures 3 and 4 that silver is preferentially found at the surface for all the shapes investigated. Actually, at a given temperature, the liquidus–solidus curves are shifted toward compositions richer in silver when moving from the core (curves without segregation) to the surface (curves with segregation). At small scales, the surface segregation of silver is then in agreement with the MMC simulations performed by Deng et al.47 on Au–Ag nanoparticles for which the size ranges from 2.5 nm until 7.2 nm. This has also been confirmed on a 34-atom and a 38-atom Au–Ag cluster by Rossi et al.48 using a semiempirical potential and by Curley et al.49 using a Gupta many-body potential coupled with a genetic algorithm search technique, respectively. Another study, using a genetic algorithm global optimization approach coupled with DFT showed that the chemical ordering exhibiting an Aucore–Agshell structure is favored for sizes below 68 atoms.50 It seems that for smaller clusters, gold can be promoted to the surface if a charge transfer occurs between Ag and Au.51,52
Figure 3.
Nanophase diagrams showing the segregated and nonsegregated liquidus–solidus curves at a size equal to 10 nm for various shapes: (a) tetrahedron, (b) octahedron, (c) decahedron, (d) dodecahedron, (e) icosahedron, (f) cube, (g) truncated octahedron, (h) cuboctahedron, and (i) rhombic dodecahedron.
Figure 4.
Nanophase diagrams showing the segregated and nonsegregated liquidus-solidus curves at a size equal to 4 nm for various shapes: (a) tetrahedron, (b) octahedron, (c) decahedron, (d) dodecahedron, (e) icosahedron, (f) cube, (g) truncated octahedron, (h) cuboctahedron, and (i) rhombic dodecahedron.
Particularly, for the following shapes, the cube (Figure 3f, Figure 4f), the rhombic dodecahedron (Figure 3i, Figure 4i) and the cuboctahedron (Figure 4h), the tilting effect undergone by the liquidus-solidus curves does not affect the segregated element; for those shapes, silver is still the element found at the surface. For the cuboctahedron with a length size equal to 4 nm, we can see that the tilting effect is not complete, nevertheless, silver is always predicted to be the element segregated to the surface. Furthermore, there is a zone in which there is no segregation, and in that composition range the alloy behaves like a pure element, exhibiting a congruent behavior, similar to the one found in the Au–Cu alloy.8 From Figures 3 and 4, it seems that thermodynamically, gold will never diffuse at the surface. The surface composition is determined by the dimensionless difference in the heat of sublimation of gold and silver, ΔHsub/kT. So theoretically, we varied ΔHsub/kT which controls surface segregation and plotted the corresponding segregated liquidus–solidus curves into Figure 5. From this graph, we can conclude that silver will always be at the surface whatever the value of ΔHsub/kT is. This remains valid whatever the considered shape is, among those investigated in this manuscript.
Figure 5.
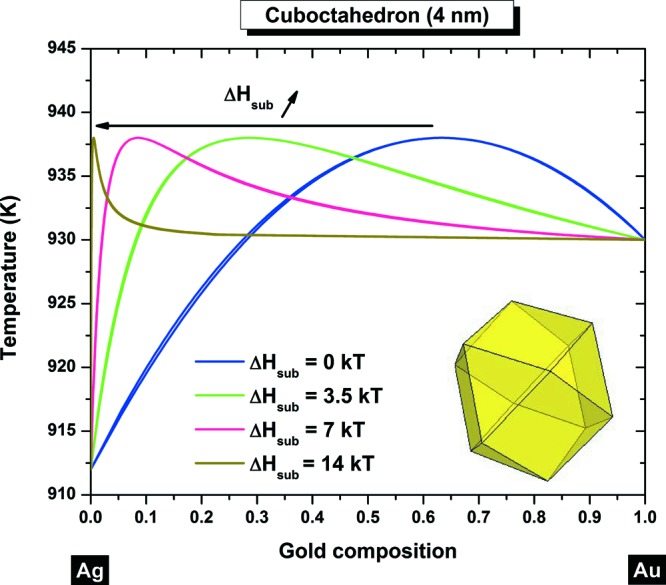
Nanophase diagram of a cuboctahedron at 4 nm calculated with different ΔHsub/kT values. In all cases, silver is always predicted to be found preferentially at the surface.
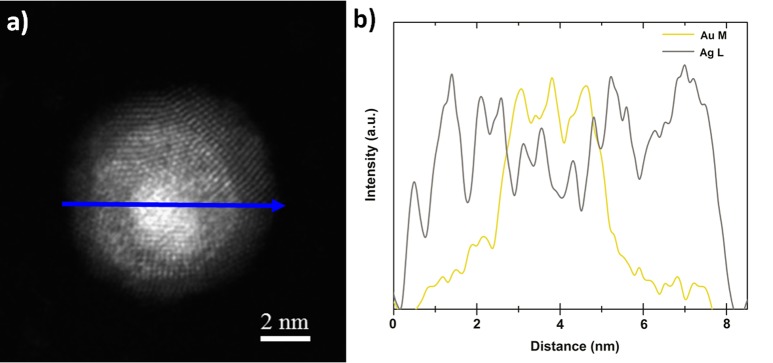
Therefore, the nature of the segregated element is not modified by the tilting effect; this conclusion is especially important for the study of nanoalloys in general. Indeed, we may find other nanoalloys exhibiting this tilting effect in their phase diagrams when the size is reduced and for some specific shapes; but from our current study we know that this behavior will not modify the nature of the segregated element. To predict the nature of the segregated element, preferentially found at the surface of the bimetallic nanoalloy, we have developed two segregation rules based on the melting temperature and surface energy. The first rule says that if the bulk melting temperature of element A is larger than the one of element B, then element A will segregate to the surface. If the bulk melting temperature of both elements have more or less the same magnitude, then the segregated element will be determined by the surface energy, this will be the second rule. To be considered similar, the difference between the two melting points should be less than ∼10% of the highest melting temperature. The second rule says that if the solid surface energy of element A is smaller than the one of element B then element A will segregate to the surface. To be complete, before using those two segregation rules, we have to determine the miscibility of the alloy using the Hume–Rothery’s rules.37 In the case of total miscibility or partial miscibility, then the first and second rules apply. In the case of total immiscibility, only the second rule applies. Those rules have been summarized in Table 2 to explain the surface segregation of different bimetallic nanoalloys (Supporting Information). It has been shown experimentally that in the case of Au–Cu8 and Cu–Ni,27 the segregated element was Au and Ni, respectively, in very good agreement with the proposed rules. In the case of Ag–Cu, Ag–Ni, and Ag–Co, according the proposed rules, Ag always goes to the surface, in very good agreement with ref (53). In the case of Pt–Au, Pt–Ni, and Pt–Pd, the segregated element has been demonstrated by Reyes-Nava et al.54 to be Au, Pt, and Pd, respectively, again in very good agreement with the proposed rules. In the case of Au–Ni, by applying our rules, we predict that Au goes to the surface in agreement with ref (55). In this work, Au–Ag nanoparticles have been synthesized by wet chemistry and characterized by high resolution transmission electron microscopy (HRTEM), high angle annular dark field (HAADF) imaging and energy dispersive X-ray spectroscopy (EDX) analysis. As a result of the minor difference between the lattice constants of the two constitutive metals, direct identification through lattice parameter determination using HRTEM is not very useful. However, identification using the chemical signature of silver and gold through EDX line scan and EDX elemental mapping is decisive by confirming the presence of silver at the surface as theoretically predicted (Figures 6 and 7). Other EDX line scans are provided electronically as Supporting Information. The element found at the surface (silver) is also the one predicted by using the two segregation rules. Therefore, from all the bimetallic nanoalloys investigated in this manuscript (Table 2), it seems that the driving force for surface segregation is thermodynamics by minimizing the free energy of the nanoparticle. However, kinetic factors and oxidation effects may also play a role by promoting the more electropositive oxo-philic metal to migrate to the surface.
Table 2. Relationship between Immiscibility, Melting Temperature, and Solid Surface Energies for Different Bi-metallic Alloys.
| alloy | immiscibility | Tm,∞ (1st rule) | γs,hkl (2nd rule) | segregated element |
|---|---|---|---|---|
| Au–Ag | no | ∼ | > | Aga |
| Au–Cu | no (ordered phases) | ∼ | < | Au8 |
| Pt–Pd | no | ∼ | > | Pd54 |
| Cu–Ni | no (miscibility gap at low temperatures) | < | < | Ni27 |
| Pt–Ni | no | > | < | Pt54 |
| Ag–Cu | partial (eutectic) | ∼ | < | Ag53 |
| Au–Pt | yes | < | < | Au54 |
| Au–Ni | yes | < | < | Au55 |
| Ag–Ni | yes | < | < | Ag53 |
| Ag–Co | yes | < | < | Ag53 |
This work.
Figure 6.
(a) HAADF-STEM image of an icosahedral Au50Ag50 nanoparticle having a size ∼8 nm. The blue arrow indicates the scan direction. (b) EDX line scan across this particle revealing the silver surface enrichment.
Figure 7.
(a) HAADF-STEM image of a decahedron Au50Ag50 nanoparticle having a size ∼9 nm. The blue arrow indicates the scan direction. (b–d) EDX elemental chemical maps of Au, Ag, and overlay, respectively. Yellow regions in the EDX map indicate the presence of gold, whereas gray regions mark the presence of silver. The overlay mapping reveals the silver surface enrichment.
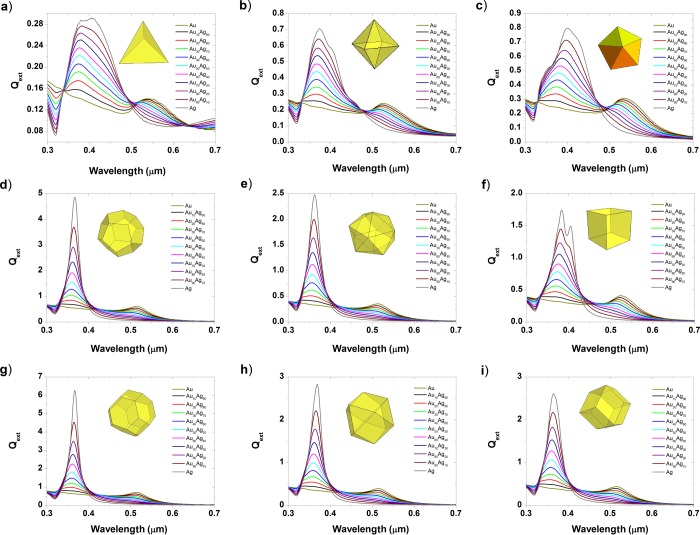
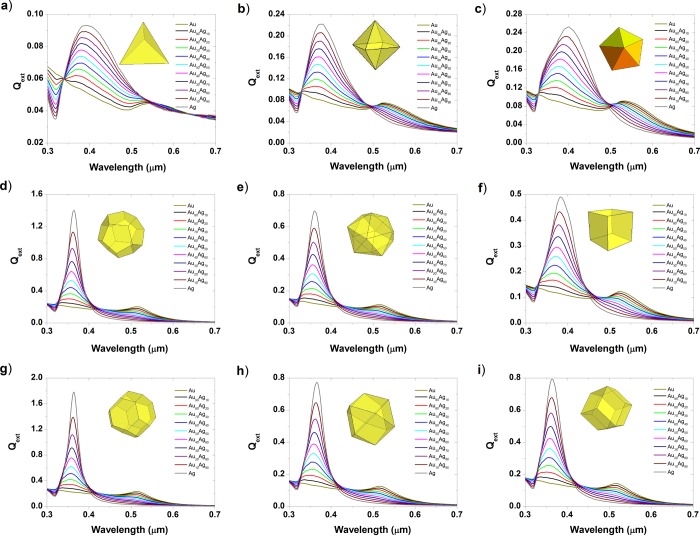
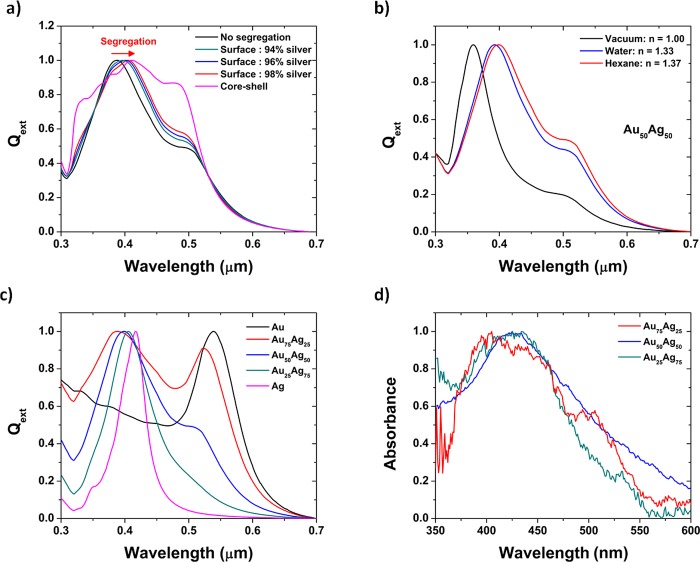
The presence of silver at the surface is particularly important in terms of optical response as shown by Lopez–Lozano et al.56 on a 147-atom AuAg cluster. Therefore, the optical properties of larger gold–silver nanoparticles were predicted by using the discrete dipole approximation method (DDA) developed by Purcell and Pennypacker.57 DDA has been coded in a program called DDSCAT,58,59 which is used for our calculations (Supporting Information). The absorption band observed in the UV–vis region is related to the surface plasmonic resonance (SPR) of the two metals constituting the alloy. Ag shows an intense SPR whereas Au exhibits a broad and damped SPR. The reason for this behavior is due to the different electronic configuration, specifically the position of the d orbitals in each metal. From Figures 8 and 9, it is clear that the SPR is more intense for larger sizes and becomes broadened and less intense with smaller sizes. At a given size, the truncated octahedron and the dodecahedron exhibit the strongest SPR around 0.36 μm. For each given shape, when the concentration of silver is increased in the Au1–x–Agx alloy, the absorption maximum shifts from 0.52 to 0.36 μm which corresponds to the SPR of gold and silver, respectively. Considering the surface segregation of silver, the SPR peak of Ag undergoes a redshift (Figure 10a). The situation is similar at smaller scales for clusters where the absorbance spectrum was not strongly affected by the chemical ordering as already reported by Barcaro et al.60 The largest shift appears for the core–shell structure which can be considered as the most extreme case of surface segregation. As the silver surface segregation increases, the peak becomes also broader. On Figure 10b, the effect of the solvent is investigated and a redshift of the most intense peak is observed when the refractive index of the solvent is increased. On Figure 10c, the optical properties of Au1–x–Agx nanoparticles immersed in hexane is plotted for different concentrations. Finally, the UV–visible spectrum is acquired experimentally for three different colloidal solutions, namely Au25Ag75, Au50Ag50, and Au75Ag25, where a very good agreement between the theory (Figure 10c) and the experiment (Figure 10d) was obtained.
Figure 8.
Extinction efficiency of gold–silver nanoparticles at a size equal to 10 nm for various shapes: (a) tetrahedron, (b) octahedron, (c) decahedron, (d) dodecahedron, (e) icosahedron, (f) cube, (g) truncated octahedron, (h) cuboctahedron, and (i) rhombic dodecahedron.
Figure 9.
Extinction efficiency of gold–silver nanoparticles at a size equal to 4 nm for various shapes: (a) tetrahedron, (b) octahedron, (c) decahedron, (d) dodecahedron, (e) icosahedron, (f) cube, (g) truncated octahedron, (h) cuboctahedron, and (i) rhombic dodecahedron.
Figure 10.
Extinction efficiency of a gold–silver cuboctahedron (length side =10 nm) (a) with different chemical orderings in hexane, (b) with different surrounding environments, (c) with different compositions in hexane, (d) experimental UV–vis spectrum.
Conclusions
The most important results achieved within this thermodynamic approach are the existence of a tilting effect found in the Au–Ag phase diagram at small sizes (10 and 4 nm) for some particular shapes (cube, rhombic dodecahedron and cuboctahedron) and the determination of the preferential presence of silver at the surface for all the shapes investigated. Two segregation rules based on melting temperatures and surface energies have been identified to predict the surface segregation in bimetallic nanoalloys. It has been shown that the surface segregation of silver had a small effect on the optical properties compared to the nature of the solvent. Of course, the composition of the alloy plays a fundamental role in the peak intensity of the SPR of Au and Ag. For a number of different alloys,8,27 nanothermodynamics has been shown to have excellent predictive and explanatory capabilities; however, a complete understanding of the behavior of nanoalloys is not possible using only one technique alone but requires all the current existing techniques, namely, nanothermodynamics, DFT, MD, and MMC to be used in coordination to reach that goal.
Methods
Chemicals
Gold chloride (AuCl, 99.9%), silver nitrate (AgNO3, 99.9999%), oleic acid (OA, 90%), and oleylamine (OLA, 70%) were used without any special treatment.
Synthesis
The synthesis was carried out by simultaneous reduction of gold and silver salts in the presence of oleic acid in organic solvent. The total metal concentration in the solutions was kept at 28 mM and the Au:Ag molar ratio was varied to obtain different composition. In a typical synthesis, gold chloride, silver nitrate, 0.5 mL of OA and 4.5 mL of OLA were mixed at room temperature, and then heated at 130 °C under magnetic stirring for 2 h. The solution gradually changed to a dark color. Subsequently, the temperature was increased to 300 °C (∼10 °C min–1) and kept for 30 min. Eventually, the colloidal solution was cooled at room temperature and the particles were precipitated by adding an excess of ethanol/acetone and centrifuging at 9000 rpm to remove all the undesirable products. The supernatant was discarded, and the precipitated was dispersed in hexane. This process was repeated two times. The resulting particles were drop-casted onto 3 mm nickel grids and dried in air for their subsequent characterization.
Electron Microscopy
For the electron microscopy analysis, a drop of the Au–Ag colloidal solution was deposited onto a commercial nickel TEM grid and dried in air. The Au–Ag nanoparticles have been observed and characterized by high resolution transmission electron microscopy (HRTEM), high angle annular dark field (HAADF) imaging and energy dispersive X-ray spectroscopy (EDX) analysis on a JEOL JEM-ARM200F (FEG-STEM/TEM) probe aberration corrected electron microscope operating at 200 kV. HAADF-STEM images were obtained with a convergence angle of 34 mrad and a collection semiangle varying from 50 to 180 mrad. The EDX analysis was performed using EDAX instrumentation attached to the JEOL ARM200F microscope. Line scans and chemical maps were obtained using the EDAX Genesis software. EDX spectra were obtained using a probe size of 0.13 nm with a probe current of 140 pA.
UV–Visible Spectroscopy
The UV–visible spectroscopy was carried out on a Cary 100 UV–vis spectrophotometer from Agilent Technologies. A baseline was acquired using hexane as reference and then the absorbance of three different colloidal solutions (Au25Ag75, Au50Ag50, and Au75Ag25) was measured.
Acknowledgments
This project was supported by grants from the Welch Foundation (AX-1615 and AX-1857) the UTSA International Center for Nanotechnology and Advanced Materials (1000000321), the National Center for Research Resources (G12RR013646-12), and the National Institute on Minority Health and Health Disparities (G12MD007591) from the National Institutes of Health. The authors would also like to acknowledge the NSF PREM No. DMR0934218, the Mexican Council for Science and Technology, CONACYT (Mexico) through the CIAM grants 148967 and 216315, the Ph.D. scholarship for J. A. Robledo-Torres, and the postdoctoral grant 232171. Finally, high performance computing resources granted at the CNS-IPICYT are also acknowledged.
Supporting Information Available
The Supporting Information is available free of charge on the ACS Publications website at DOI: 10.1021/acsnano.5b05755.
TEM, HAADF-STEM images; segregation rules; DDA method (PDF)
The authors declare no competing financial interest.
Supplementary Material
References
- Botros N. S. Gold in Egypt: Does the future get worse or better?. Ore Geol. Rev. 2015, 67, 189–207. 10.1016/j.oregeorev.2014.11.018. [DOI] [Google Scholar]
- Grote G.A History of Greece; From the Earliest Period to the Close of the Generation Contemporary with Alexander the Great; J. Murray: 1907; Vol. 2. [Google Scholar]
- Troalen L. G.; Tate J.; Guerra M. F. Goldwork in Ancient Egypt: workshop practices at Qurneh in the 2nd Intermediate Period. J. Archaeol. Sci. 2014, 50, 219–226. 10.1016/j.jas.2014.07.010. [DOI] [Google Scholar]
- Wallace R. W. The origin of Electrum Coinage. Am. J. Archaeol. 1987, 91, 385–397. 10.2307/505360. [DOI] [Google Scholar]
- Louis C.; Pluchery O.. Gold Nanoparticles for Physics, Chemistry and Biology; Imperial College Press: 2012. [Google Scholar]
- Gale N. H.; Stos-Gale Z. A. Ancient Egyptian Silver. J. Egypt. Archaeol. 1981, 67, 103–115. 10.2307/3856605. [DOI] [Google Scholar]
- Boyle R. W.The Economics of Gold and Gold Mining; Springer: 1987. [Google Scholar]
- Guisbiers G.; Mejia-Rosales S.; Khanal S.; Ruiz-Zepeda F.; Whetten R. L.; Jose-Yacaman M. Gold–Copper Nano-Alloy, “Tumbaga”, in the Era of Nano: Phase Diagram and Segregation. Nano Lett. 2014, 14, 6718–6726. 10.1021/nl503584q. [DOI] [PMC free article] [PubMed] [Google Scholar]
- Roduner E. Size matters: why nanomaterials are different. Chem. Soc. Rev. 2006, 35, 583–592. 10.1039/b502142c. [DOI] [PubMed] [Google Scholar]
- Barnard A. S.; Curtiss L. A. Computational nano-morphology: Modeling shape as well as size. Rev. Adv. Mater. Sci. 2005, 10, 105–109. [Google Scholar]
- Calvo F. Influence of Size, Composition, and Chemical Order on the Vibrational Properties of Gold-Silver Nanoalloys. J. Phys. Chem. C 2011, 115, 17730–17735. 10.1021/jp205656m. [DOI] [Google Scholar]
- Ferrando R.; Jellinek J.; Johnston R. L. Nanoalloys: From theory to applications of alloy clusters and nanoparticles. Chem. Rev. 2008, 108, 845–910. 10.1021/cr040090g. [DOI] [PubMed] [Google Scholar]
- Jellinek J. Nanoalloys: tuning properties and characteristics through size and composition. Faraday Discuss. 2008, 138, 11–35. 10.1039/b800086g. [DOI] [PubMed] [Google Scholar]
- Chang Y. A.; Chen S. L.; Zhang F.; Yan X. Y.; Xie F. Y.; Schmid-Fetzer R.; Oates W. A. Phase diagram calculation: past, present and future. Prog. Mater. Sci. 2004, 49, 313–345. 10.1016/S0079-6425(03)00025-2. [DOI] [Google Scholar]
- Lai S. L.; Guo J. Y.; Petrova V.; Ramanath G.; Allen L. H. Size-dependent melting properties of small tin particles: Nanocalorimetric measurements. Phys. Rev. Lett. 1996, 77, 99–102. 10.1103/PhysRevLett.77.99. [DOI] [PubMed] [Google Scholar]
- Zhang M.; Efremov M. Y.; Schiettekatte F.; Olson E. A.; Kwan A. T.; Lai S. L.; Wisleder T.; Greene J. E.; Allen L. H. Size-dependent melting point depression of nanostructures: Nanocalorimetric measurements. Phys. Rev. B: Condens. Matter Mater. Phys. 2000, 62, 10548–10557. 10.1103/PhysRevB.62.10548. [DOI] [Google Scholar]
- Li Z. H.; Truhlar D. G. Nanothermodynamics of metal nanoparticles. Chem. Sci. 2014, 5, 2605–2624. 10.1039/c4sc00052h. [DOI] [Google Scholar]
- Yang C. C.; Mai Y. W. Thermodynamics at the nanoscale: A new approach to the investigation of unique physicochemical properties of nanomaterials. Mater. Sci. Eng., R 2014, 79, 1–40. 10.1016/j.mser.2014.02.001. [DOI] [Google Scholar]
- Hill T. L.Thermodynamics of Small Systems, Part I. W. A. Benjamin, Inc.: New York, 1963. [Google Scholar]
- Hill T. L. A different approach to nanothermodynamics. Nano Lett. 2001, 1, 273–275. 10.1021/nl010027w. [DOI] [Google Scholar]
- Friesner R. A. Ab initio quantum chemistry: Methodology and applications. Proc. Natl. Acad. Sci. U. S. A. 2005, 102, 6648–6653. 10.1073/pnas.0408036102. [DOI] [PMC free article] [PubMed] [Google Scholar]
- Curtarolo S.; Morgan D.; Ceder G. Accuracy of ab initio methods in predicting the crystal structures of metals: A review of 80 binary alloys. CALPHAD: Comput. Coupling Phase Diagrams Thermochem. 2005, 29, 163–211. 10.1016/j.calphad.2005.01.002. [DOI] [Google Scholar]
- Tian P. Molecular dynamics simulations of nanoparticles. Annu. Rep. Prog. Chem., Sect. C: Phys. Chem. 2008, 104, 142–164. 10.1039/b703897f. [DOI] [Google Scholar]
- Qi W. H.; Lee S. T. Phase Stability, Melting, and Alloy Formation of Au-Ag Bimetallic Nanoparticles. J. Phys. Chem. C 2010, 114, 9580–9587. 10.1021/jp9113442. [DOI] [Google Scholar]
- Calvo F.; Cottancin E.; Broyer M. Segregation, core alloying, and shape transitions in bimetallic nanoclusters: Monte Carlo simulations. Phys. Rev. B: Condens. Matter Mater. Phys. 2008, 77, 121406. 10.1103/PhysRevB.77.121406. [DOI] [Google Scholar]
- Barnard A. S. Modelling of nanoparticles: approaches to morphology and evolution. Rep. Prog. Phys. 2010, 73, 086502. 10.1088/0034-4885/73/8/086502. [DOI] [Google Scholar]
- Guisbiers G.; Khanal S.; Ruiz-Zepeda F.; Roque de la Puente J.; Jose-Yacaman M. Cu-Ni Nano-Alloy: Mixed, Core-Shell or Janus Nano-Particle?. Nanoscale 2014, 6, 14630–14635. 10.1039/C4NR05739B. [DOI] [PubMed] [Google Scholar]
- Liu X. W.; Wang D. S.; Li Y. D. Synthesis and catalytic properties of bimetallic nanomaterials with various architectures. Nano Today 2012, 7, 448–466. 10.1016/j.nantod.2012.08.003. [DOI] [Google Scholar]
- Guo S. J.; Wang E. K. Noble metal nanomaterials: Controllable synthesis and application in fuel cells and analytical sensors. Nano Today 2011, 6, 240–264. 10.1016/j.nantod.2011.04.007. [DOI] [Google Scholar]
- Hammer B.; Norskov J. K. Why Gold Is the Noblest of All the Metals. Nature 1995, 376, 238–240. 10.1038/376238a0. [DOI] [Google Scholar]
- Jain P. K.; Huang X. H.; El-Sayed I. H.; El-Sayed M. A. Noble Metals on the Nanoscale: Optical and Photothermal Properties and Some Applications in Imaging, Sensing, Biology, and Medicine. Acc. Chem. Res. 2008, 41, 1578–1586. 10.1021/ar7002804. [DOI] [PubMed] [Google Scholar]
- Lee K. S.; El-Sayed M. A. Gold and silver nanoparticles in sensing and imaging: Sensitivity of plasmon response to size, shape, and metal composition. J. Phys. Chem. B 2006, 110, 19220–19225. 10.1021/jp062536y. [DOI] [PubMed] [Google Scholar]
- Negreiros F. R.; Sementa L.; Barcaro G.; Vajda S.; Apra E.; Fortunelli A. CO Oxidation by Subnanometer AgxAu3-x Supported Clusters via Density Functional Theory Simulations. ACS Catal. 2012, 2, 1860–1864. 10.1021/cs300275v. [DOI] [Google Scholar]
- Wang A. Q.; Hsieh Y.; Chen Y. F.; Mou C. Y. Au-Ag alloy nanoparticle as catalyst for CO oxidation: Effect of Si/Al ratio of mesoporous support. J. Catal. 2006, 237, 197–206. 10.1016/j.jcat.2005.10.030. [DOI] [Google Scholar]
- Shi H.; Ye X. S.; He X. X.; Wang K. M.; Cui W. S.; He D. G.; Li D.; Jia X. K. Au@Ag/Au nanoparticles assembled with activatable aptamer probes as smart ″nano-doctors″ for image-guided cancer thermotherapy. Nanoscale 2014, 6, 8754–8761. 10.1039/C4NR01927J. [DOI] [PubMed] [Google Scholar]
- Park J.; Lee J. Phase diagram reassessment of Ag-Au system including size effect. CALPHAD: Comput. Coupling Phase Diagrams Thermochem. 2008, 32, 135–141. 10.1016/j.calphad.2007.07.004. [DOI] [Google Scholar]
- Hume-Rothery W.; Mabbott G. W.; Channel Evans K. M. The Freezing Points, Melting Points, and Solid Solubility Limits of the Alloys of Silver, and Copper with the Elements of the B Sub-Groups. Philos. Trans. R. Soc., A 1934, 233, 1–97. 10.1098/rsta.1934.0014. [DOI] [Google Scholar]
- Jiang Q.; Weng Z.. Thermodynamics of Materials; Springer: 2011. [Google Scholar]
- Liang L. H.; Liu D.; Jiang Q. Size-dependent continuous binary solution phase diagram. Nanotechnology 2003, 14, 438–442. 10.1088/0957-4484/14/4/306. [DOI] [Google Scholar]
- Guisbiers G.; Abudukelimu G. Influence of nanomorphology on the melting and catalytic properties of convex polyhedral nanoparticles. J. Nanopart. Res. 2013, 15, 1431. 10.1007/s11051-013-1431-x. [DOI] [Google Scholar]
- Hassam S.; Gambino M.; Gauneescard M.; Bros J. P.; Agren J. Experimental and Calculated Ag + Au + Ge Phase-Diagram. Metall. Trans. A 1988, 19, 409–416. 10.1007/BF02649254. [DOI] [Google Scholar]
- Tanaka T.; Hara S. Thermodynamic evaluation of nano-particle binary alloy phase diagrams. Z. Metallkd. 2001, 92, 1236–1241. [Google Scholar]
- Lee J.; Park J.; Tanaka T. Effects of interaction parameters and melting points of pure metals on the phase diagrams of the binary alloy nanoparticle systems: A classical approach based on the regular solution model. CALPHAD: Comput. Coupling Phase Diagrams Thermochem. 2009, 33, 377–381. 10.1016/j.calphad.2008.11.001. [DOI] [Google Scholar]
- Chen F. Y.; Curley B. C.; Rossi G.; Johnston R. L. Structure, melting, and thermal stability of 55 atom Ag-Au nanoalloys. J. Phys. Chem. C 2007, 111, 9157–9165. 10.1021/jp0717746. [DOI] [Google Scholar]
- Nanda K. K.; Maisels A.; Kruis F. E.; Rellinghaus B. Anomalous thermal behavior of gold nanostructures. Epl-Europhys. Lett. 2007, 80, 56003. 10.1209/0295-5075/80/56003. [DOI] [Google Scholar]
- Williams F. L.; Nason D. Binary alloy surface compositions from bulk alloy thermodynamic data. Surf. Sci. 1974, 45, 377–408. 10.1016/0039-6028(74)90177-0. [DOI] [Google Scholar]
- Deng L.; Hu W. Y.; Deng H. Q.; Xiao S. F.; Tang J. F. Au-Ag Bimetallic Nanoparticles: Surface Segregation and Atomic-Scale Structure. J. Phys. Chem. C 2011, 115, 11355–11363. 10.1021/jp200642d. [DOI] [Google Scholar]
- Rossi G.; Ferrando R.; Rapallo A.; Fortunelli A.; Curley B. C.; Lloyd L. D.; Johnston R. L. Global optimization of bimetallic cluster structures. II. Size-matched Ag-Pd, Ag-Au, and Pd-Pt systems. J. Chem. Phys. 2005, 122, 194309. 10.1063/1.1898224. [DOI] [PubMed] [Google Scholar]
- Curley B. C.; Rossi G.; Ferrando R.; Johnston R. L. Theoretical study of structure and segregation in 38-atom Ag-Au nanoalloys. Eur. Phys. J. D 2007, 43, 53–56. 10.1140/epjd/e2007-00091-y. [DOI] [Google Scholar]
- Chen F. Y.; Johnston R. L. Energetic, electronic, and thermal effects on structural properties of Ag-Au nanoalloys. ACS Nano 2008, 2, 165–175. 10.1021/nn700226y. [DOI] [PubMed] [Google Scholar]
- Cerbelaud M.; Ferrando R.; Barcaro G.; Fortunelli A. Optimization of chemical ordering in AgAu nanoalloys. Phys. Chem. Chem. Phys. 2011, 13, 10232–10240. 10.1039/c0cp02845b. [DOI] [PubMed] [Google Scholar]
- Chen F.; Johnston R. L. Charge transfer driven surface segregation of gold atoms in 13-atom Au-Ag nanoalloys and its relevance to their structural, optical and electronic properties. Acta Mater. 2008, 56, 2374–2380. 10.1016/j.actamat.2008.01.048. [DOI] [Google Scholar]
- Laasonen K.; Panizon E.; Bochicchio D.; Ferrando R. Competition between Icosahedral Motifs in AgCu, AgNi, and AgCo Nanoalloys: A Combined Atomistic-DFT Study. J. Phys. Chem. C 2013, 117, 26405–26413. 10.1021/jp410379u. [DOI] [Google Scholar]
- Reyes-Nava J. A.; Rodriguez-Lopez J. L.; Pal U. Generalizing segregation and chemical ordering in bimetallic nanoclusters through atomistic view points. Phys. Rev. B: Condens. Matter Mater. Phys. 2009, 80, 161412. 10.1103/PhysRevB.80.161412. [DOI] [Google Scholar]
- Gaudry M.; Cottancin E.; Pellarin M.; Lerme J.; Arnaud L.; Huntzinger J. R.; Vialle J. L.; Broyer M.; Rousset J. L.; Treilleux M.; Melinon P. Size and composition dependence in the optical properties of mixed (transition metal/noble metal) embedded clusters. Phys. Rev. B: Condens. Matter Mater. Phys. 2003, 67, 155409. 10.1103/PhysRevB.67.155409. [DOI] [Google Scholar]
- Lopez-Lozano X.; Mottet C.; Weissker H. C. Effect of Alloying on the Optical Properties of Ag-Au Nanoparticles. J. Phys. Chem. C 2013, 117, 3062–3068. 10.1021/jp309957y. [DOI] [Google Scholar]
- Purcell E. M.; Pennypacker Cr. Scattering and Absorption of Light by Nonspherical Dielectric Grains. Astrophys. J. 1973, 186, 705–714. 10.1086/152538. [DOI] [Google Scholar]
- Draine B. T. The Discrete-Dipole Approximation and Its Application to Interstellar Graphite Grains. Astrophys. J. 1988, 333, 848–872. 10.1086/166795. [DOI] [Google Scholar]
- Draine B. T.; Flatau P. J. Discrete-Dipole Approximation for Scattering Calculations. J. Opt. Soc. Am. A 1994, 11, 1491–1499. 10.1364/JOSAA.11.001491. [DOI] [Google Scholar]
- Barcaro G.; Broyer M.; Durante N.; Fortunelli A.; Stener M. Alloying Effects on the Optical Properties of Ag-Au Nanoclusters from TDDFT Calculations. J. Phys. Chem. C 2011, 115, 24085–24091. 10.1021/jp2087219. [DOI] [Google Scholar]
- Martienssen W.; Warlimont H.. Springer Handbook of Condensed Matter and Materials Data; Springer: 2005. [Google Scholar]
- Vitos L.; Ruban A. V.; Skriver H. L.; Kollar J. The surface energy of metals. Surf. Sci. 1998, 411, 186–202. 10.1016/S0039-6028(98)00363-X. [DOI] [Google Scholar]
- Okamoto H.; Massalski T. B. The Ag-Au (silver-gold) system. Bull. Alloy Phase Diagrams 1983, 4, 30–38. 10.1007/BF02880317. [DOI] [Google Scholar]
Associated Data
This section collects any data citations, data availability statements, or supplementary materials included in this article.


