Abstract
Trk receptors play a key role in the development and maintenance of neuronal networks. Recent evidence suggests that the Trk family, specifically TrkA, is an important driver for tumour growth, inflammatory and neuropathic pain, and chemoresistance. Through a computational screen, a novel Trk active pharmacophore was identified and a series of pyrazine-based inhibitors were developed, which potently inhibited TrkA. Inhibitors displayed the highest activity on TrkA when screened against a small, tyrosine kinase panel and also exhibited a non-linear SAR. Predicted binding modes of the inhibitors were examined, which identified exploitable regions for future development of more advanced inhibitors.
Introduction
Tropomyosin receptor kinase (Trk) was first discovered as an oncogene that is activated through chromosomal rearrangement in human colon carcinoma.1 There are a total of three Trk isoforms: TrkA, TrkB, and TrkC and all bind neurotrophic factors2 with different specificities and affinities. The binding of a neurotrophin to the extracellular domain triggers Trk dimerization and phosphorylation of the cytoplasmic kinase domains. The activated Trk receptor signals through RAS, AKT, or PLC-γ to induce neurite outgrowth,3 cell growth,4 and cell survival.5 As such, the Trk family has become an important pharmacological target for cancer as well as pain. TrkB is involved in calcium signaling2 and membrane depolarization2 and TrkC is important for sensory ganglia5 and cardiac health.5
More specifically, the TrkA receptor has been extensively implicated in driving tumor pathology,6–10 inflammatory and neuropathic pain,11–15 as well as chemosensitization.16 Therefore, the pharmacological modulation of TrkA represents a novel approach for the treatment of cancer as well as cancer associated pain and chemotherapy resistance.
Efforts to inhibit the TrkA kinase have been made in the clinic,17 yet an FDA approved TrkA inhibitor has not yet been developed. Inhibitor progress has focused on creating novel chemotypes that are active on Trk receptors and validating in vitro and in vivo Trk biology.18 The generation of TrkA inhibitors has been conducted by diminishing the activity for other closely related receptor tyrosine kinases (RTKs) and enhancing TrkA activity.19 Additionally to generate TrkA inhibitors, modification of staurosporine has been completed.20 In another approach, TrkA inhibitors have been developed through the screening of a kinase library.21 Although some progress has been made on Trk inhibition, additional RTK selective inhibitors are still needed.
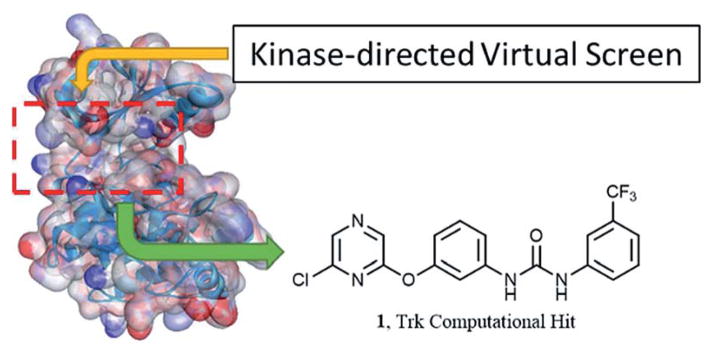
In an orthogonal approach to develop TrkA inhibitors, we utilized a computational screening assay.22 A kinase-directed virtual library was screened against the Trk kinase crystal structure and identified compound 1 as a novel active (Fig. 1). We decided to progress forward with 1 because of the novelty of the pyrazine moiety. The majority of all pyrazine-based inhibitors are aminopyrazines either directed at non-receptor tyrosine kinases23 or serine/threonine kinases.24 Therefore, the investigation of pyrazine-based inhibitors for TrkA could produce compounds with interesting potency and/or selectivity profiles.
Fig. 1.
Trk computational hit from a kinase-directed virtual library.
Results and discussion
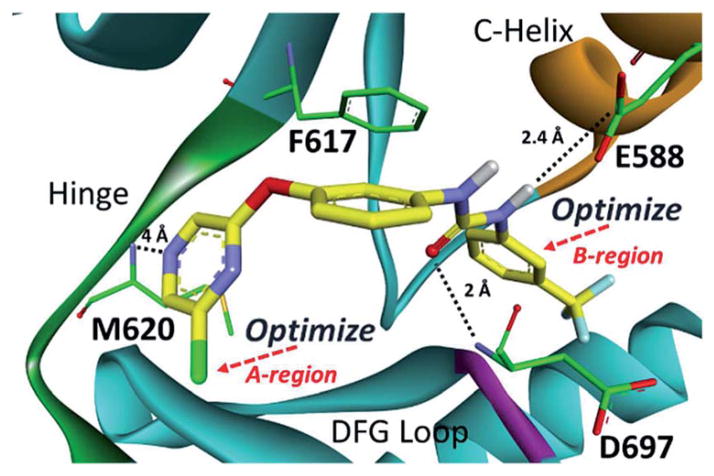
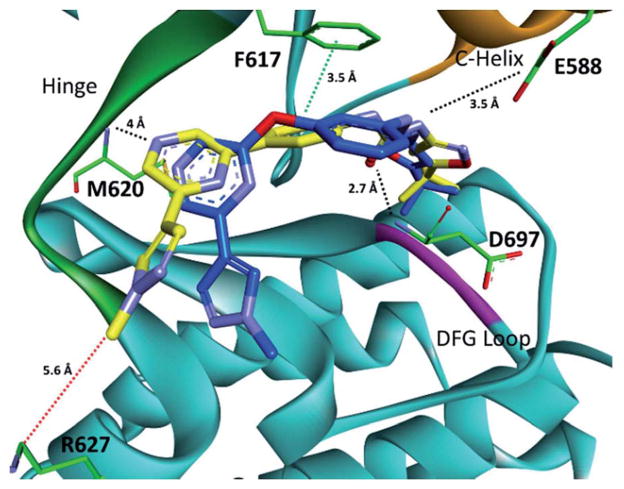
To validate the computational screen, compound 1 was synthesized utilizing a developed synthetic protocol (Scheme 1). 2,6-Dichloropyrazine was reacted with 3-aminophenol to generate intermediate 1a. Triphosgene was then utilized to form the isocyanate, which was subjected to nucleophilic addition from 3-trifluoromethyl aniline to generate computational hit 1. Compound 1 was screened against TrkA and was found active (TrkA IC50 = 3.5 μM) (Table 1). The inhibitor was modeled to identify possible points for optimization (Fig. 2). Compound 1 was found to hydrogen bond at the kinase hinge through a weak hydrogen bond (~4 Å) with M620. Additionally, 1 was predicted to form hydrogen bonds with D697 from the DFG (aspartic acid, phenylalanine, glycine) motif and E588 from the C-helix, and enter the DFG-out allosteric pocket. Compound 1 was not predicted to interact with the gatekeeper residue, F617.
Scheme 1.
(a) m-Aminophenol, DMA, K2CO3, 150 °C (b) triphosgene, TEA (c) amine, TEA (d) di-tert-butyl dicarbonate, THF, reflux (e) R1–B(OH)2, Pd2(dba)3, P(Cy)3, 4 : 1 DMF–H2O, Na2CO3, MWI 120 °C, 1 h (f) DCE/TFA (10%), MWI 80 °C, 10 min (g) triphosgene, TEA (h) NH2–R2, TEA.
Table 1.
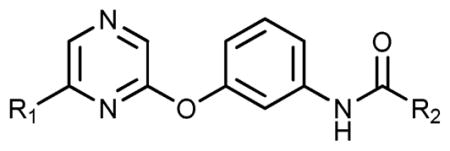
TrkA activity for compounds 1–35 generated from Scheme 1
| ||||
|---|---|---|---|---|
| Compound | R1 (A-region) | R2 (B-region) | %TrkA inhibition, 20a μM | TrkA IC50b (μM) |
| 1 | –Cl | 3-(Trifluoromethyl)aniline | — | 3.5 ± 1.6 |
| 1a | –Cl | 5-(tert-Butyl)isoxazol-3-amine | — | >100 |
| 1b | –Cl | 3-(tert-Butyl)aniline | — | >100 |
| 5 | p-Anisole | 4-Isopropylaniline | 98.0 ± 0.5 | 0.38 ± 0.10 |
| 6 | p-Anisole | 3-(Trifluoromethyl)aniline | 95.5 ± 0.5 | 1.6 ± 0.4 |
| 7 | p-Anisole | 4-(tert-Butyl)aniline | 33.8 ± 13.8 | — |
| 8 | p-Anisole | 3-(tert-Butyl)isoxazol-5-amine | 37.2 ± 10.1 | — |
| 9 | p-Anisole | 5-(tert-Butyl)isoxazol-3-amine | 98.6 ± 3.1 | 0.047 ± 0.021 |
| 10 | p-Anisole | 3-(tert-Butyl)-1-methyl-1H-pyrazol-5-amine | 15.5 ± 4.2 | — |
| 11 | 3-Thiophene | 4-Isopropylaniline | 99.2 ± 0.6 | 0.87 ± 0.31 |
| 12 | 3-Thiophene | 3-(Trifluoromethyl)aniline | 96.2 ± 1.5 | 1.1 ± 0.30 |
| 13 | 3-Thiophene | 4-(tert-Butyl)aniline | 27.7 ± 1.9 | — |
| 14 | 3-Thiophene | 3-(tert-Butyl)isoxazol-5-amine | 69.0 ± 7.6 | — |
| 15 | 3-Thiophene | 5-(tert-Butyl)isoxazol-3-amine | 100.4 ± 0.3 | 0.039 ± 0.012 |
| 16 | 3-Thiophene | 3-(tert-Butyl)-1-methyl-1H-pyrazol-5-amine | 26.8 ± 4.2 | — |
| 17 | 4-(Methylsulfonyl)benzene | 4-Isopropylaniline | 96.9 ± 1.9 | 0.42 ± 0.28 |
| 18 | 4-(Methylsulfonyl)benzene | 3-(Trifluoromethyl)aniline | 90.8 ± 0.1 | 1.7 ± 1.3 |
| 19 | 4-(Methylsulfonyl)benzene | 4-(tert-Butyl)aniline | 46.7 ± 2.4 | — |
| 20 | 4-(Methylsulfonyl)benzene | 5-(tert-Butyl)isoxazol-3-amine | 96.5 ± 1.6 | 0.092 ± 0.010 |
| 21 | 4-(Methylsulfonyl)benzene | 3-(tert-Butyl)-1-methyl-1H-pyrazol-5-amine | 94.0 ± 3.4 | 0.49 ± 0.020 |
| 22 | 4-1-Methyl-1H-pyrazole | 4-Isopropylaniline | 56.3 ± 0.1 | — |
| 23 | 4-1-Methyl-1H-pyrazole | 3-(Trifluoromethyl)aniline | 92.0 ± 1.7 | 0.53 ± 0.13 |
| 24 | 4-1-Methyl-1H-pyrazole | 4-(tert-Butyl)aniline | 86.9 ± 2.8 | — |
| 25 | 4-1-Methyl-1H-pyrazole | 3-(tert-Butyl)isoxazol-5-amine | 48.8 ± 1.1 | — |
| 26 | 4-1-Methyl-1H-pyrazole | 5-(tert-Butyl)isoxazol-3-amine | 100.7 ± 0.2 | 0.024 ± 0.014 |
| 27 | 4-1-Methyl-1H-pyrazole | 3-(tert-Butyl)-1-methyl-1H-pyrazol-5-amine | 61.1 ± 1.3 | — |
| 28 | 5-Pyrimidine | 4-Isopropylaniline | 28.2 ± 1.2 | — |
| 29 | 5-Pyrimidine | 3-(Trifluoromethyl)aniline | 69.3 ± 6.3 | — |
| 30 | 5-Pyrimidine | 4-(tert-Butyl)aniline | 49.6 ± 2.8 | — |
| 31 | 5-Pyrimidine | 3-(tert-Butyl)isoxazol-5-amine | 79.4 ± 5.0 | — |
| 32 | p-Fluorobenzene | 4-Isopropylaniline | 56.9 ± 4.9 | — |
| 33 | p-fluorobenzene | 3-(Trifluoromethyl)aniline | 27.1 ± 1.2 | — |
| 34 | p-Fluorobenzene | 4-(tert-Butyl)aniline | 32.2 ± 7.6 | — |
| 35 | p-Fluorobenzene | 3-(tert-Butyl)isoxazol-5-amine | 47.2 ± 4.6 | — |
| 36 | p-Fluorobenzene | 5-(tert-Butyl)isoxazol-3-amine | 100.4 ± 0.2 | 0.022 ± 0.004 |
| 37 | p-Fluorobenzene | 3-(tert-Butyl)-1-methyl-1H-pyrazol-5-amine | 26.9 ± 6.7 | — |
The amount of activity at a 20 μM concentration of inhibitor: 100 is complete inhibition, 0 is complete activity. Completed in quadruplicate.
IC50 is the concentration of the inhibitor to block the enzyme activity by half. Completed in duplicate, reported value represents the average. Error is reported as the standard deviation of the average. [ATP] 190 μM.
Fig. 2.
Computational binding mode of 1 in TrkC.18 PDB accession number 3V5Q. Predicted ligand/receptor hydrogen bonds are denoted with black dotted lines. 1 is not predicted to pi–pi stack with F617.
Through the modeling study, two points for TrkA optimization were uncovered (Fig. 2): (1) A-region, the solvent pocket and (2) B-region, the allosteric pocket. Additional compounds were synthesized in an attempt to optimize both the A- and B-regions of compound 1 (Scheme 1). Intermediate 1a was protected with di-tert-butyl dicarbonate and then subjected to Suzuki coupling to generate 2a–f. Intermediates 2a–2f were then deprotected, transformed into the isocyanate, and coupled with various amines to generate compounds 5–37 (Table 1).
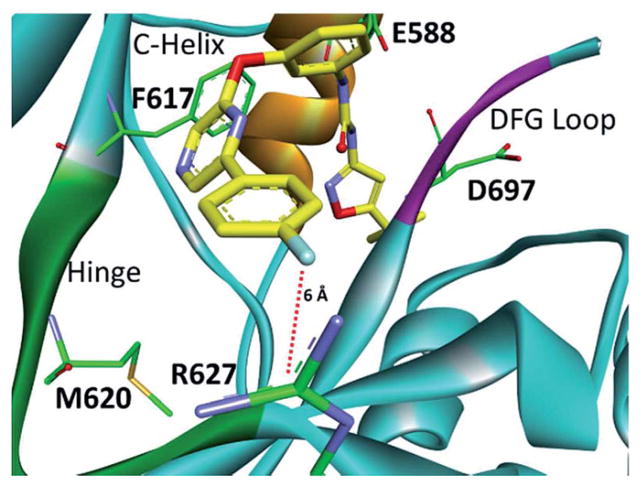
Compounds 5–37 were initially screened against TrkA at a single point concentration of 20 μM (Table 1) with ~200 μM ATP in the assay. Compounds that displayed greater than 90% single point inhibition were subjected to IC50 determination (Table 1). Based on the pyrazine scaffold, a number of interesting TrkA inhibitors were identified. At the A-region, aromatic moieties containing an atom that can hydrogen bond were generally found more potent as seen with compounds 5, 6, 9, 11, 12, 15, 17, 18, 20, 21, 23, and 23 when compared with non-hydrogen bonding counterparts, 32–37. The identified SAR is not linear, as moieties at the B-region strongly influence the TrkA activity as well. In fact, an appropriate combination of both A-region and B-region substituents is necessary to achieve good activity. This is seen with compounds 13, 14, and 16, which contain a hydrogen bonding substituent at the A-region, yet are relatively inactive. Therefore, both A- and B-regions collectively influence TrkA activity. When the A-region is fixed with a chlorine atom, compound 1a is not strongly active. However, when the chlorine is derivatized to generate 9, 15, 20, 26 and 36, TrkA affinity increases >1000 times. This is also suggestive of a non-linear SAR for compounds based on the structure of 1. Interestingly, p-fluorobenzene at the A-region also had good activity as seen with analogue 36. The A-region is located in the solvent region, adjacent to the TrkA kinase hinge. Apart from 36, moieties that can effectively engage the solvent region have good activity. A computational modeling study of 36 with a TrkA model revealed that the compound is in close proximity to Arg627 (6 Å) at the c-terminal lobe (Fig. 3). The electronegativity of fluorine can cause a large polarization of the benzene ring, which can create a strong ion–dipole interaction with arginine. It is plausible that the A-region moieties of compounds 9, 15, 20, and 26 also interact with Arg627 (Table 1).
Fig. 3.
Computational binding mode of 36 in the TrkA model. Lys627 (TrkC) was mutated to Arg627 (TrkA) to display the correct amino acid at this position for TrkA.18 PDB accession number 3V5Q. Predicted ligand/receptor ion–dipole interactions are denoted with red dotted lines.
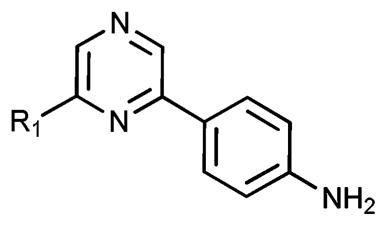
At the B-region, a lipophilic, aryl ring system that reaches into the DFG-out allosteric pocket is required to achieve activity as anilines unable to enter the allosteric pocket display weak activity (Table 3). The type of ring system is also very important, as B-region isomers seen with 8, 9, 14, 15, 25, 26, and 35, 36 are either very active or have minimal activity. Within the allosteric pocket of TrkA, there are a variety of lipophilic amino acids that hydrophobic substituents can engage. Small changes in heteroatoms can cause drastic differences in activity as seen with analogues 8, 9, 14, 15, 25, 26, 35, and 36 (Table 1). At the B-region of TrkA, it was found that 3-(trifluoromethyl)aniline does not produce strong inhibition. Rather, it was found that 5-(tert-butyl)isoxazol-3-amine and even 4-isopropylaniline produce noteworthy inhibitors. The R2 substituents are hypothesized to access the DFG-out allosteric pocket with conserved hydrophobic residues; therefore, correctly placed lipophilic moieties at the B-region can generate highly active TrkA inhibitors.
Table 3.
TrkA activity for 41–44
| ||
|---|---|---|
| Compound | R1 (A-region) | %TrkA inhibition,a 20 μM |
| 41 | 4-1-Methyl-1H-pyrazole | 46 ± 2.3 |
| 42 | 5-Pyrimidine | 77 ± 1.2 |
| 43 | –Cl | 47 ± 1.4 |
| 44 | 3-Thiophene | 17 ± 3.9 |
The amount of activity at a 20 μM concentration of inhibitor: 100 is complete inhibition, 0 is complete activity. Completed in quadruplicate.
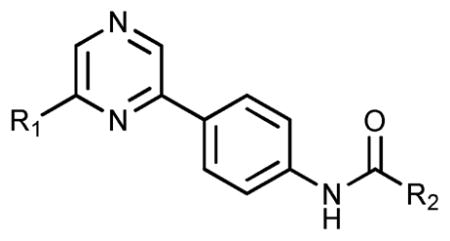
In an attempt to lower the amount of conformational energy of compounds generated from Scheme 1, compounds with a direct C–C bond were produced following the developed protocol outlined in Scheme 2. The compounds were evaluated in a similar manner for TrkA activity (Table 2). Interestingly, compounds 39 and 40, with a direct C–C bond to the pyrazine region, were far more potent than their ether linked counterparts. The amount of conformation compounds 39 and 40 can adapt is less then that for compounds 1, 1a–1b and 5–37, and therefore TrkA seems to prefer a more rigid scaffold.
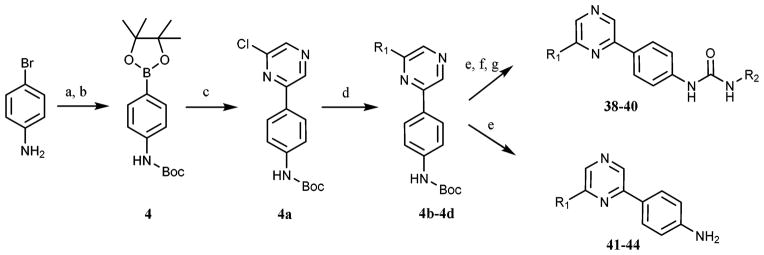
Scheme 2.
(a) Di-tert-butyl dicarbonate, toluene, 70 °C (b) Pd2(dba)3, P(Cy)3, THF, KOAc, bis(pinacolato)diboron, reflux (c) di-tert-butyl dicarbonate, THF, reflux (d) R1–B(OH)2, Pd2(dba)3, P(Cy)3, 4 : 1 DMF–H2O, Na2CO3, 85 °C, 12 h (e) DCE/TFA (10%), MWI 80 °C, 10 min (f) triphosgene, TEA (g) NH2–R2, TEA.
Table 2.
TrkA activity for compounds 36–38 generated from Scheme 2
| ||||
|---|---|---|---|---|
| Compound | R1 (A-region) | R2 (B-region) | %TrkA inhibition,a 20 μM | TrkA IC50b (μM) |
| 38 | –Cl | 5-(tert-Butyl)isoxazol-3-amine | 41.4 ± 3.3 | — |
| 39 | 4-1-Methyl-1H-pyrazole | 5-(tert-Butyl)isoxazol-3-amine | 96.1 ± 2.3 | 0.005 ± 0.012 |
| 40 | 4-1-Methyl-1H-pyrazole | 3-(tert-Butyl)-1-methyl-1H-pyrazol-5-amine | 99.7 ± 0.8 | 0.012 ± 0.005 |
The amount of activity at a 20 μM concentration of inhibitor: 100 is complete inhibition, 0 is complete activity. Completed in quadruplicate.
IC50 is the concentration of the inhibitor to block the enzyme activity by half. Completed in duplicate, reported value represents the average. Error is reported as the standard deviation of the average. [ATP] 190 μM.
Inhibitors that obtained IC50 values on TrkA less than 100 nM were subjected to screening in a small kinase panel with closely related RTKs (KDR, RET, and EphB2) (Table 4). Interestingly, screening against both KDR and EphB2 identified that inhibitors were upwards of 500 times more potent on TrkA. Screening against RET showed inhibitors to be a little less selective, but still able to achieve moderate selectivity.
Table 4.
RTK activity for 9, 15, 20, 26, 36 and 39–40
| Compound | RET IC50a (μM) | KDR IC50a (μM) | EphB2 IC50a (μM) |
|---|---|---|---|
| 9 | 0.14 ± 0.08 | >2.0 | >2.0 |
| 15 | 0.12 ± 0.07 | >2.0 | >2.0 |
| 20 | 0.21 ± 0.01 | 4.8 ± 0.5 | >2.0 |
| 26 | 0.33 ± 0.15 | 1.4 ± 0.001 | 0.88 ± 0.57 |
| 36 | 0.056 ± 0.005 | >2.0 | >2.0 |
| 39 | 0.063 ± 0.003 | 1.0 ± 0.09 | 2.9 ± 0.2 |
| 40 | 0.064 ± 0.004 | 0.96 ± 0.03 | 2.2 ± 0.5 |
IC50 is the concentration of the inhibitor to block the enzyme activity by half. Completed in duplicate, reported value represents the average. Error is reported as the standard deviation of the average. [ATP] 190 μM.
To rationalize RTK activity, crystal structures of KDR (1YWN),25 RET (2IVU),26 and EphB2 (3ZFM)27 were compared to TrkA (4F0I).28 The c-terminal helix region at Arg627 on TrkA was compared between KDR, RET, and EphB2. At the same region KDR contains a threonine, RET contains a glycine, and EphB2 contains a serine. Likely, residues found in KDR, RET, and EphB2 cannot efficiently engage A-region moieties, which is a possible reason for RTK selectivity. Interestingly, RET, which contains a glycine, achieved the highest affinity for the compounds, and suggests steric bulk from threonine (KDR) and serine (EphB2) diminishes compound affinity for both KDR and EphB2. We are currently completing further work to validate these suspicions.
To further examine activity of analogue 39, the compound was computationally modeled in our TrkA model, which contains the appropriate modified residue from Lys627 (TrkC) to Arg627 (TrkA). The binding of 39 was compared to 26 in order to assess how rotational freedom affects ligand/receptor interactions (Fig. 4). The major difference between the two binding modes is that 39 is predicted to engage in a pi–pi stacking interaction with F617, while 26 is not. Also, the ether linker of 26 seems to interfere with the ability to interact with the hinge region. 39, without an ether linker, is about 1 Å closer to M620 and can presumably form a stronger interaction at the hinge. Likely the ability of 39 to favorably interact with F617 and M620 causes a ~5 fold increase in TrkA inhibition in comparison to 26, respectively.
Fig. 4.
Computational binding modes of 26 and 39 in a TrkA model. PDB accession number 3V5Q. Predicted ligand/receptor interactions are denoted with black (hydrogen bonds), green (pi–pi stacking), and red (ion–dipole) dotted lines.
Conclusion
The Trk family, specifically TrkA, has been implicated as an important driver for tumor growth, inflammatory and neuropathic pain, and chemoresistance. As such, developing inhibitors for TrkA represents an attractive therapeutic avenue for treating different types of cancers as well as pain. Through the utilization of a large computational screen, compound 1 was identified as a new pharmacophore that achieved activity on the Trk family. Synthesis and follow-up biochemical screening identified 1 as a novel TrkA hit. After that, a pyrazine library was constructed around 1, which produced a variety of potent TrkA leads that exhibited a non-linear SAR. The compounds display good selectivity and represent validated starting points for Trk-driven drug discovery campaigns. Currently, we are evaluating inhibitors in cell and animal based models and assessing TrkB and C selectivity; the work will be published in due course.
General methods
All solvents were reagent grade or HPLC grade and all starting materials were obtained from commercial sources and used without further purification. Purity of final compounds was assessed using a Shimadzu ultra-high throughput LC/MS system (SIL-20A, LC-20AD, LC-MS 2020, Phenomenex® Onyx Monolithic C-18 Column) at variable wavelengths of 254 nM and 214 nM (Shimadzu PDA Detector, SPD-MN20A) and was >95%, unless otherwise noted. The HPLC mobile phase consisted of a water–acetonitrile gradient buffered with 0.1% formic acid. 1H NMR spectra were recorded at 400 MHz and 13C spectra were recorded at 100 MHz, both completed on a Varian 400 MHz instrument (Model# 4001S41ASP). Compound activity was determined with the EZ Reader II plate reader (PerkinElmer®, Walthman, USA) with an ATP concentration of ~200 μM. Computational modeling was completed with Auto-Dock Vina,22 AutoDock Tools, and Drug Discovery Studio 3.5. All compounds were purified using silica-gel (0.035–0.070 mm, 60 Å) flash chromatography, unless otherwise noted. Microwave assisted reactions were completed in sealed vessels using a Biotage Initiator microwave synthesizer.
Kinase virtual library
A virtual library has been designed to target the ATP active site of a given kinase. The virtual compound design consists of a heterocycle that can bind the hinge region paired with different substituents that can exploit regions specific to a kinase of interest. The library contains a diverse collection of compounds designed as both ATP and non-ATP competitive inhibitors. To screen against a given target, AutoDock Vina22 is employed and scores compounds based on calculated ΔG values. Compounds that achieve less than −10 kcal mol−1 affinity are progressed to an inhibitor-candidate stage. At this stage, predicted binding modes are investigated and compounds that contain prototypical drug-like properties are synthesized and evaluated biochemically.
Procedure for computational modeling studies
Computational modeling studies were completed using Auto-Dock Vina,22 AutoDock Tools, and Discovery Studio 3.5. Using AutoDock Tools, the Trk model was prepared as follows: (1) all water was removed, (2) all hydrogen was added as ‘Polar Only’, and (3) a grid box for the ATP binding site was created (center: x = −9.803, y = −29.975, z = −17.953/size: x = 22, y = 16, z = 58). Compounds to be computationally modeled were assigned torsions around rotatable bonds using AutoDock Tools. To computationally model the compounds, AutoDock Vina22 was employed. After the modeling study, the results were visualized and analyzed with Discovery Studio 3.5.
TrkA biochemical screening assay
Kinase activity was measured in a microfluidics assay that monitors the separation of a phosphorylated product from the substrate. The assay was run using a 12-sipper chip on a Caliper EZ Reader II (PerkinElmer, Walthman, USA) with the provided separation buffer containing CR-8. In 384-well polypropylene plates compound stocks (20 mM in DMSO) were diluted into kinase buffer (50 mM HEPES, 0.075% Brij-35, 0.10% Tween 20, 2 mM DTT, 10 mM MgCl2, and 0.02% NaN3) in 12-point 1/2log dilutions (2 mM–6.32 nM). Then, 1 μL was transferred into a 384-well polypropylene assay plate. The TrkA enzyme (Invitrogen) was diluted in kinase buffer to a concentration of 2 nM and 5 μL of the enzyme mixture was transferred to the assay plate. The inhibitors/TrkA enzyme were incubated for 60 minutes with minor shaking. A substrate mix was prepared containing ATP and 5FAM tagged TrkA peptide dissolved in kinase buffer, and 5 μL of the substrate mix was added to the assay plate. Running concentrations were as follows: ATP (190 μM), peptide (1.5 μM), compound 12-point 1/2log dilutions (0.2 mM–0.632 nM). For positive control, no inhibitor was added. For negative control, no enzyme was added. The plate was allowed to run until 10–20% conversion based on the positive control wells. Percent inhibition was measured for each well comparing starting peptide to phosphorylated product peaks relative to the baseline. Dose response curves, spanning the IC50 dose, were generated in GraphPad Prisim 6 and fit to an exponential one-phase decay line and IC50 values were obtained from the half-life value of the curve. IC50 values were generated in duplicate. An identical procure was used for RET, KDR, and EphB2 inhibition assays as well as single-point assays.
Synthesis of 3-((6-chloropyrazin-2-yl)oxy)aniline (1a)
2,6-Dichloropyrazine (5 g, 33.6 mmol), 3-aminophenol (3.66 g, 33.6 mmol), and potassium carbonate (9.26 g, 67.1 mmol) were placed into a round bottom flask fixed with a stir bar. DMA (100 mL) was added to the flask. The reaction was heated to 150 °C for one hour. The reaction was filtered and diluted with cold water. The reaction was extracted with EtOAc 3× and washed with water 10×. The organic layer was collected and dried with MgSO4 to generate 1a (5.7 g, 77%). 1H NMR (400 MHz, Chloroform-d) δ 8.27 (s, 1H), 8.22 (s, 1H), 7.18 (t, J = 8.1 Hz, 1H), 6.57 (ddd, J = 8.1, 2.2, 0.8 Hz, 1H), 6.53 (ddd, J = 8.1, 2.2, 0.8 Hz, 1H), 6.47 (t, J = 2.2 Hz, 1H), 3.79 (s, 2H).
Synthesis of tert-butyl(3-((6-chloropyrazin-2-yl)oxy)phenyl)-carbamate (2)
Compound 1a (5.08 g, 22.92 mmol) was dissolved in THF (30 mL). Boc anhydride (5.50 g, 25.2 mmol) was added to the reaction and the reaction was heated to reflux for 12 hours. The solvent from the reaction was evaporated and the reaction was diluted with EtOAc and washed with water 5×. The organic layer was collected and dried with MgSO4 and adsorbed onto silica. The reaction was purified with hexanes/EtOAc (to 25% EtOAc over 45 minutes). 2 was isolated as a white, to off white, powder (6.49 g, 88%). 1H NMR (400 MHz, Chloroform-d) δ 8.28 (s, 1H), 8.25 (s, 1H), 7.39 (s, 1H), 7.31 (t, J = 8.2 Hz, 1H), 7.14–7.09 (m, 1H), 6.83 (ddd, J = 8.2, 2.3, 0.6 Hz, 1H), 6.62 (s, 1H), 1.51 (s, 9H).
General synthesis of 2a–f and 4b–d
Compound 2 was placed into a 20 mL microwave vial along with sodium carbonate (4–5 eqv.), 4 : 1 DMF–water (10 mL), and a boronic acid or ester (1.5 eqv.). The reaction was degassed with argon. Pd2dba3 (0.02 eqv.) and PCy3 (0.04 eqv.) were added to the microwave vial and the reaction was sealed. The reaction was heated to 120 °C for 1 hour. After that, the reaction was added to a saturated sodium bicarbonate solution and extracted with 4 : 1 chloroform–IPA 5×. The organic was collected and dried with MgSO4. The reaction was purified with DCM/MeOH (to 15% MeOH over 45 minutes). Compounds 2a–f and 4b–d were generated in moderate to good yields (30–80%).
General protocol for boc-deprotection
Dichloroethane containing TFA (10%) was added to a boc-protected amine. The reaction was then microwaved at 80 °C for 10 minutes. Upon cooling, the reaction was carefully vented with a syringe and transferred to a separatory funnel. Water was added and the reaction was extracted with DCM 1×. The extract was discarded, followed by basification with aqueous NaHCO3. The reaction was extracted 5× with a 4 : 1 DCM–IPA solution. The organic extracts were combined and dried with MgSO4 and condensed to afford the free amine in high yields (90–99%).
General protocol for isocyanate generation
Triphosgene (1.05 eqv.) was dissolved in DCM or DCE. Then, a free amine (1.0 eqv.), dissolved in DCM or DCE and TEA (1.0 eqv.), was added dropwise to the triphosgene solution. The reaction was stirred at RT for 1 hour and was heated in a hot water (~40 °C) bath for 20 minutes. Conversion to the product was monitored by TLC. After 100% conversion to the isocyanate, the solvent was evaporated and the compound was used immediately in the next step without further purification. Compounds were generated in high yields (90–99%).
General protocol for urea linker generation, 5–37 and 38–40
An isocyanate derivative (1.0 eqv.) was dissolved in DCM or DCE. After that, an amine (1.5 eqv.) was dissolved in DCM or DCE and TEA (1.0 eqv.). The amine solution was added slowly to the isocyanate at RT with an immediate color change. After the addition, the reaction was sealed and stirred at RT for 12 hours. The product was washed with brine, and extracted with 4 : 1 DCM–IPA solution. The organic layer was dried with MgSO4 and purified by flash chromatography to generate urea compounds in moderate yields (30–50%).
Synthesis of tert-butyl (4-(4,4,5,5-tetramethyl-1,3,2-dioxaborolan-2-yl)phenyl)carbamate (4)
4-Bromoaniline (1.0 eqv.) and di-tert-butyl dicarbonate (1.2 eqv.) were added to toluene and stirred at 70 °C overnight. After that, the solvent was evaporated and the reaction was diluted with EtOAc. The reaction was washed with brine 3× and then purified using flash chromatography to generate 4 as white crystals. Then, 4 (1.0 eqv.), 4,4,4′,4′,5,5,5′,5′-octamethyl-2,2′-bi(1,3,2-dioxaborolane) (1.5 eqv.) and KOAc (4 eqv.) were added to THF. The reaction was violently degassed with argon. Pd2(dba)3 and P(Cy)3 were added and the reaction was heated to reflux for 12 hours under positive argon pressure. The reaction was filtered through Celite® and the solvent was evaporated. The reaction was dissolved in EtOAc and washed 3× with water. The organic layer was collected, dried with MgSO4, and adsorbed onto silica. The reaction was purified with flash chromatography using a hexanes/EtOAc gradient to isolate 4 (70%, 2 steps). 1H NMR (400 MHz, Chloroform-d) δ 7.73 (d, J = 8.5 Hz, 2H), 7.36 (d, J = 8.4 Hz, 2H), 6.54 (s, 1H), 1.52 (s, 9H), 1.33 (s, 12H).
Synthesis of tert-butyl (4-(6-chloropyrazin-2-yl)phenyl)-carbamate (4a)
2,6-Dichloropyrazine (1.5 eqv.) was added to a vial containing 4 : 1 DMF–water, 4a (1.0 eqv.), and Na2CO3 (4 eqv.). The reaction was degassed with argon for 10 minutes. Pd2(dba)3 and P(Cy)3 were added and the reaction was heated to 85 °C for 12 hours under positive argon pressure. The reaction was filtered through Celite®, diluted with EtOAc, and washed with water (50 mL, 5×). The reaction was purified with flash chromatography to generate 4a (65%). 1H NMR (400 MHz, Chloroform-d) δ 8.87 (s, 1H), 8.45 (s, 1H), 7.98 (d, J = 8.8 Hz, 2H), 7.52 (d, J = 8.8 Hz, 2H), 6.77 (s, 1H), 1.54 (s, 9H).
Example spectra for 4b–d series: 4b
1H NMR (400 MHz, Chloroform-d) δ 8.77 (s, 1H), 8.63 (s, 1H), 8.08 (s, 1H), 8.05 (s, 1H), 8.04 (d, J = 8.6 Hz, 2H), 7.52 (d, J = 8.6 Hz, 2H), 6.64 (s, 1H), 4.00 (s, 3H), 1.55 (s, 9H). ESIMS m/z [M + H]+ 352.
Example spectra for 41–44 series: 41
1H NMR (400 MHz, Chloroform-d) δ 8.72 (s, 1H), 8.56 (s, 1H), 8.07 (s, 1H), 8.04 (s, 1H), 7.93 (d, J = 8.6 Hz, 2H), 6.79 (d, J = 8.6 Hz, 2H), 3.99 (s, 3H). ESIMS m/z [M + H]+ 252.
Example spectra for 38–40 series: 39
1H NMR (400 MHz, Chloroform-d) δ 9.41 (s, 1H), 9.05 (s, 1H), 8.76 (s, 1H), 8.62 (s, 1H), 8.07–8.04 (m, 4H), 7.67 (d, J = 8.6 Hz, 2H), 6.04 (s, 1H), 3.99 (s, 3H), 1.37 (d, J = 1.1 Hz, 9H). 13C NMR (101 MHz, Chloroform-d) δ 181.45, 158.41, 152.41, 151.05, 146.80, 139.60, 138.57, 138.25, 137.68, 131.86, 129.40, 127.64, 120.73, 120.21, 91.95, 39.27, 32.94, 28.61. ESIMS m/z [M + H]+ 418.
Example spectra for 5–37 series: 9
1H NMR (400 MHz, Chloroform-d) δ 9.37 (s, 1H), 8.68 (s, 1H), 8.65 (s, 1H), 8.22 (s, 1H), 7.88 (d, J = 6.9 Hz, 2H), 7.63 (s, 1H), 7.39–7.31 (m, 2H), 6.99–6.93 (m, 3H), 5.89 (s, 1H), 3.83 (s, 3H), 1.33 (s, 9H). 13C NMR (101 MHz, Chloroform-d) δ 181.40, 161.18, 159.14, 158.28, 153.79, 152.23, 149.40, 139.31, 134.59, 132.06, 129.78, 128.36, 128.07, 116.55, 116.49, 114.33, 113.05, 91.75, 55.35, 32.89, 28.57. ESIMS m/z [M + H]+ 460.
Example spectra for 5–37 series: 36
1H NMR (400 MHz, Chloroform-d) δ 9.33 (s, 1H), 9.10 (s, 1H), 8.69 (s, 1H), 8.28 (s, 1H), 7.94–7.87 (m, 2H), 7.64 (t, J = 2.0 Hz, 1H), 7.38–7.30 (m, 2H), 7.14–7.06 (m, 2H), 6.95 (dd, J = 7.7, 2.0 Hz, 1H), 5.94 (s, 1H), 1.32 (s, 9H). 13C NMR (101 MHz, Chloroform-d) δ 181.37, 163.97, 159.11, 158.35, 153.56, 148.55, 139.30, 134.73, 133.06, 129.80, 128.86, 116.53, 115.95, 113.01, 111.99, 110.83, 107.56, 91.85, 32.88, 28.54. ESIMS m/z [M + H]+ 448.
Acknowledgments
This work was supported by a training grant from The National Institutes of Health (T32 GM008804), University of Arizona startup funding, and The Caldwell Health Sciences Research Fellowship.
Notes and references
- 1.Martin-Zanca D, Hughes SH, Barbacid M. Nature. 1986;319:743–748. doi: 10.1038/319743a0. [DOI] [PubMed] [Google Scholar]
- 2.Poo M. Nat Rev Neurosci. 2001;2:24–32. doi: 10.1038/35049004. [DOI] [PubMed] [Google Scholar]
- 3.Smeyne RJ, Klein R, Schnapp A, Long LK, Bryant S, Lewin A, Lira SA, Barbacid M. Nature. 1994;368:246–249. doi: 10.1038/368246a0. [DOI] [PubMed] [Google Scholar]
- 4.Chao MV. Nat Rev Neurosci. 2001;4:299–309. doi: 10.1038/nrn1078. [DOI] [PubMed] [Google Scholar]
- 5.Hung EJ, Reichardt LF. Annu Rev Biochem. 2003;72:609–642. doi: 10.1146/annurev.biochem.72.121801.161629. [DOI] [PubMed] [Google Scholar]
- 6.Vaishnavi A, Capelletti M, Le1 AT, Kako S, Butaney M, Ercan D, Mahale S, Davies KD, Aisner DL, Pilling AB, Berge EM, Kim J, Sasaki H, Park S, Kryukov G, Garraway LA, Hammerman PS, Haas J, Andrews SW, Lipson D, Stephens PJ, Miller VA, Varella-Garcia M, Jänne PA, Doebele RC. Nat Med. 2013;19:1469–1472. doi: 10.1038/nm.3352. [DOI] [PMC free article] [PubMed] [Google Scholar]
- 7.Com E, Lagadec C, Page A, Yazidi-Belkoura IE, Slomianny C, Spencer A, Hammache D, Rudkin BB, Hondermarck H. Mol Cell Proteomics. 2007;6:1842–1854. doi: 10.1074/mcp.M700119-MCP200. [DOI] [PubMed] [Google Scholar]
- 8.Davidson B, Reich R, Lazarovici P, Nesland JM, Skrede M, Risberg B. Clin Cancer Res. 2003;9:2248–2259. [PubMed] [Google Scholar]
- 9.Lagadec1 C, Meignan1 S, Adriaenssens E, Foveau B, Vanhecke E, Romon R, Toillon R, Oxombre B, Hondermarck H, Bourhis XL. Oncogene. 2009;28:1960–1970. doi: 10.1038/onc.2009.61. [DOI] [PubMed] [Google Scholar]
- 10.Campos X, Muñoz Y, Selman A, Yazigi R, Moyano L, Weinstein-Oppenheimer C, Lara HE, Romero C. Gynecol Oncol. 2007;104:148–175. doi: 10.1016/j.ygyno.2006.07.007. [DOI] [PubMed] [Google Scholar]
- 11.Indo Y, Tsuruta M, Hayashida Y, Karim MA, Ohta K, Kawano T, Mitsubuchi H, Tonoki H, Awaya Y, Matsuda I. Nat Genet. 1996;13:485–488. doi: 10.1038/ng0896-485. [DOI] [PubMed] [Google Scholar]
- 12.Shatzky S, Moses S, Levy J, Pinsk V, Hershkovitz E, Herzog L, Shorer Z, Luder A, Parvari1 R. Am J Med Genet, Part A. 2000;92:353–360. doi: 10.1002/1096-8628(20000619)92:5<353::aid-ajmg12>3.0.co;2-c. [DOI] [PubMed] [Google Scholar]
- 13.Ugolini G, Marinelli S, Covaceuszach S, Cattaneo A, Pavone F. Proc Natl Acad Sci U S A. 1999;96:4540–4545. doi: 10.1073/pnas.0611253104. [DOI] [PMC free article] [PubMed] [Google Scholar]
- 14.Hefti1 FF, Rosenthal1 A, Walicke1 PA, Wyatt S, Vergara1 G, Shelton DL, Davies AM. Trends Pharmacol Sci. 2006;27:85–91. doi: 10.1016/j.tips.2005.12.001. [DOI] [PubMed] [Google Scholar]
- 15.Indo Y. Hum Mutat. 2001;18:462–471. doi: 10.1002/humu.1224. [DOI] [PubMed] [Google Scholar]
- 16.Liu D, Zhang Y, Dang C, Ma Q, Lee W, Chen W. Oncol Rep. 2007;18:673–677. [PubMed] [Google Scholar]
- 17.Wang T, Yu D, Lamb ML. Expert Opin Ther Pat. 2009;19:305–319. doi: 10.1517/13543770902721261. and references therein. [DOI] [PubMed] [Google Scholar]
- 18.Albaugh P, Fan Y, Mi Y, Sun F, Adrian F, Li N, Jia Y, Sarkisova Y, Kreusch A, Hood T, Lu M, Liu G, Huang S, Liu Z, Loren J, Tuntland T, Karanewsky DS, Seidel HM, Molteni V. ACS Med Chem Lett. 2012;3:140–145. doi: 10.1021/ml200261d. [DOI] [PMC free article] [PubMed] [Google Scholar]
- 19.Raeppel SL, Gaudette F, Nguyen H, Beaulieu N, Wang J, Maroun C, Besterman JM, Vaisburg A. Int J Med Chem. 2012:412614. doi: 10.1155/2012/412614. [DOI] [PMC free article] [PubMed] [Google Scholar]
- 20.Tripathy R, Angeles TS, Yang SX, Mallamo JP. Bioorg Med Chem Lett. 2008;18:3551–3555. doi: 10.1016/j.bmcl.2008.05.012. [DOI] [PubMed] [Google Scholar]
- 21.Kim S, Tokarski JS, Leavitt KJ, Fink BE, Salvati ME, Moquin R, Obermeier MT, Trainor GL, Vite GG, Stadnick LK, Lippy JS, You D, Lorenzic MV, Chen P. Bioorg Med Chem Lett. 2008;18:634–639. doi: 10.1016/j.bmcl.2007.11.076. [DOI] [PubMed] [Google Scholar]
- 22.Trott O, Olson AJ. J Comput Chem. 2010;31:455–461. doi: 10.1002/jcc.21334. [DOI] [PMC free article] [PubMed] [Google Scholar]
- 23.Forns P, Esteve C, Taboada L, Alonso JA, Orellana A, Maldonado M, Carreño C, Ramis I, López M, Miralpeix M, Vidal B. Bioorg Med Chem Lett. 2012;22:2784–2788. doi: 10.1016/j.bmcl.2012.02.087. [DOI] [PubMed] [Google Scholar]
- 24.Whelligan DK, Solanki S, Taylor D, Thomson DW, Cheung KJ, Boxall K, Mas-Droux C, Barillari C, Burns S, Grummitt CG, Collins I, van Montfort RLM, Aherne GW, Bayliss R, Hoelder S. J Med Chem. 2010;53:7682–7698. doi: 10.1021/jm1008727. [DOI] [PMC free article] [PubMed] [Google Scholar]
- 25.Miyazaki Y, Matsunaga S, Tang J, Maeda Y, Nakano M, Philippe RJ, Shibahara M, Liu W, Sato H, Wang L, Nolteb RT. Bioorg Med Chem Lett. 2005;15:2203–2207. doi: 10.1016/j.bmcl.2005.03.034. [DOI] [PubMed] [Google Scholar]
- 26.Knowles PP, Murray-Rust J, Kjær S, Scott RP, Hanrahan S, Santoro M, Ibaáñez CF, McDonald NQ. J Biol Chem. 2006;281:33577–33587. doi: 10.1074/jbc.M605604200. [DOI] [PubMed] [Google Scholar]
- 27.Overman RC, Debreczeni JE, Truman CM, McAlister MS, Attwood TK. Protein Sci. 2014;23:627–638. doi: 10.1002/pro.2445. [DOI] [PMC free article] [PubMed] [Google Scholar]
- 28.Bertrand T, Kothe M, Liu J, Dupuy A, Rak A, Berne PF, Davis S, Gladysheva T, Valtre C, Crenne JY, Mathieu M. J Mol Biol. 2012;423:439–453. doi: 10.1016/j.jmb.2012.08.002. [DOI] [PubMed] [Google Scholar]


