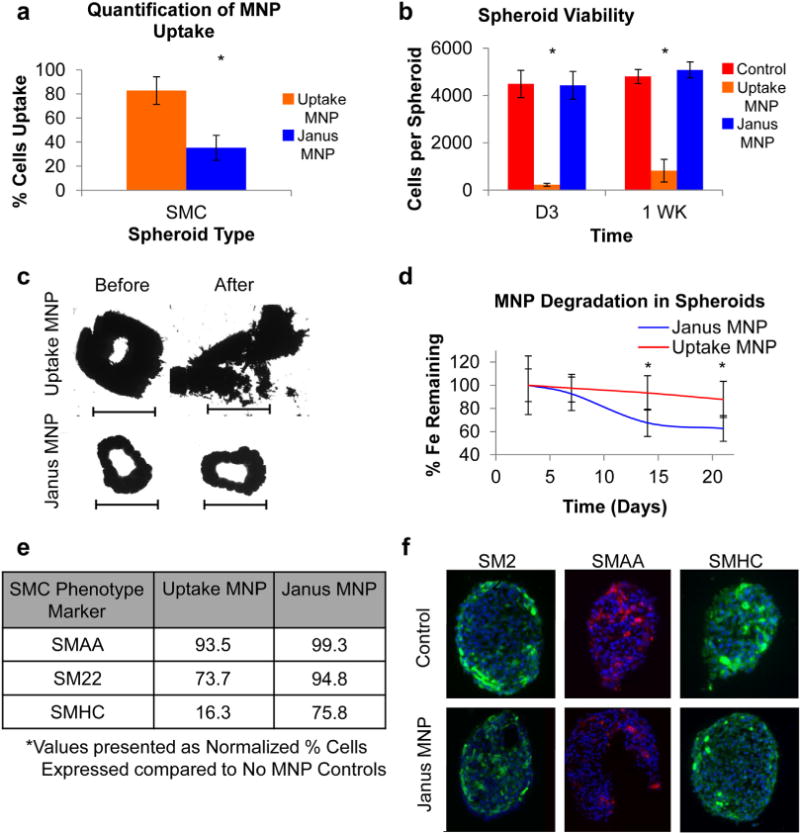
Fig. 2.

Janus vs. uptake magnetic cellular spheroids. (a) The amount of cells per spheroid that internalized MNPs was quantified and showed that JMCSs (35%) resulted in significantly less MNP internalization than uptake cellular spheroids (83%, *p < 0.05). (b) Additionally, cell viability analysis of cellular spheroids fabricated using Janus and uptake methods with primary rat aortic smooth muscle cells revealed that JMCSs maintained high viability compared to control spheroids without MNPs, while uptake spheroids exhibit low viability (*p < 0.05) at Days 3 and 7. (c) The use of both spheroid types for tissue engineering applications was analyzed by assembling fused rings via magnetic patterning. After 48 h of fusion, the magnetic patterns were removed and the rings transferred to another chamber. Results showed that rings assembled using uptake spheroids were unable to be physically manipulated and broke apart upon handling. Rings assembled using Janus spheroids, however, were capable of handling, and therefore applicable to tissue engineering applications (scale bars = 1000 μm). (d) The degradation of MNPs within cellular spheroids varied based on the method used to incorporate the MNPs, as results showed 37% degradation of initial MNP content within JMCSs after 21 days compared to only 12% degradation in uptake MNP spheroids (*p < 0.05). (e) SMC phenotype expression of three known SMC markers was quantified using flow cytometry (at least 1 million cells analyzed per sample). Results indicate that JMCSs exhibited similar expression of all three markers compared to controls, while uptake MNP spheroids showed decreased expression of SM22 and SMHC at Day 3. (f) Phenotype expression was qualitatively confirmed using IHC microscopy (red and green = marker, blue = nucleus), confirming uniform dispersion and equivalent expression levels of SMC phenotype markers in JMCSs compared to spheroids without MNP controls. (For interpretation of the references to color in this figure legend, the reader is referred to the web version of this article.)
